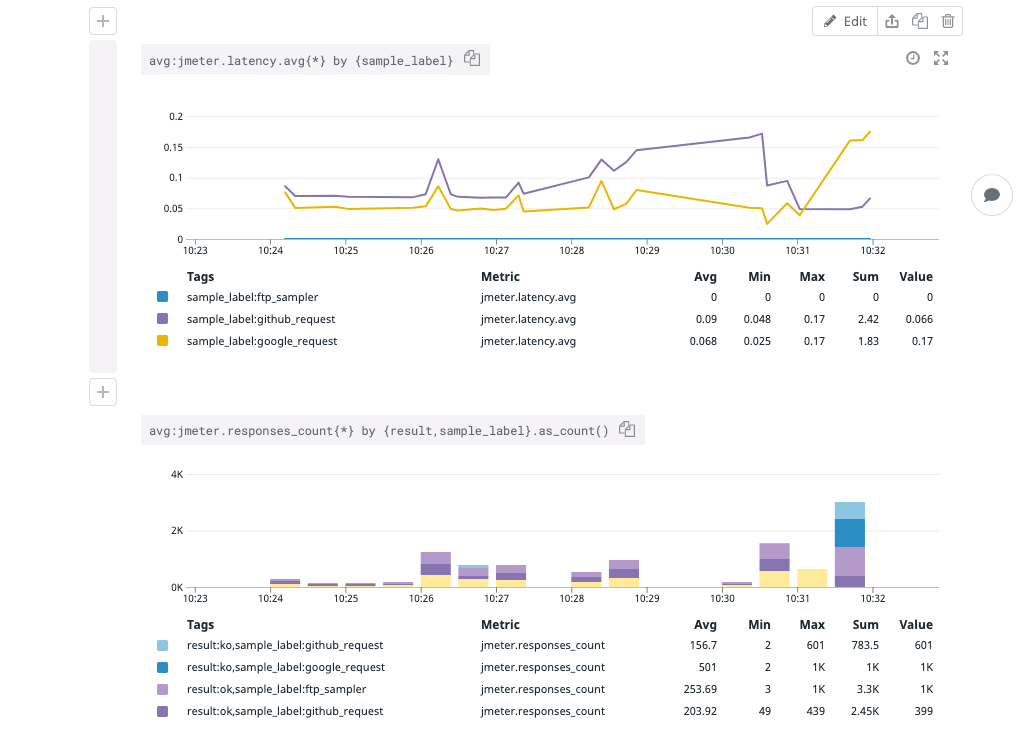
Datadog Backend Listener for Apache JMeter is a JMeter plugin used to send test results to the Datadog platform. It includes the following features:
- Real time reporting of test metrics (latency, bytes sent and more. See the
metricssection. - Real time reporting of test results as Datadog log events.
- Ability to include sub results.
You can install the plugin either manually or with JMeter Plugins Manager.
- Download the Datadog plugin JAR file from the release page
- Place the JAR in the
lib/extdirectory within your JMeter installation. - Launch JMeter (or quit and re-open the application).
- If not already configured, download the JMeter Plugins Manager JAR.
- Once you've completed the download, place the
.jarin thelib/extdirectory within your JMeter installation. - Launch JMeter (or quit and re-open the application).
- Go to
Options > Plugins Manager > Available Plugins. - Search for "Datadog Backend Listener".
- Click the checbox next to the Datadog Backend Listener plugin.
- Click "Apply Changes and Restart JMeter".
To start reporting metrics to Datadog:
- Right click on the thread group or the test plan for which you want to send metrics to Datadog.
- Go to
Add > Listener > Backend Listener. - Modify the
Backend Listener Implementationand selectorg.datadog.jmeter.plugins.DatadogBackendClientfrom the drop-down. - Set the
apiKeyvariable to your Datadog API key. - Run your test and validate that metrics have appeared in Datadog.
The plugin has the following configuration options:
| Name | Required | Default value | description |
|---|---|---|---|
| apiKey | true | NA | Your Datadog API key. |
| datadogUrl | false | https://api.datadoghq.com/api/ | You can configure a different endpoint, for instance https://api.datadoghq.eu/api/ if your datadog instance is in the EU |
| logIntakeUrl | false | https://http-intake.logs.datadoghq.com/v1/input/ | You can configure a different endpoint, for instance https://http-intake.logs.datadoghq.eu/v1/input/ if your datadog instance is in the EU |
| metricsMaxBatchSize | false | 200 | Metrics are submitted every 10 seconds in batches of size metricsMaxBatchSize |
| logsBatchSize | false | 500 | Logs are submitted in batches of size logsBatchSize as soon as this size is reached. |
| sendResultsAsLogs | false | false | By default only metrics are reported to Datadog. To report individual test results as log events, set this field to true. |
| includeSubresults | false | false | A subresult is for instance when an individual HTTP request has to follow redirects. By default subresults are ignored. |
| customTags | false | "" |
Comma-separated list of tags to add to every metric |
If for whatever reason you are not seeing JMeter metrics in Datadog, check your jmeter.log file, which should be in the /bin folder of your JMeter installation.
- Ensure the bug was not already reported
- If you're unable to find an open issue addressing the problem, open a new one.
- If you have a feature request, it is encouraged to contact the Datadog support so the request can be prioritized and properly tracked.
- Do not open an issue if you have a question, instead contact the Datadog support.
Have you fixed an issue or adding a new feature? Many thanks for your work and for letting other to benefit from it.
Here are some generic guidelines:
- Avoid changing too many things at once.
- Write tests for the code you wrote.
- Make sure all tests pass locally.
- Summarize your PR with a meaningful title and write a meaningful description for it.
Your pull request must pass the CI before we can merge it. If you're seeing an error and don't think it's your fault, it may not be. Let us know in the PR and we'll get it sorted out.
