- 1. Introduction
- 2. The Dataset
- 3. Feature Engineering
- 4. EDA - Exploratory Data Analysis
- 5. Data Preparation and Feature Selection
- 6. Machine Learning Model and Fine Tunning
- 7. How to use this Project
- 8. Next Steps
This repository contains the first iteration of CRISP-DS to analyze and create a Churn Classification Model to help a bank classify their customers based on their data.
Predicting customer churn is extremely important to any business, because the majority of the companies with high revenue are the companies which have high retention rates. Sean Ellis and Morgan Brown indicate in their book, Hacking Growth, that when a enterprise retain their clients, they just don't share and don't loose market space for their competitor, but will also increase their revenue. The books says that with only 5% retaintion rate, a company can increase up to 25% to 95% of their profit.
This Readme goal is to show how the project construction phases and analysis were done, and also show how to use the project in order to classify new clients if they will churn or not.
The dataset of this project can be found in the data/training directory
It has 14 columns and 10.000 lines.
| Column | Description |
|---|---|
RowNumber |
Row ID |
CustomerId |
Customer's ID |
Surname |
Customer's Last name |
CreditScore |
Customer's Credit Score |
Geography |
Customer's Country of Residence |
Gender |
Costumer's Gender |
Age |
Costumer's Age |
Tenure |
Quantity of years the customer is a bank's client client |
Balande |
How much money the client have on it's account |
NumOfProducts |
Quantity of products the client had purchased with the institution |
HasCrCard |
Indicates if the client has a credit card or not with the institution. 1 - client has credit card; 0 - client dosen't have credit card |
IsActiveMember |
Indicates if the client is active or not. 1 - active client; 0 - non active client |
EstimatedSalary |
Client's estimated anual salary |
Exited |
Indicates whether the client has an account at the institution. 1 - Client has exited the bank; 0 - client dosen't have exited the bank |
| attributes | min | max | range | mean | median | std | skew | kurtosis |
|---|---|---|---|---|---|---|---|---|
| credit_score | 350 | 850 | 500 | 650.753 | 652 | 96.5904 | -0.0795404 | -0.418624 |
| age | 18 | 92 | 74 | 38.9466 | 37 | 10.5262 | 1.03571 | 1.45945 |
| tenure | 0 | 10 | 10 | 5.01663 | 5 | 2.89661 | 0.0131241 | -1.17284 |
| balance | 0 | 238388 | 238388 | 76381.2 | 97055.1 | 62298.2 | -0.141721 | -1.49221 |
| num_of_products | 1 | 4 | 3 | 1.5295 | 1 | 0.581704 | 0.755984 | 0.636943 |
| has_cr_card | 0 | 1 | 1 | 0.70875 | 1 | 0.454338 | -0.919091 | -1.15556 |
| is_active_member | 0 | 1 | 1 | 0.514875 | 1 | 0.499779 | -0.0595375 | -1.99695 |
| estimated_salary | 11.58 | 199992 | 199981 | 99730.8 | 99446.9 | 57331.5 | 0.00712627 | -1.17479 |
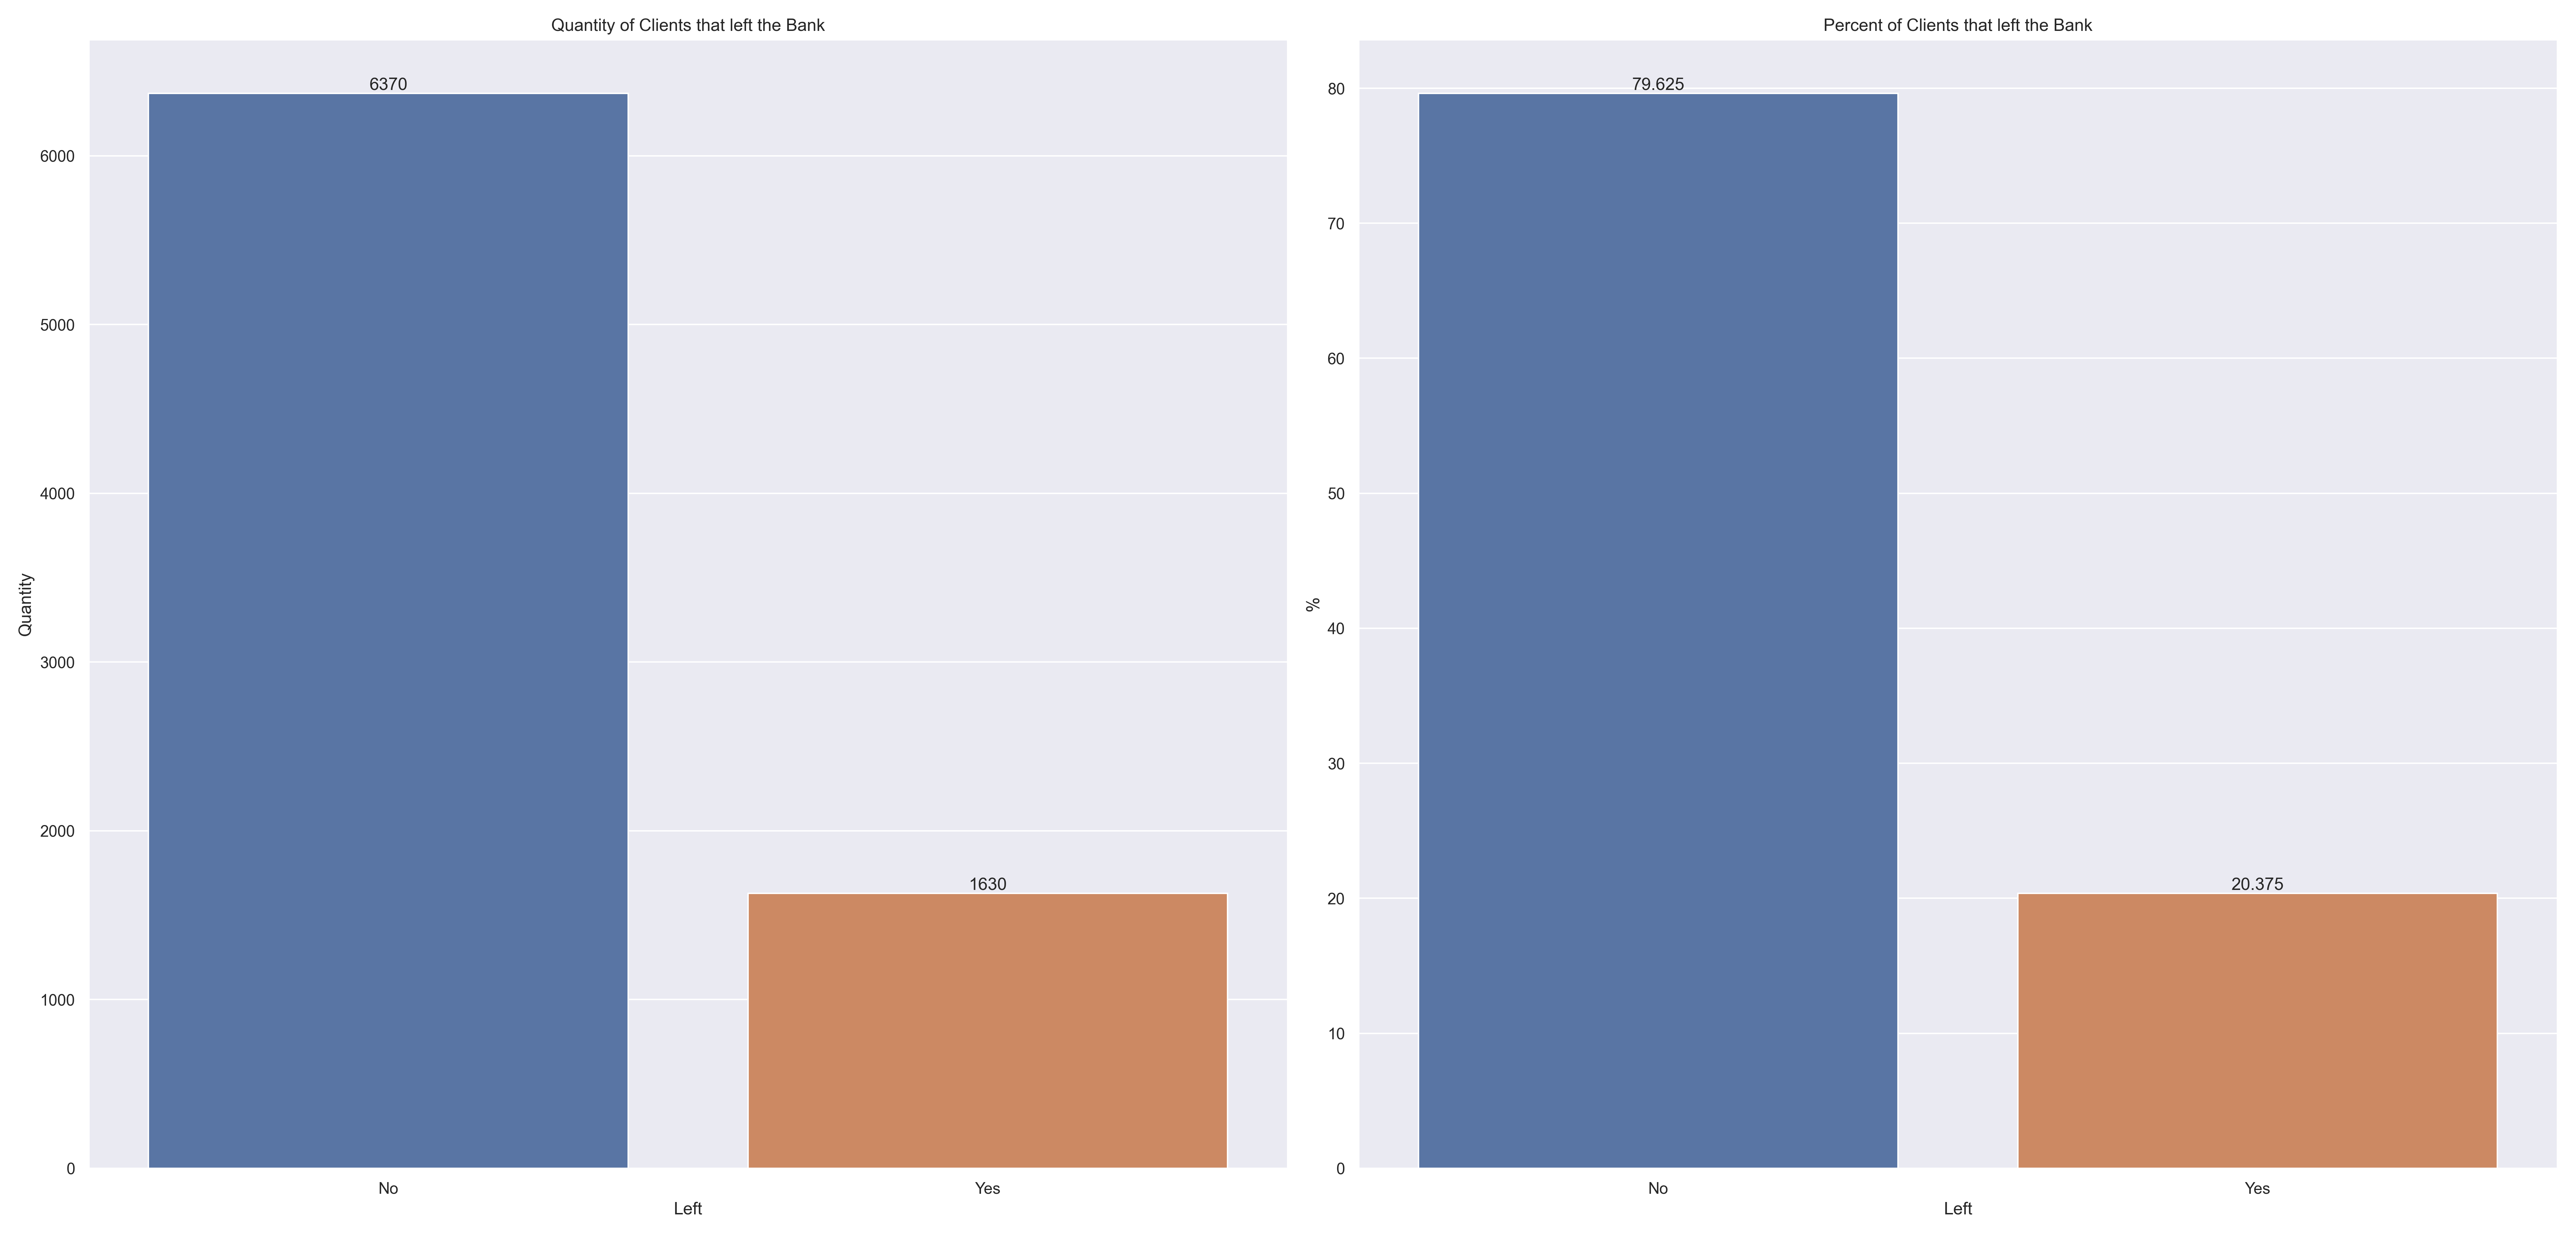
The actual Churn rate from the bank is 20.375%
Besides, we have the following analysis:
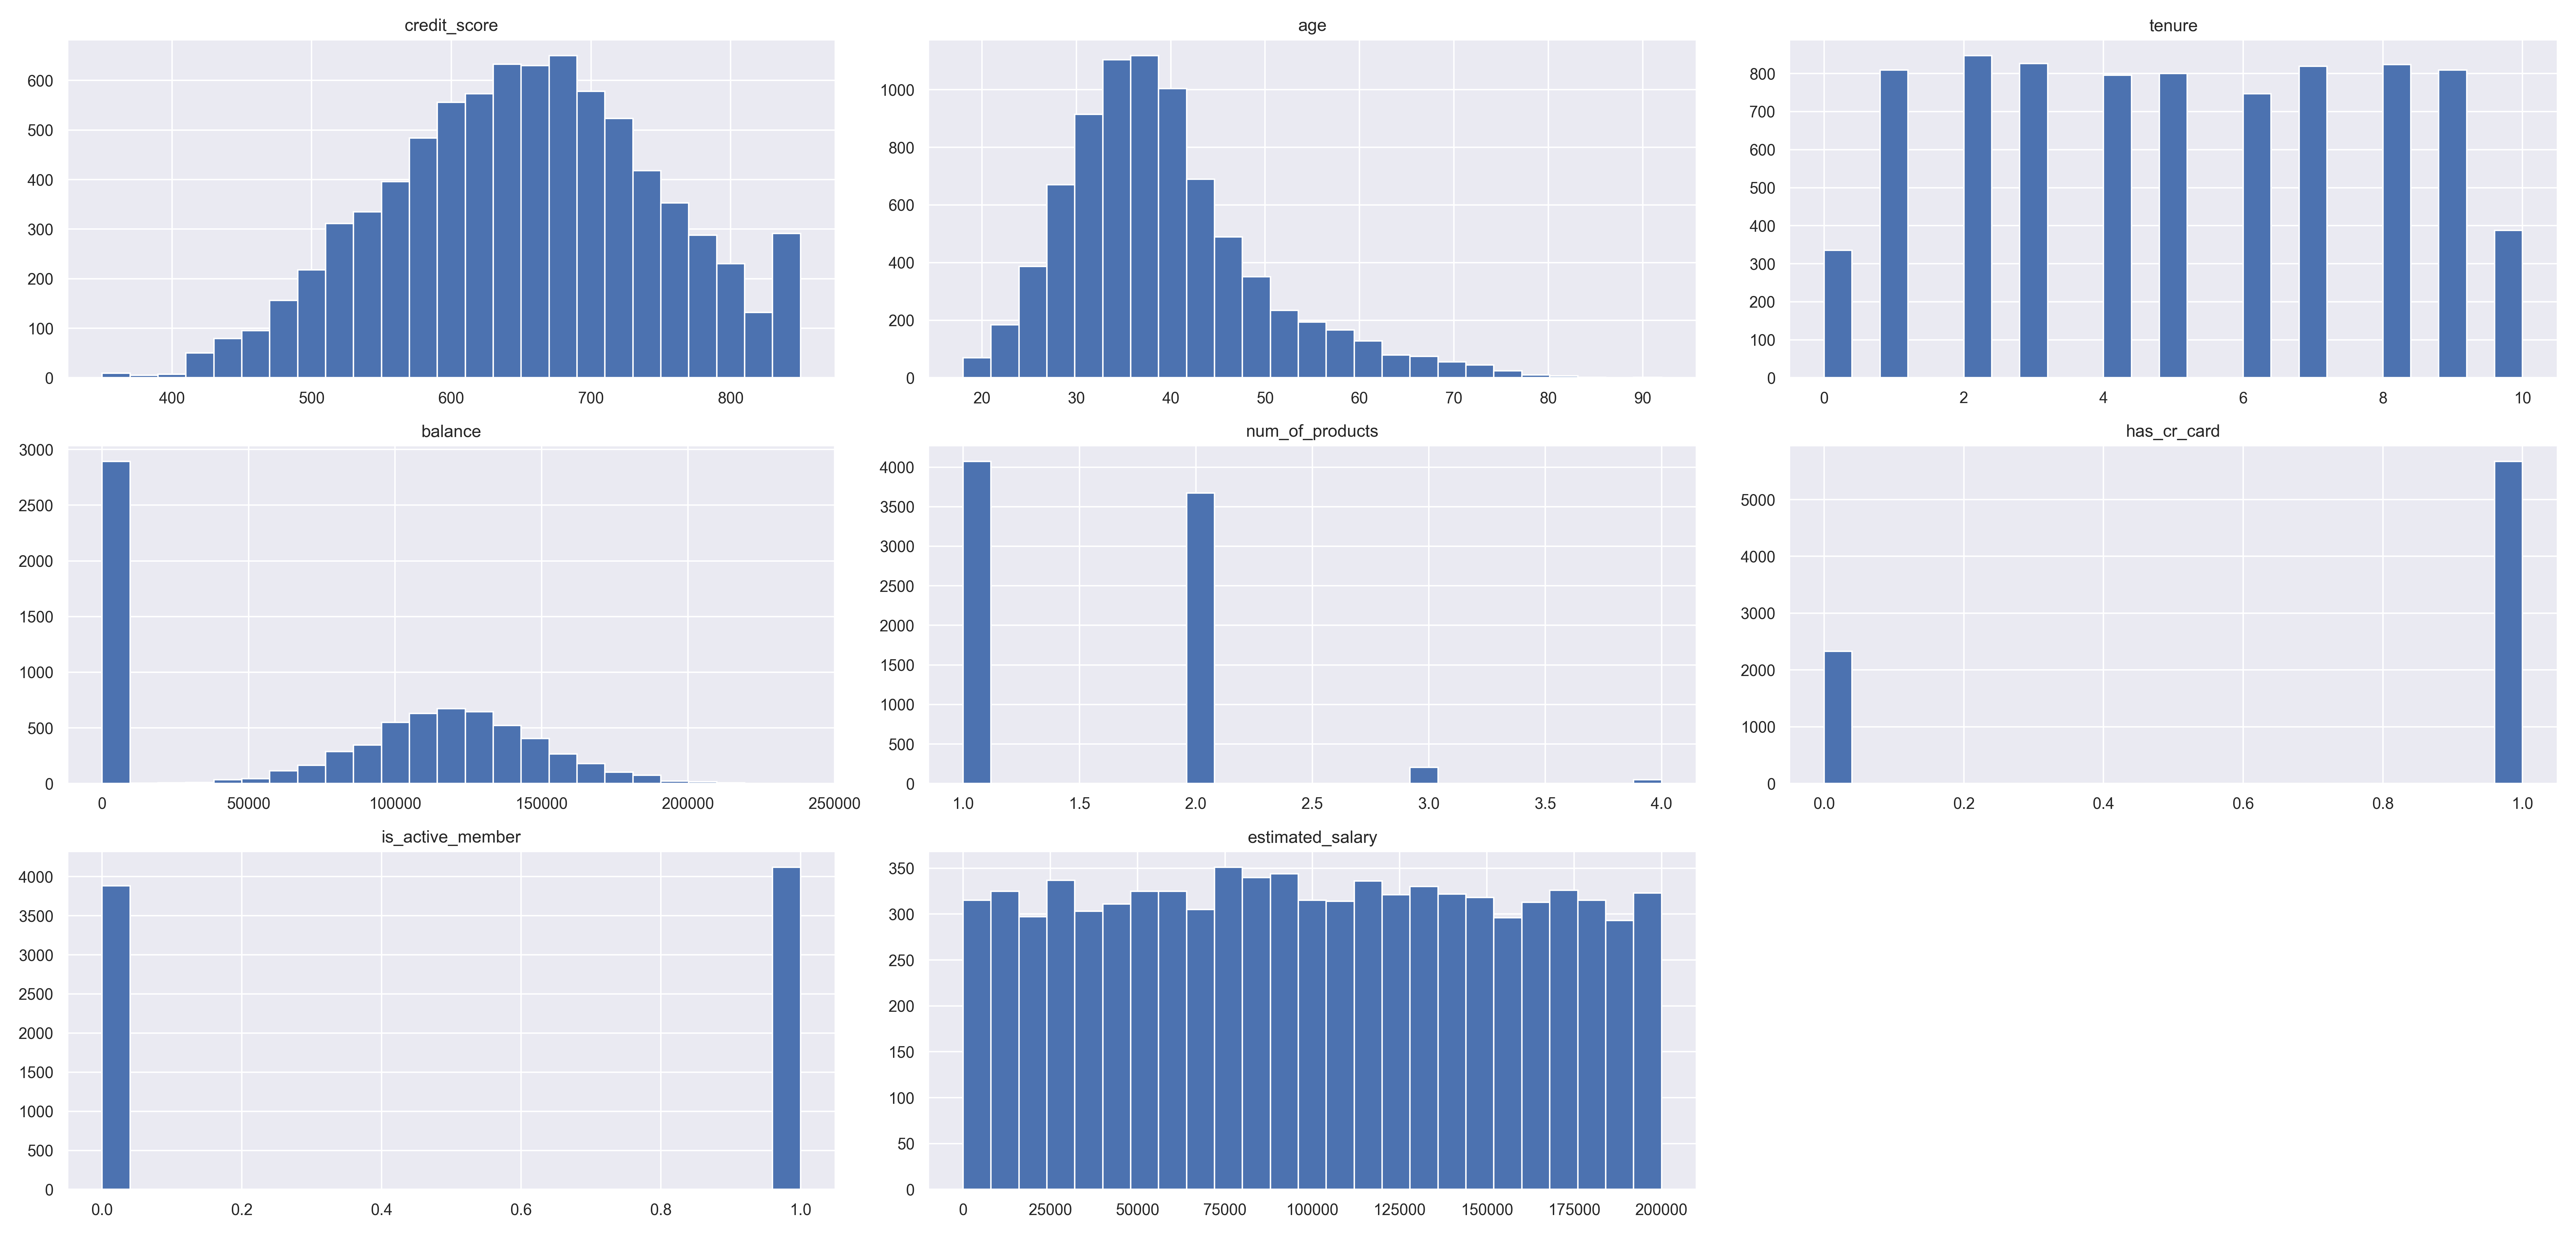
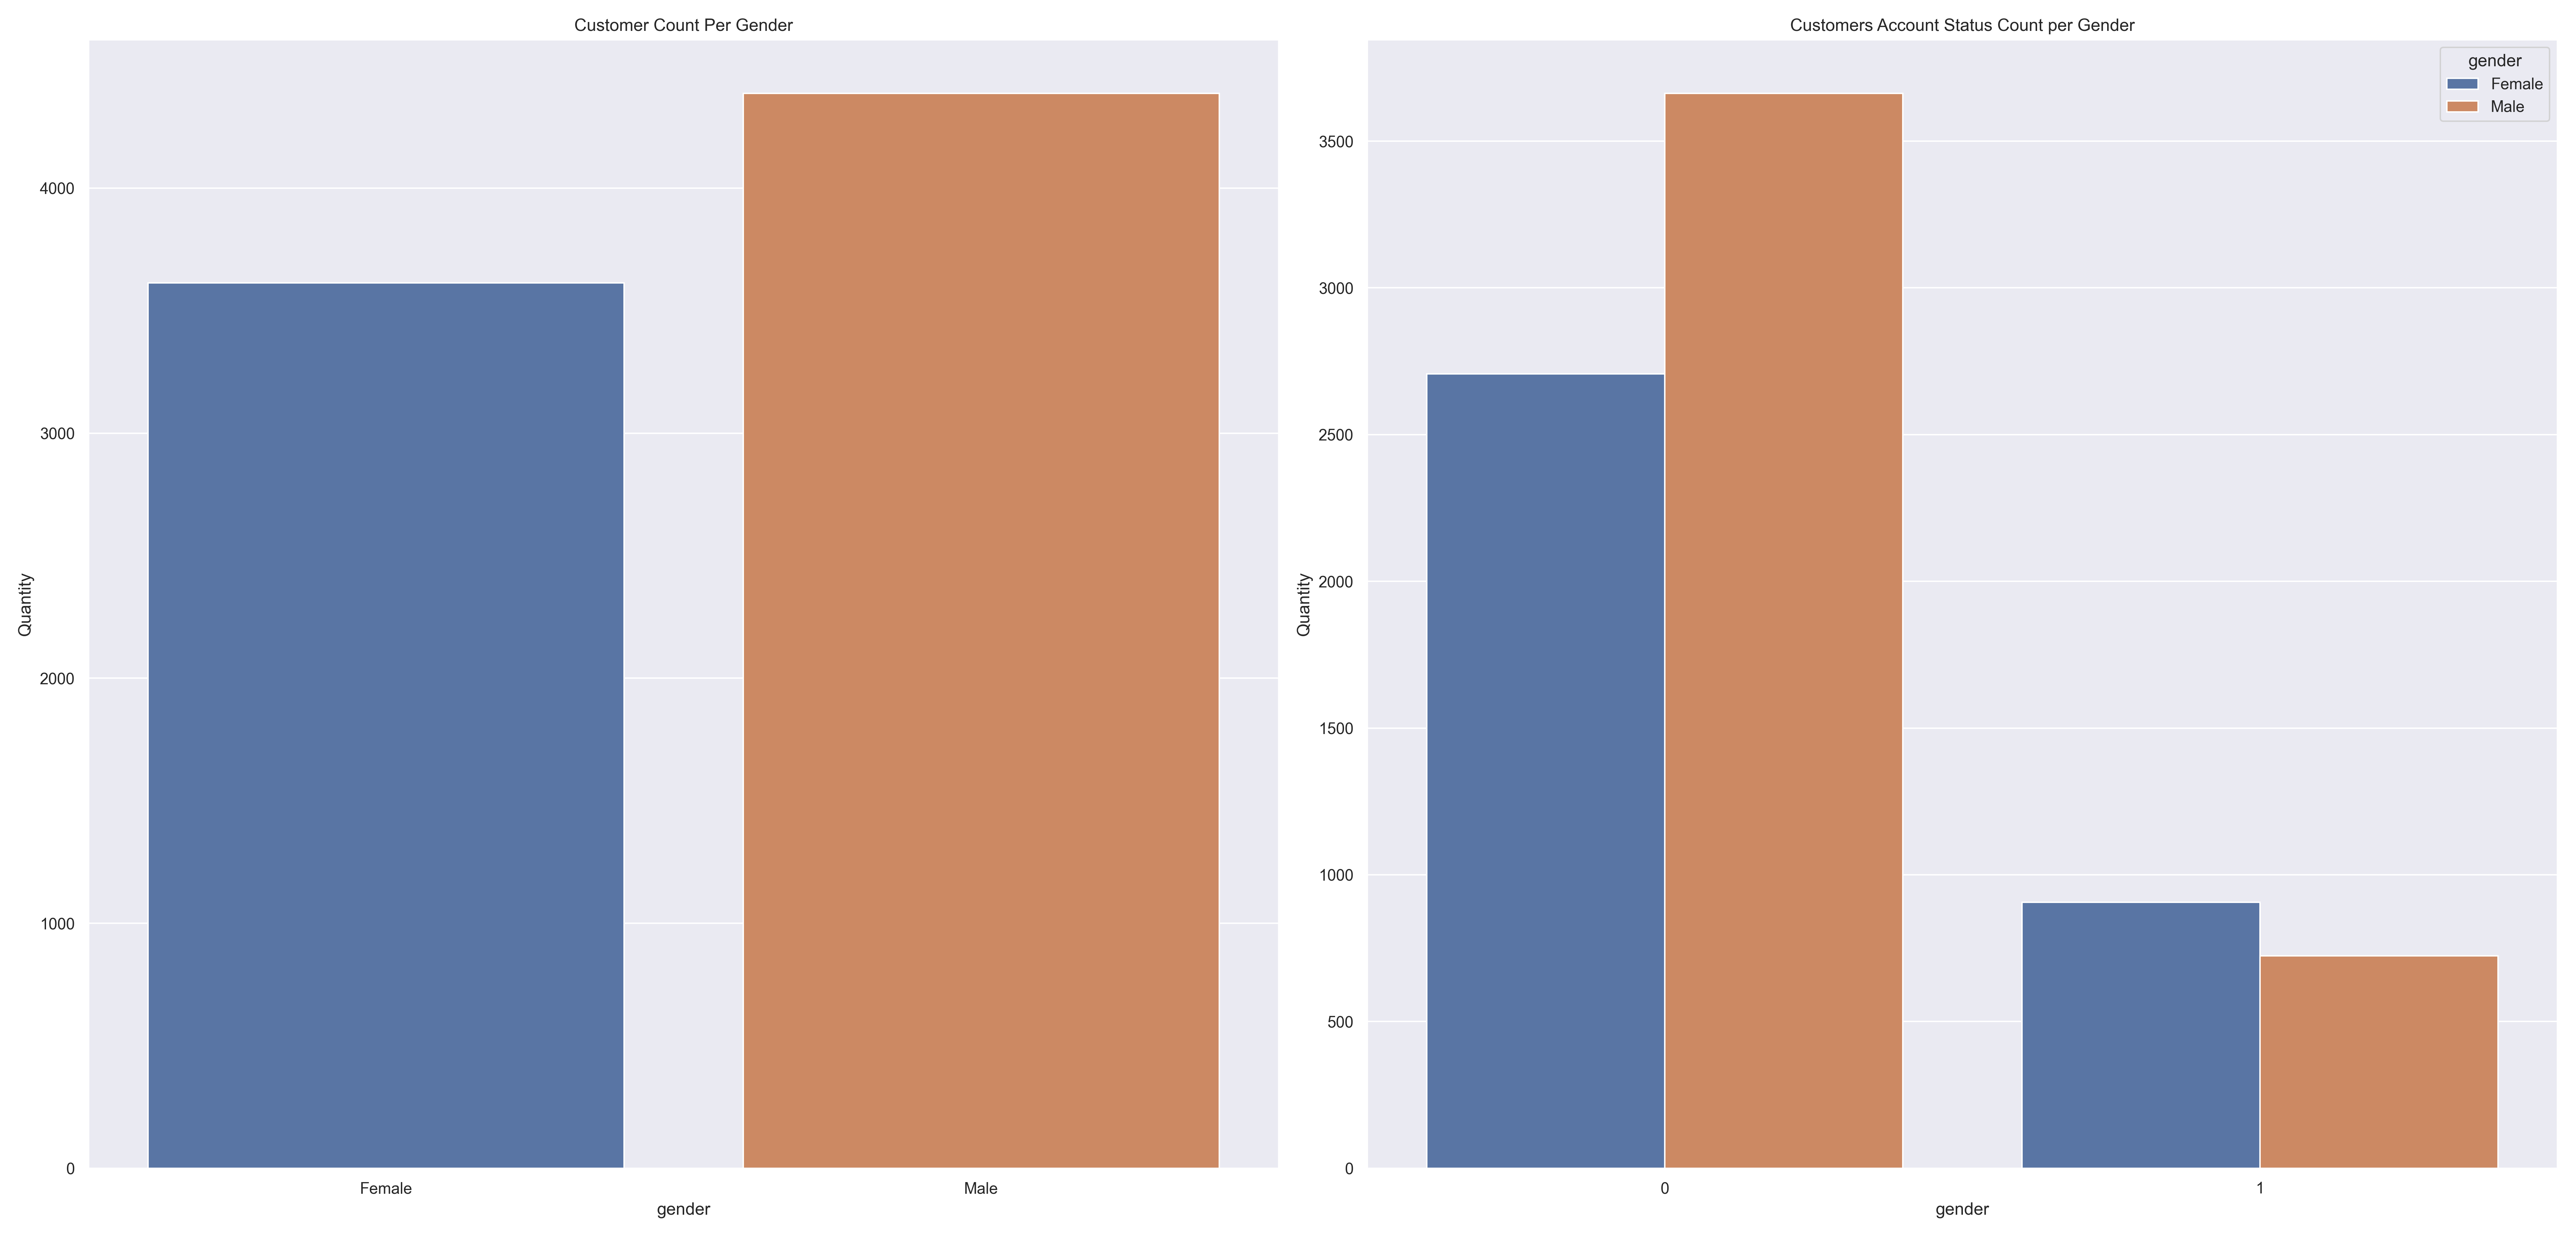
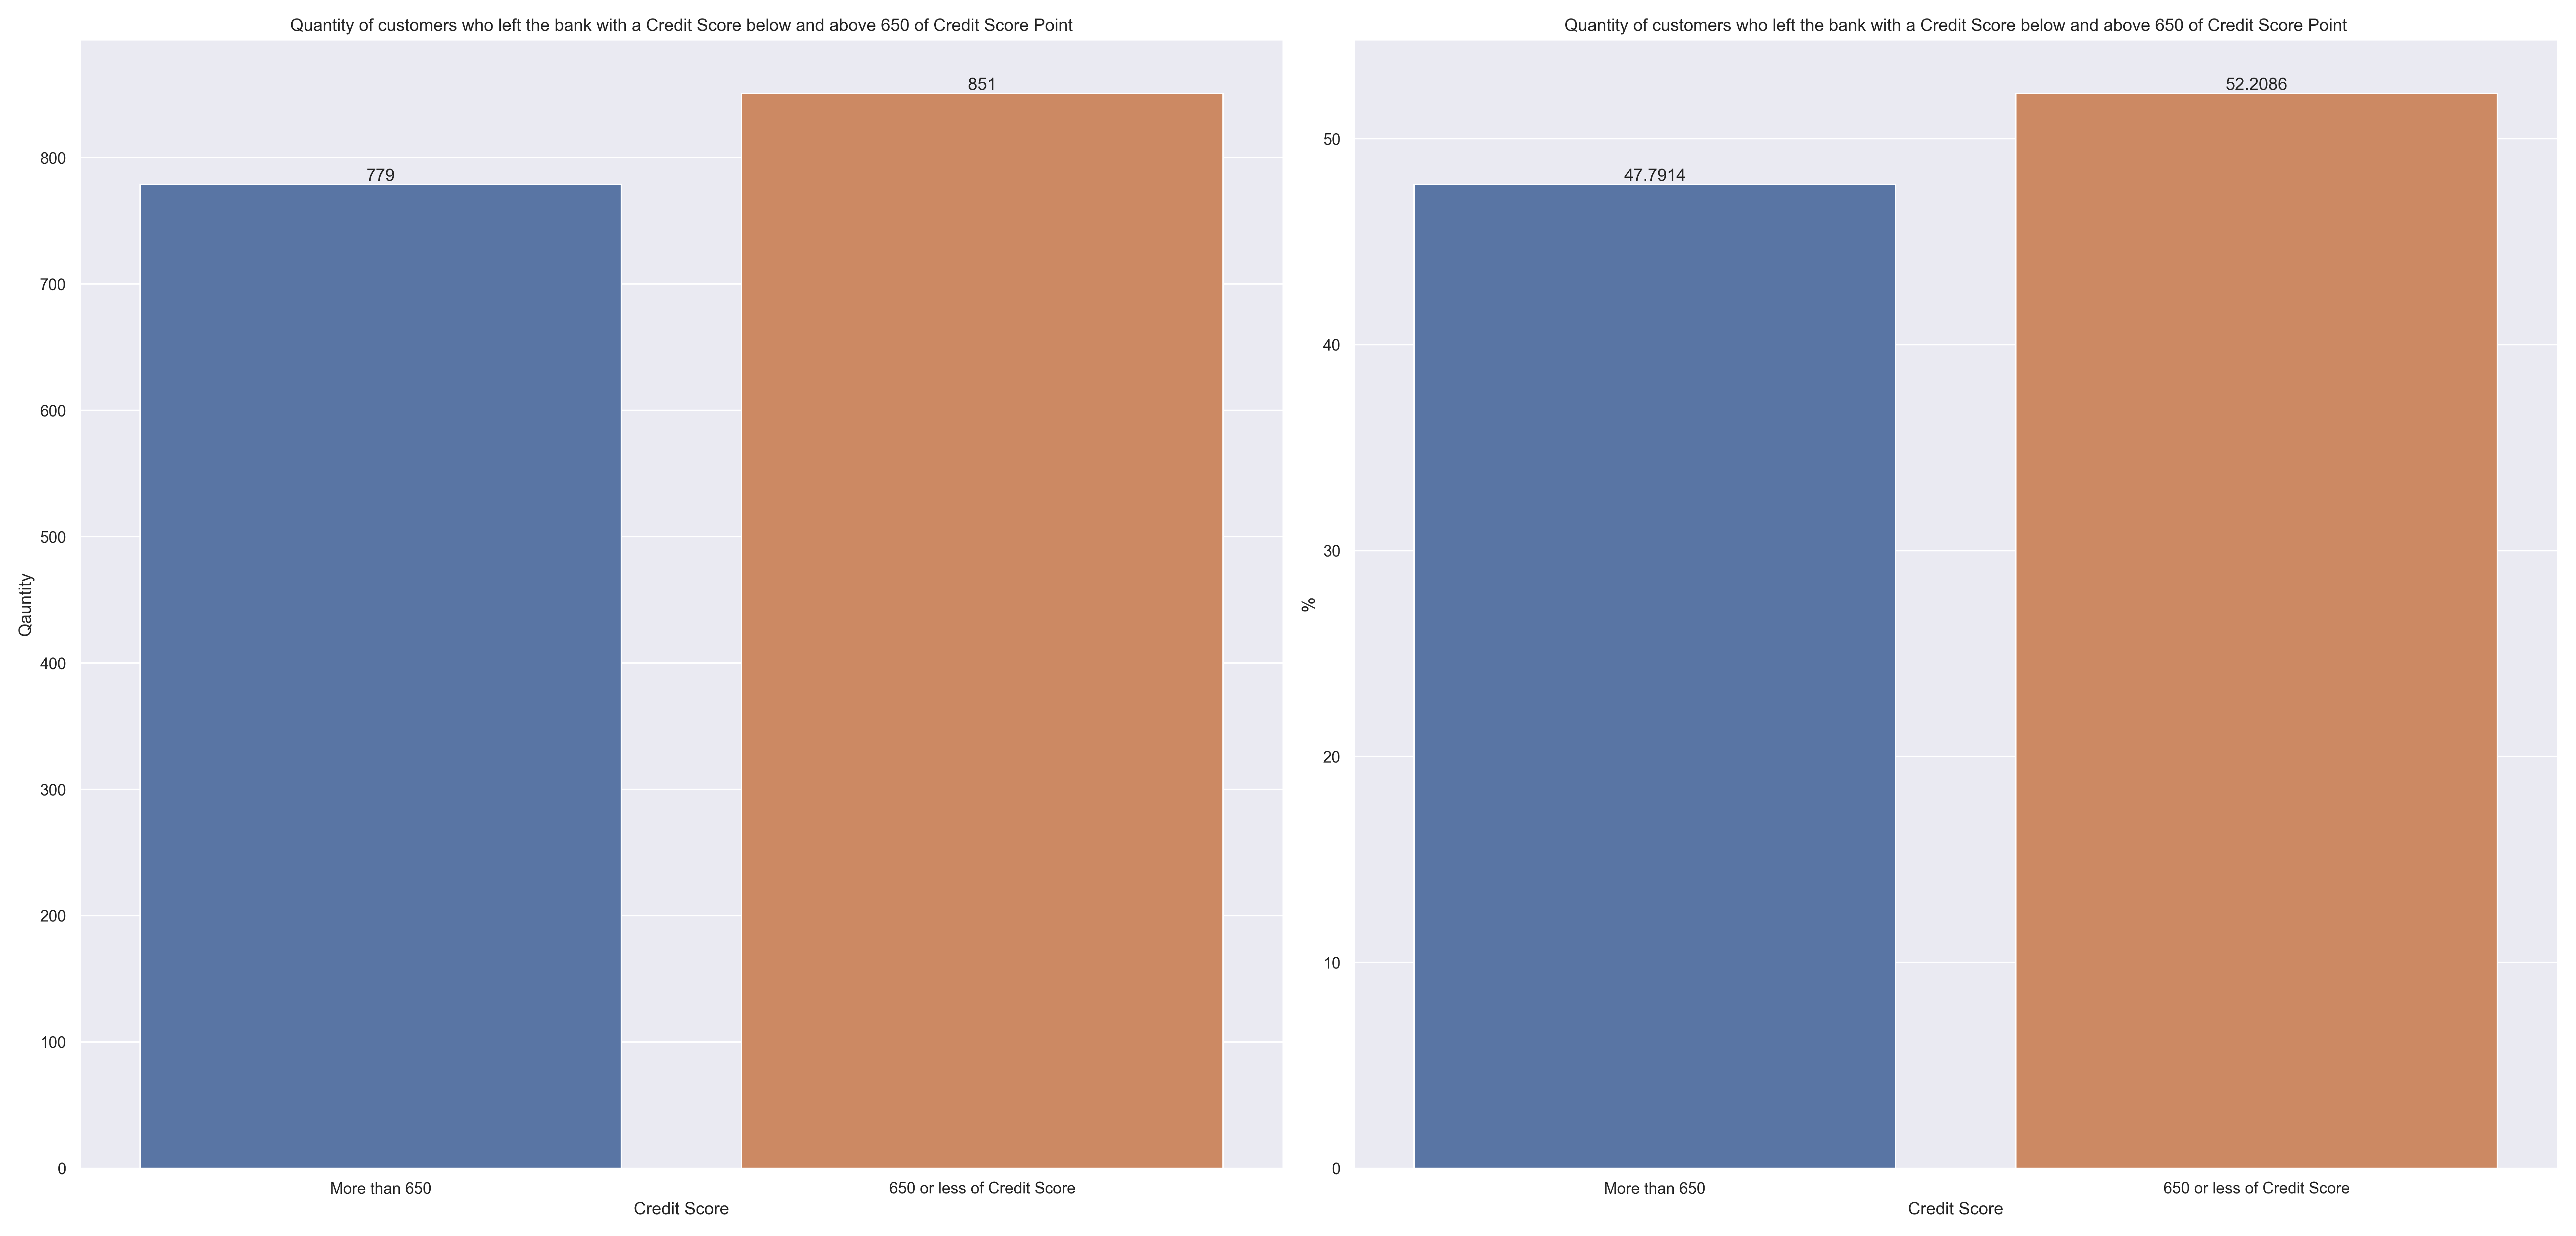
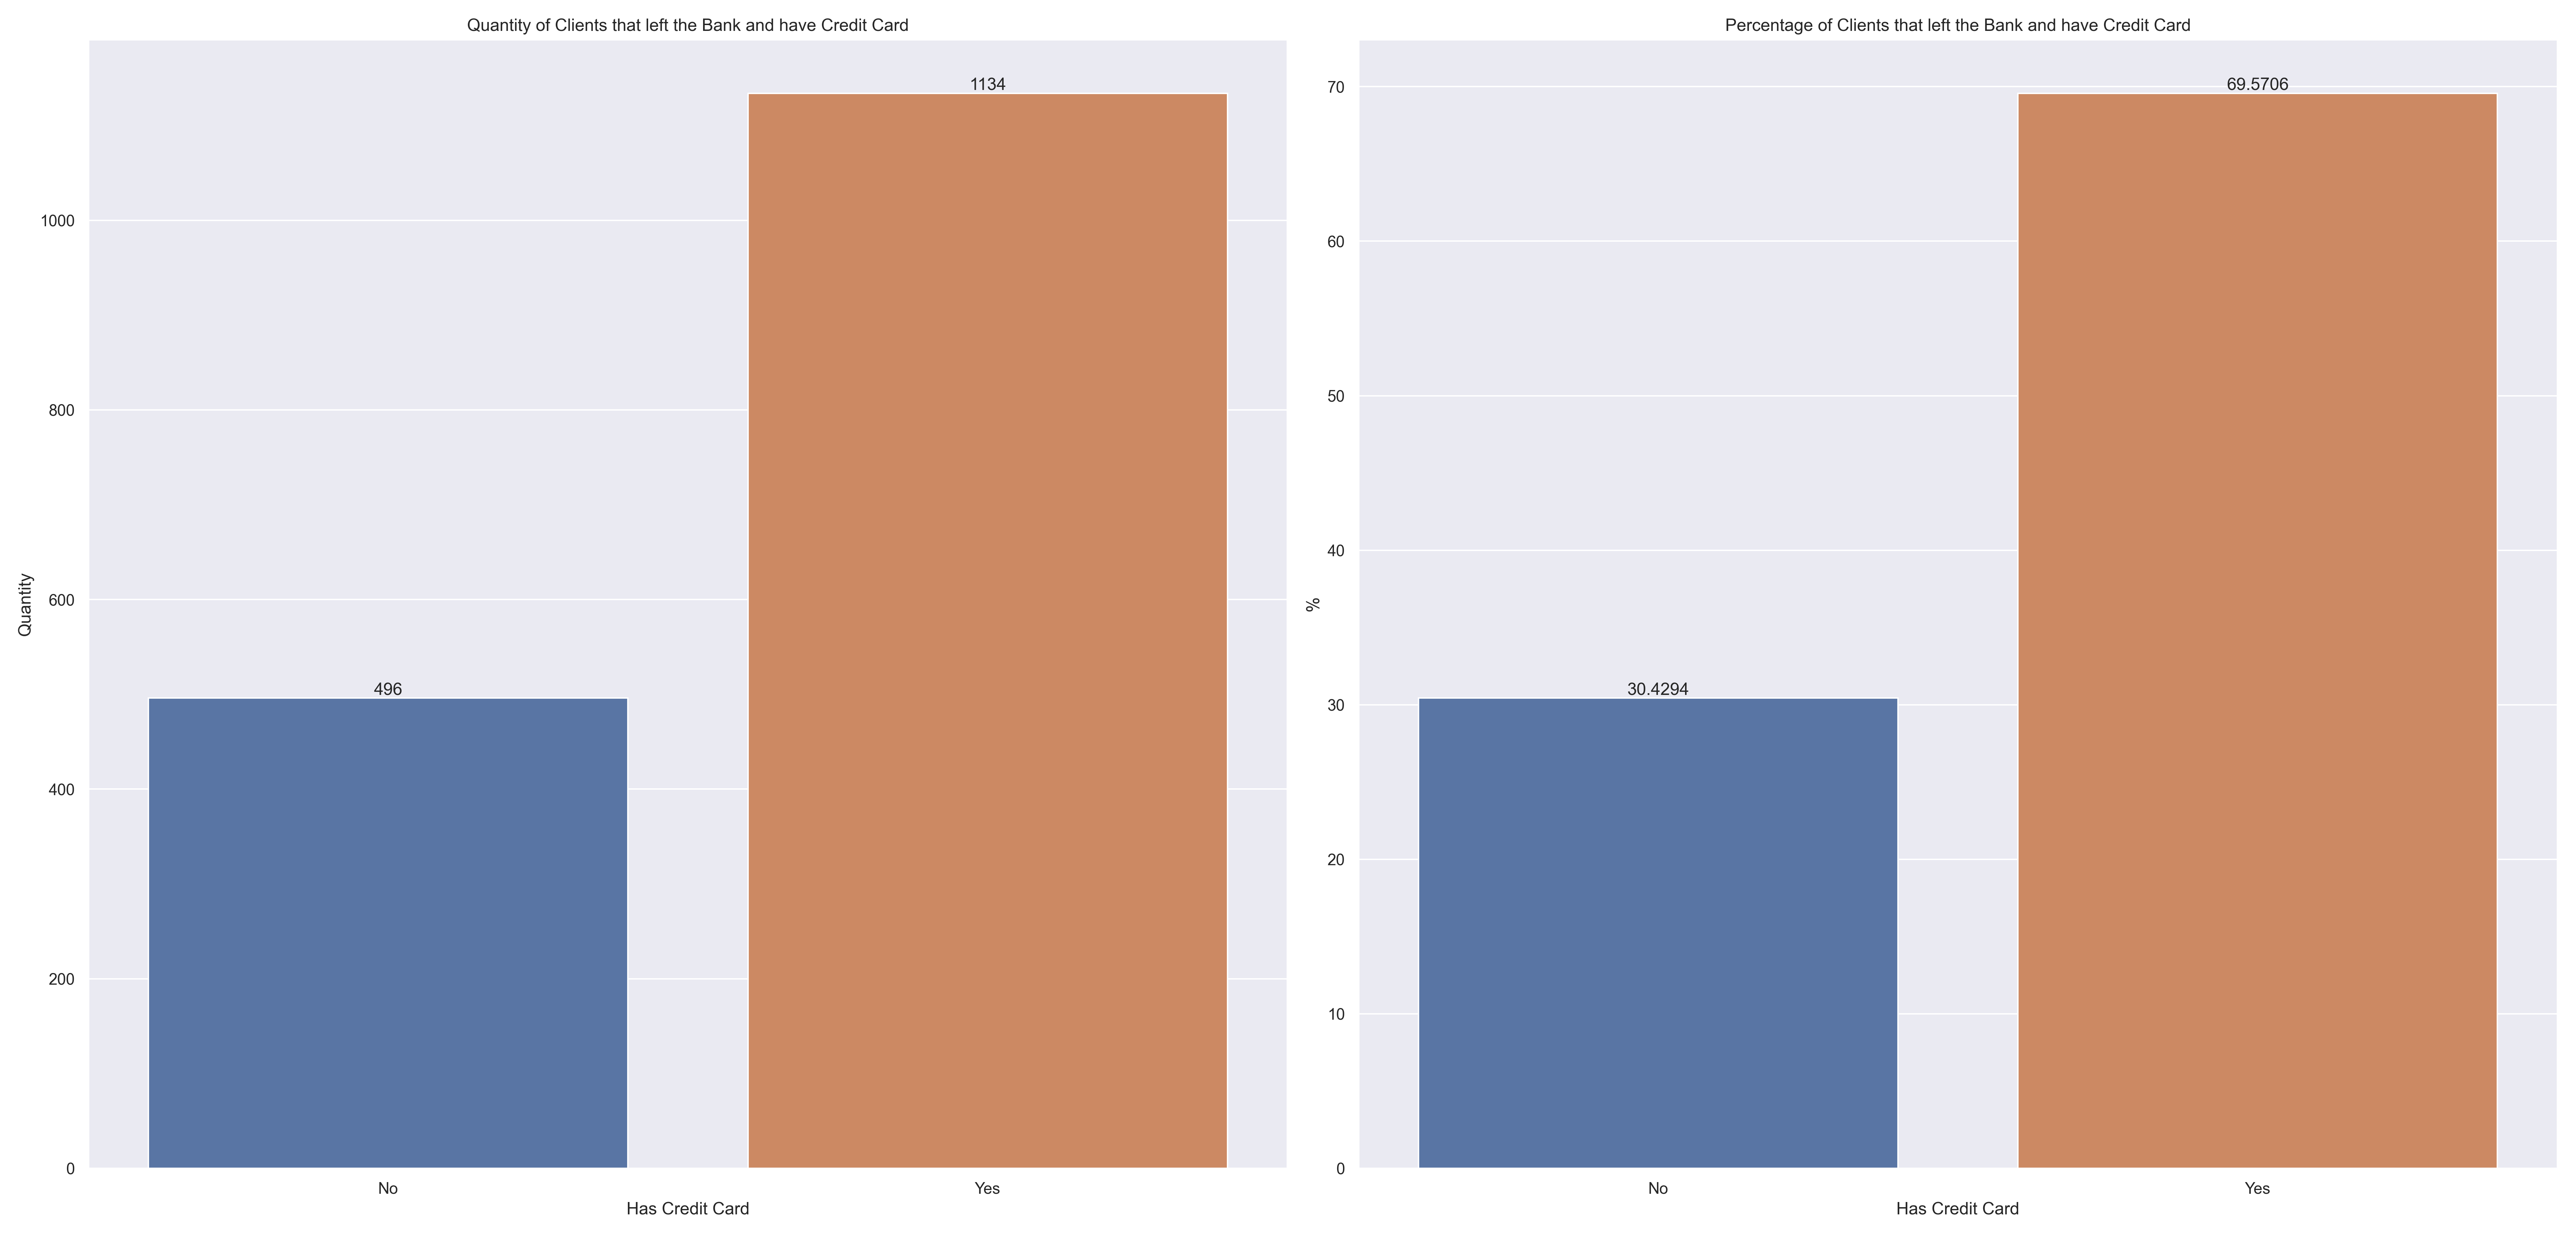
Balance: About 25% of the observations have value equal to zero. Must be investigated to validate the possible outliers.credit_scorefeature has a spike around 850 points, with approximately 300 customers. Must be investigated to determine if these observations aren't outliers.agefeature indicates that the bank customers are concentrated between 30 and 45 yearstenurefeature has around 300 customers with zero years. Theses observations must be investigated to better understand these customershas_cr_cardfeature indicates that the majority of the bank customers have a credit cardis_active_memberfeature indicates the quantity of customers that are active and the customers that are not active are approximately the sameestimated_salary: The graph shows that the distribution is partially uniform. It needs to be investigated.- Most customers are men, but the customers who most left the bank the most are women
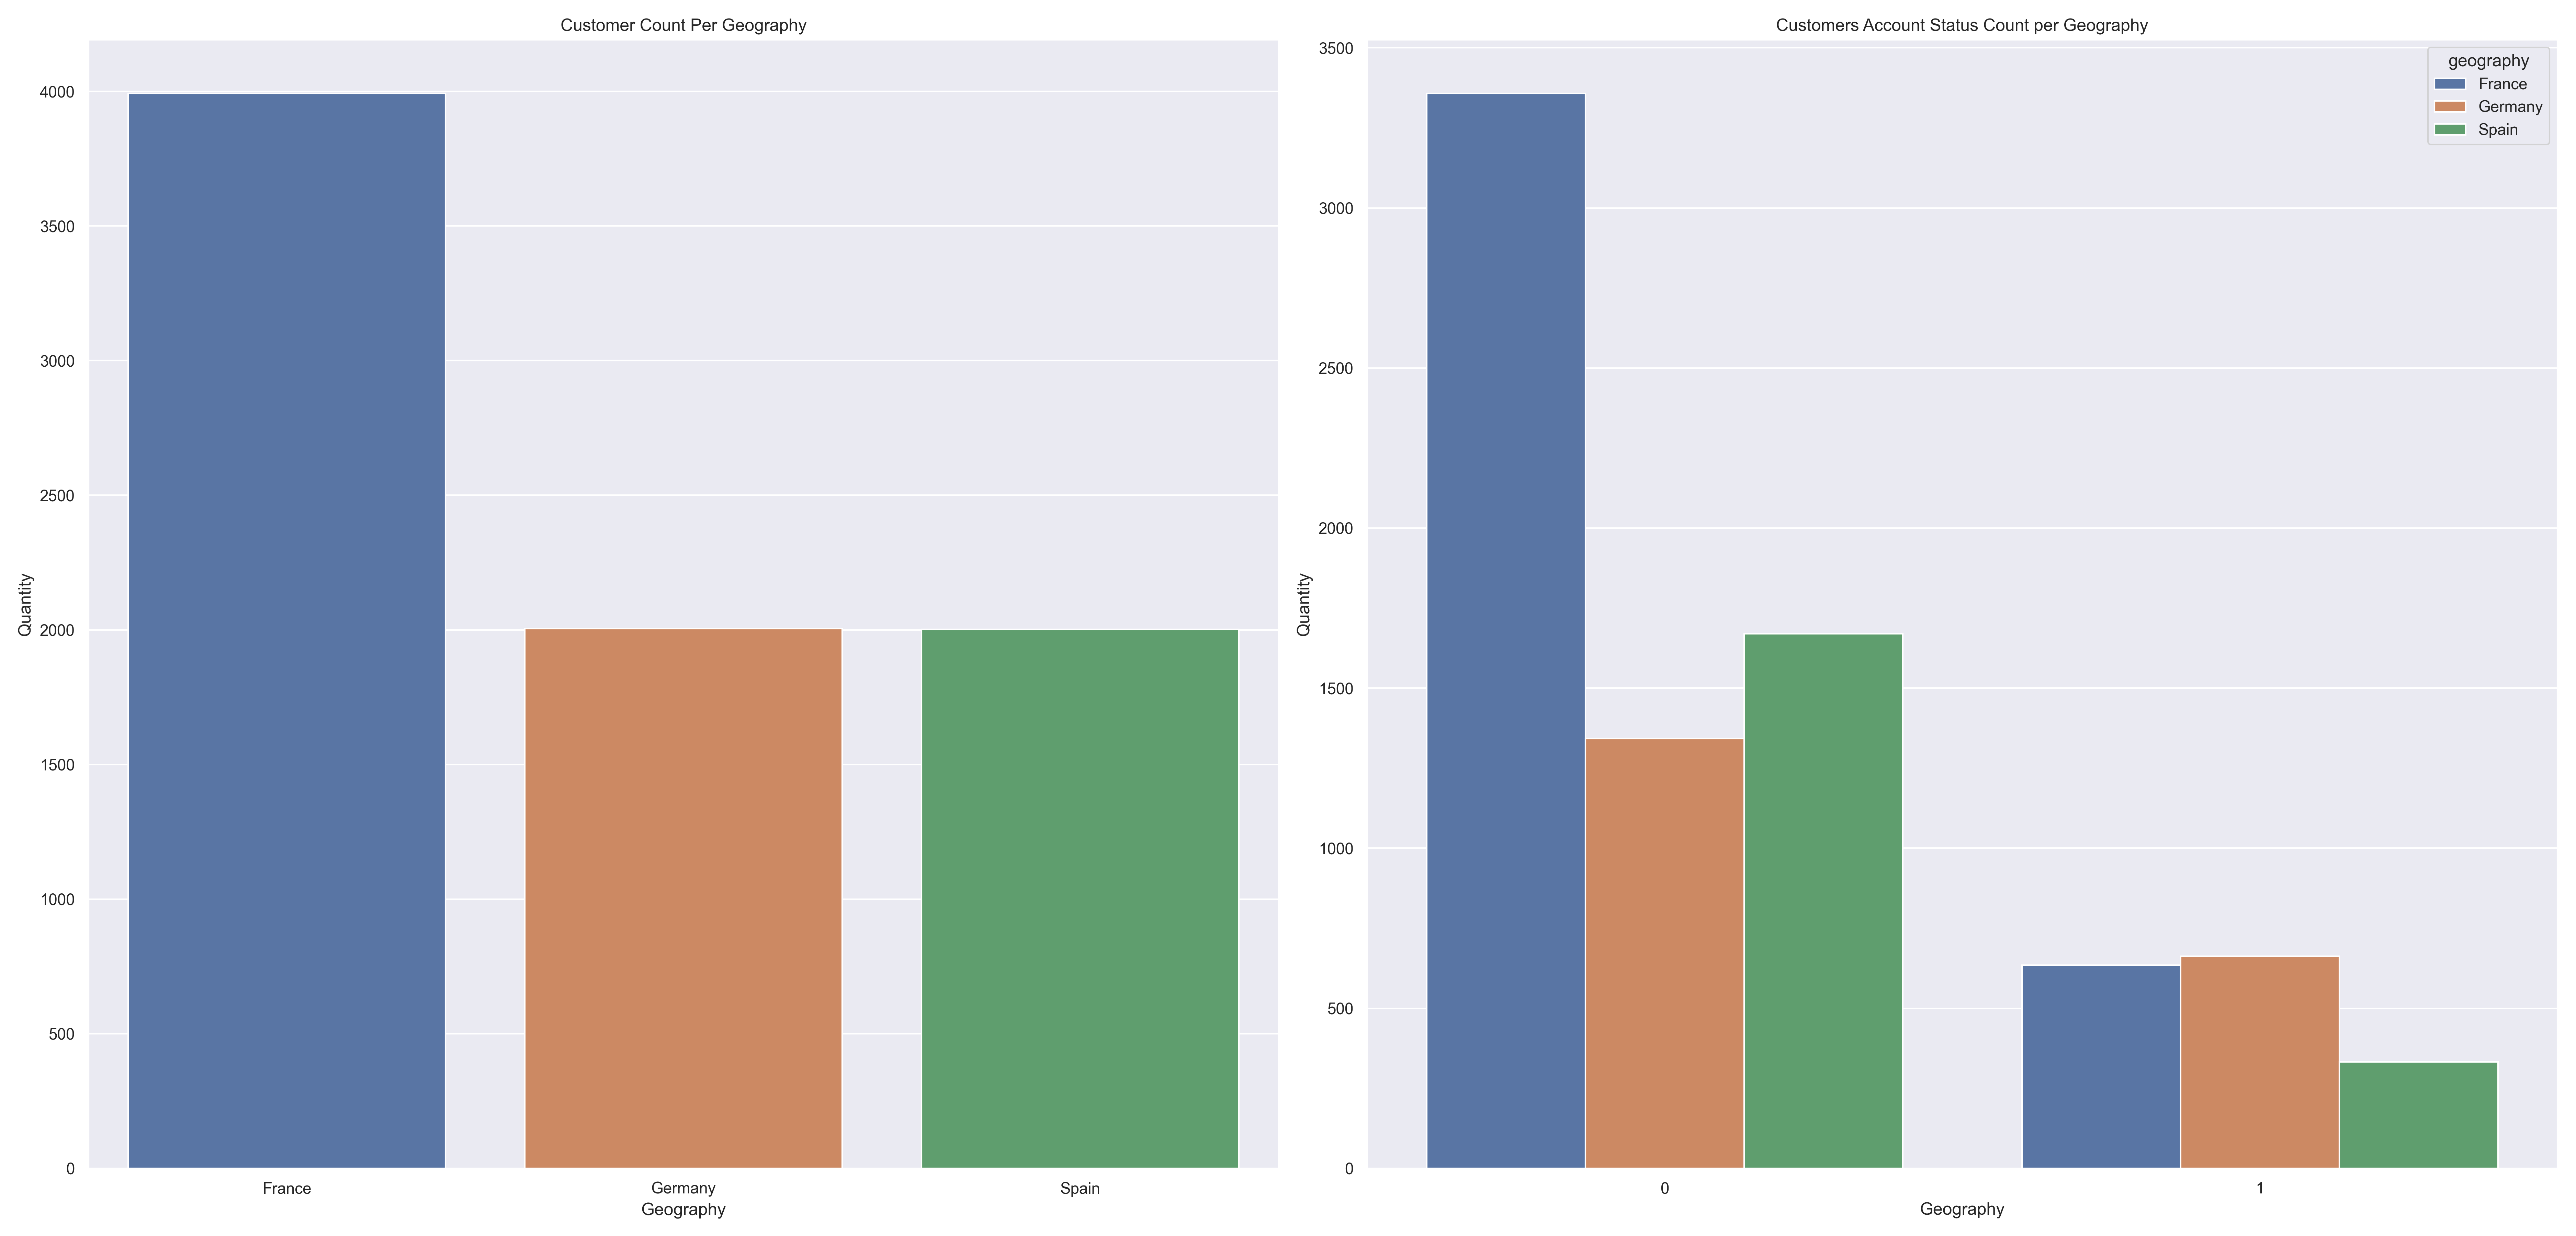
- Most customers are from France, but the customers who left the bank the most are from Germany
credit_score, tenure, estimated_salaray and balance will be investigated deeply in the next iteration.
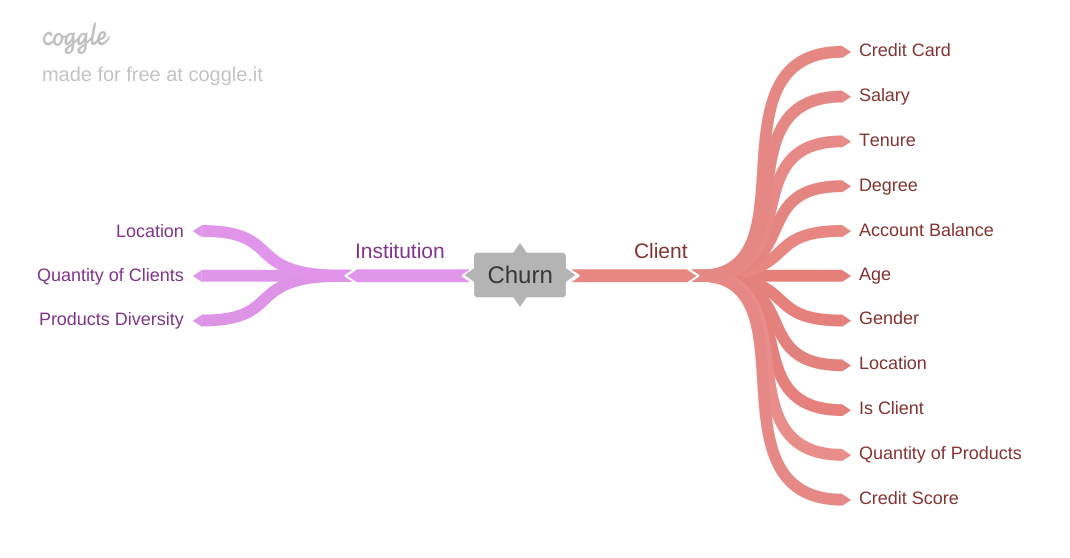
Was created a Mind Map to help not only on the feature creation, but also to help create Business Hypothesis in order to guide EDA process.
Were created 4 features:
credit_score_category: feature created to categorize customers based on their credit scoreestimated_monthly_salary: feature created to calculate the customer's monthly incomeproducts_used_year: feature created to calculate how many products the customer use by year
Were filtered row_number, costumer_id and surname features, because they don't add any information relevance to the machine learning model.
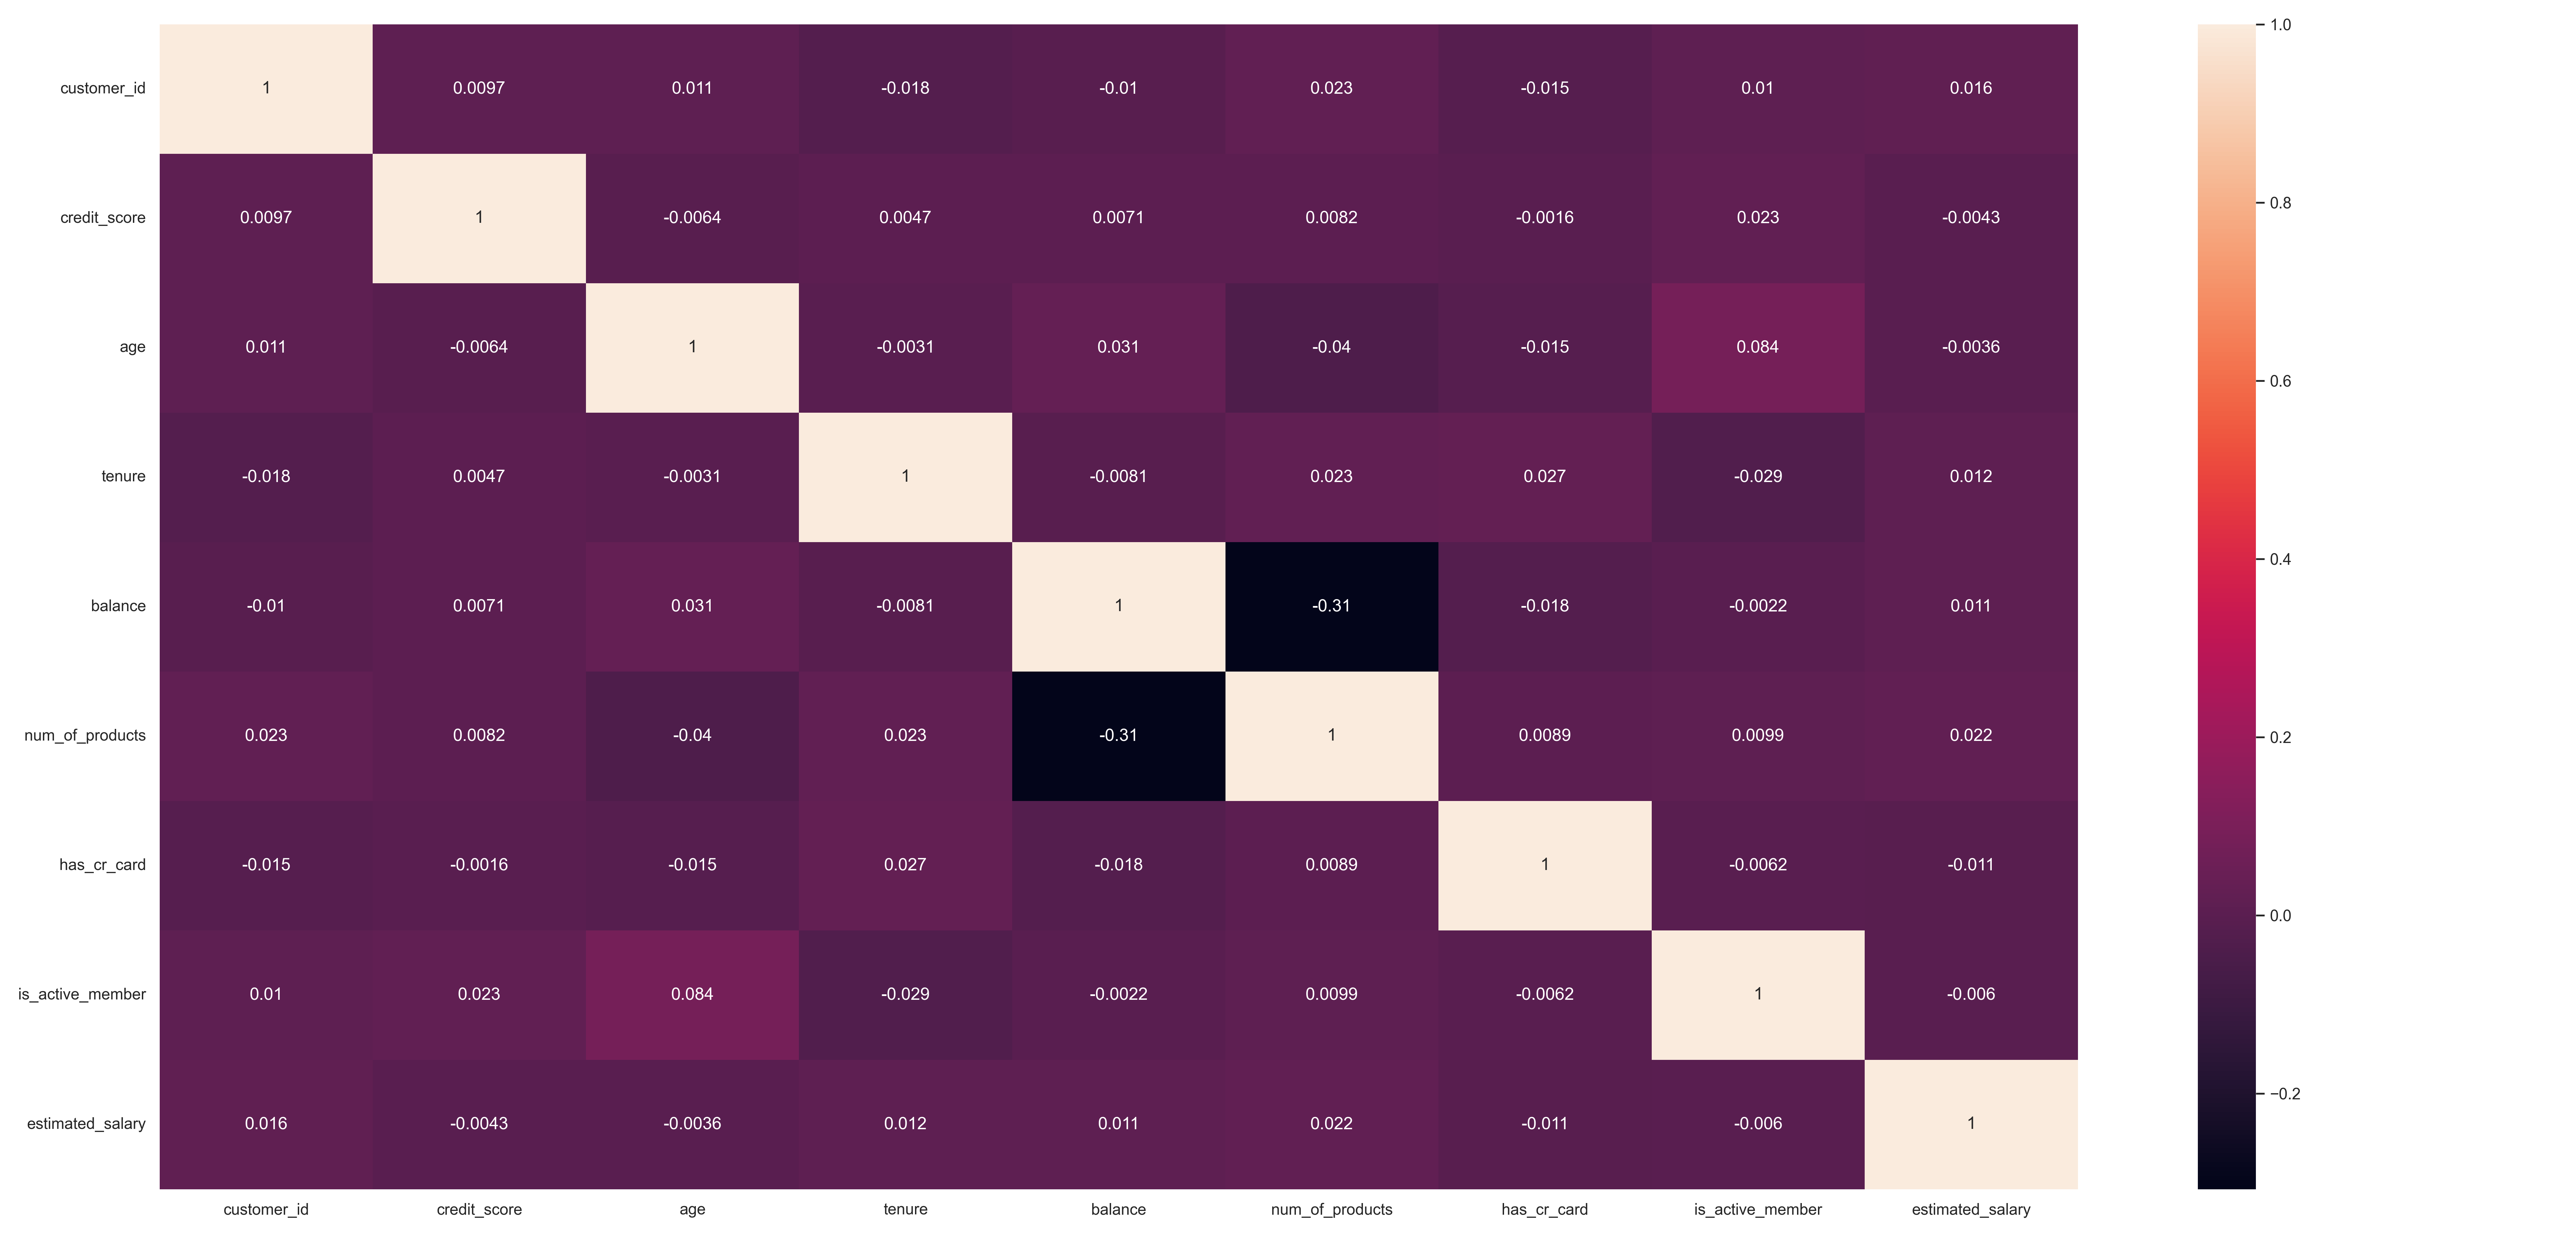
- There are no significant linear correlation between the numerical features
- There are no significant correlation between the categorical feature.
credit_scorehas a lot of significancy
For the numerical features, in this iteration, was used the Standard Scaler to rescale all features. In the next iteration, the credit_score, tenure, estimated_salaray and balance features will be investigated and, if outliers will be found, the Scaler could be changed.
For the categorical features, were used One Hot Encoding, to encode the geography and gender features because of their low cardinality.
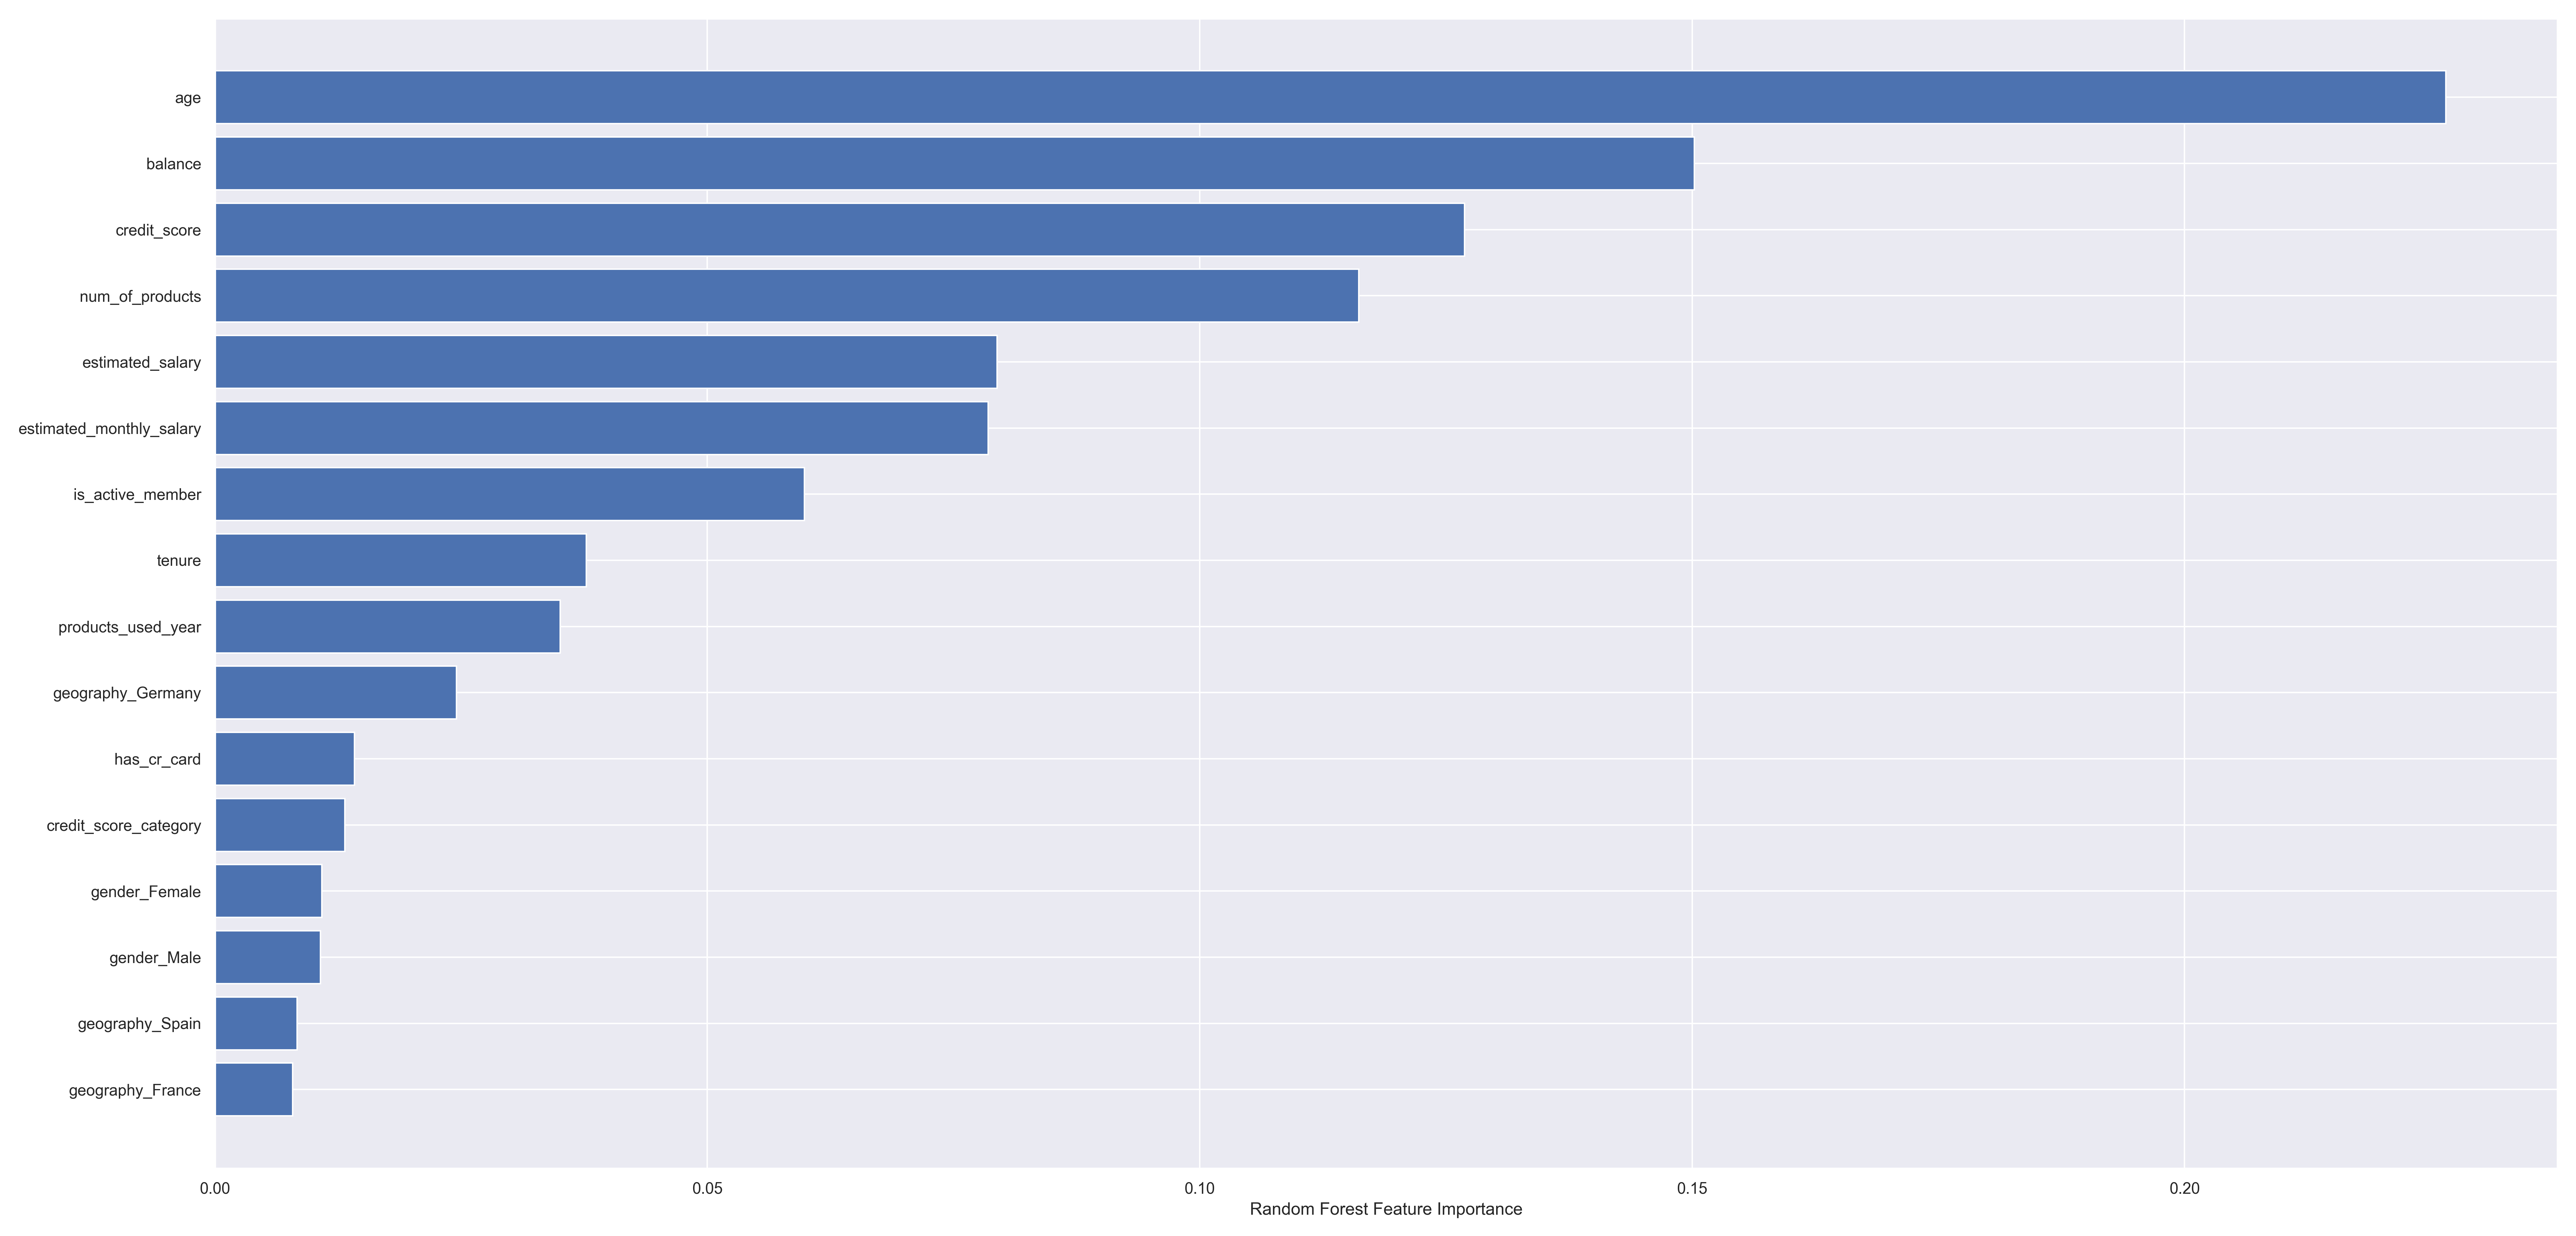
row_number, costumer_id and surname were already manualy filtered because of their low significance. In this iteration were used all features available. Besides, it was used Random Forest algorithm to help visualize feature importance. In the next iterations, it could be used another technique to select only the significant features, like RFE, PCA or Sequential Feature Selector.
In order to find the best machine learning model and its hyperparameters, the Grid Search CV object was used with 4 Machine Learning Models:
- Logistic Regression
- Support Vector Classification (SVC)
- Random Forest
- XGBoost
Besides, it was created a Pipeline to process all Machine Learning Project stages, like transformations and encodings, in order to find the best model and hyperparameters. Also, the chosen metric was roc_auc_score.
The best machine learning model found was XGBoost with 0.86 roc_auc_score.
It was created a Pipeline to make all preprocessing and training with the selected Machine Learning Model.
The trained model had a roc_auc_score of 0.884 with the training data and had a roc_auc_score of 0.861with the test data.
To create the final model, it was created a new Pipeline that used all transformations and preprocessig pipelines to train a new model with all available data to train the chosen model, in order to help the model perform better with unseen data.
This new model was saved in the models directory with the pickle format.
In order to facilitate the project usage, it was created a Python script that will load the model saved on pickle, read the test csv file, execute the machine learning model with the new unseen test data and create a response csv file, with the unseen data classified.
In order to use this project, you need to execute these steps:
- Create a Python virtual environment with Python's version 3.10
- Install all packages and libraries inside
requirements.txtusing thepip install -r requirements.txtcommand - Replace the CSV file that is inside
data/test/directory with the file that have the data you want to classify. The CSV file MUST have exactly theabandono_teste.csvname. - The CSV file with the classified clients will be placed inside the
data/answer/directory, under the nameabandonos_{date}.csv, where{date}will be the date of the execution.
In the next iterations, credit_score, tenure, estimated_salaray and balance features will be deeply investigated to better understand the data and verify the existence of outliers that could be filtered.
Another thing that can be done is the creation of new features to enrich the data.
Besides, we can use feature selection techniques to choose the most relevant features, in order to increase the model score.
We can also answer the other business hypothesis to better understand the data and the features realations and create new hypothesis the verify other features relations.
