This notebook illustrates the implementation of pulsar folding and searching techniques from search. It finds the period of pulses within fairly noisy data. (Below is a showcase of how "random" pulsar data can appear without proper algorithms)
Check out the Notebook Tutorial

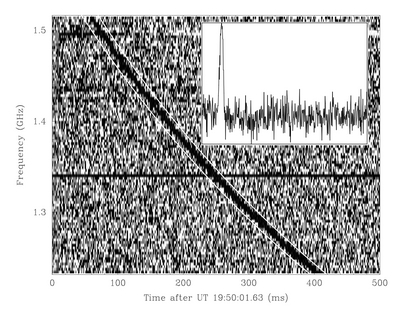
When pulsar pulses reach Earth they actually reach the observer at different times because the radiation travels through an interstellar medium causing dispersion of the pulses. These appear as a swooping curve instead of straight horizontal lines [plane waves]. If we are going to fold the pulses to increase SNR then we're making the assumption that the pulses arrive at the same time. Thus we need to correct the dispersion by shifting each channel down a certain time delay relative to its frequency channel. Computationally we index a column of the spectrogram in frequency and split it between a time delay and original data and swap the positions.
However, the problem is, we don't know the dispersion measure DM of the signal. The DM is the path integral of the signal through the interstellar medium. What we do is we brute force the DM by executing multiple trials DMs and we take the highest SNR created by the dedispersion with the given trial DM.
We first apply the discrete Fourier transform onto the data and look for the largest magnitude of the Fourier transform. This indicates potential periods within the data. Then we need to check for its consistency and we do so by folding the data by the period the Fourier transform indicates.
The folding algorithm is simple. You take each period and you fold the signals on top of itself. If the period you guessed matches the true period of the pulse then by the law of superposition it will increase the signal to noise ratio! This spike in signal to noise ratio can be seen in the following graph.

Depending on the different periods we look at, the pulsar can have multiple profiles. For example with the same observation - instead, we look at a period of 0.19 seconds we get a different profile. The collection of profile forms the "fingerprint" of the pulsar.

Currently looking into building a pulsar timing model. But that will be completed on a later date.