Python library for generating and injecting artificial narrow-band signals into time-frequency data, as well as tools for working with filterbank data.
Injecting an artificial signal is as simple as adding it to the data. To fully describe an artificial signal, we need the following:
- Start and stop times (in most cases, this would probably be the beginning and end of the observation, assuming the signal is "on" continuously)
- Frequency center of signal as a function of time sample
- Intensity modulation of signal as a function of time sample
- Frequency structure within each time sample
- Overall intensity modulation as a function of frequency (bandpass)
setigen provides sample functions and shapes for each of these parameters. These all contribute to the final structure of the signal - the goal is to empower the user to generate artificial signals that are as simple or complex as one would like.
Here's an example of synthetic signal generation, using astropy.units to express frame parameters:
from astropy import units as u
import setigen as stg
import matplotlib.pyplot as plt

frame = stg.Frame(fchans=1024*u.pixel,
                  tchans=32*u.pixel,
                  df=2.7939677238464355*u.Hz,
                  dt=18.25361108*u.s,
                  fch1=6095.214842353016*u.MHz)
noise = frame.add_noise(x_mean=5, x_std=2, x_min=0)
signal = frame.add_signal(stg.constant_path(f_start=frame.get_frequency(index=200),
                                            drift_rate=2*u.Hz/u.s),
                          stg.constant_t_profile(level=frame.get_intensity(snr=30)),
                          stg.gaussian_f_profile(width=40*u.Hz),
                          stg.constant_bp_profile(level=1))

fig = plt.figure(figsize=(10, 6))
frame.render()
plt.savefig('example.png', bbox_inches='tight')
plt.show()
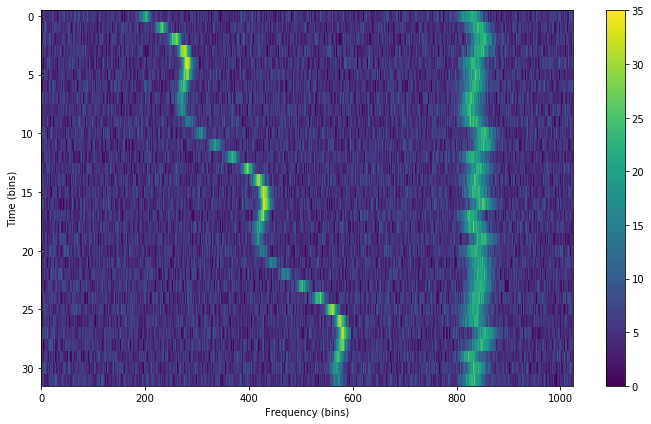
This first adds Gaussian noise to the frame, and adds a constant intensity signal at 30 SNR (relative to the background noise). The result is:

