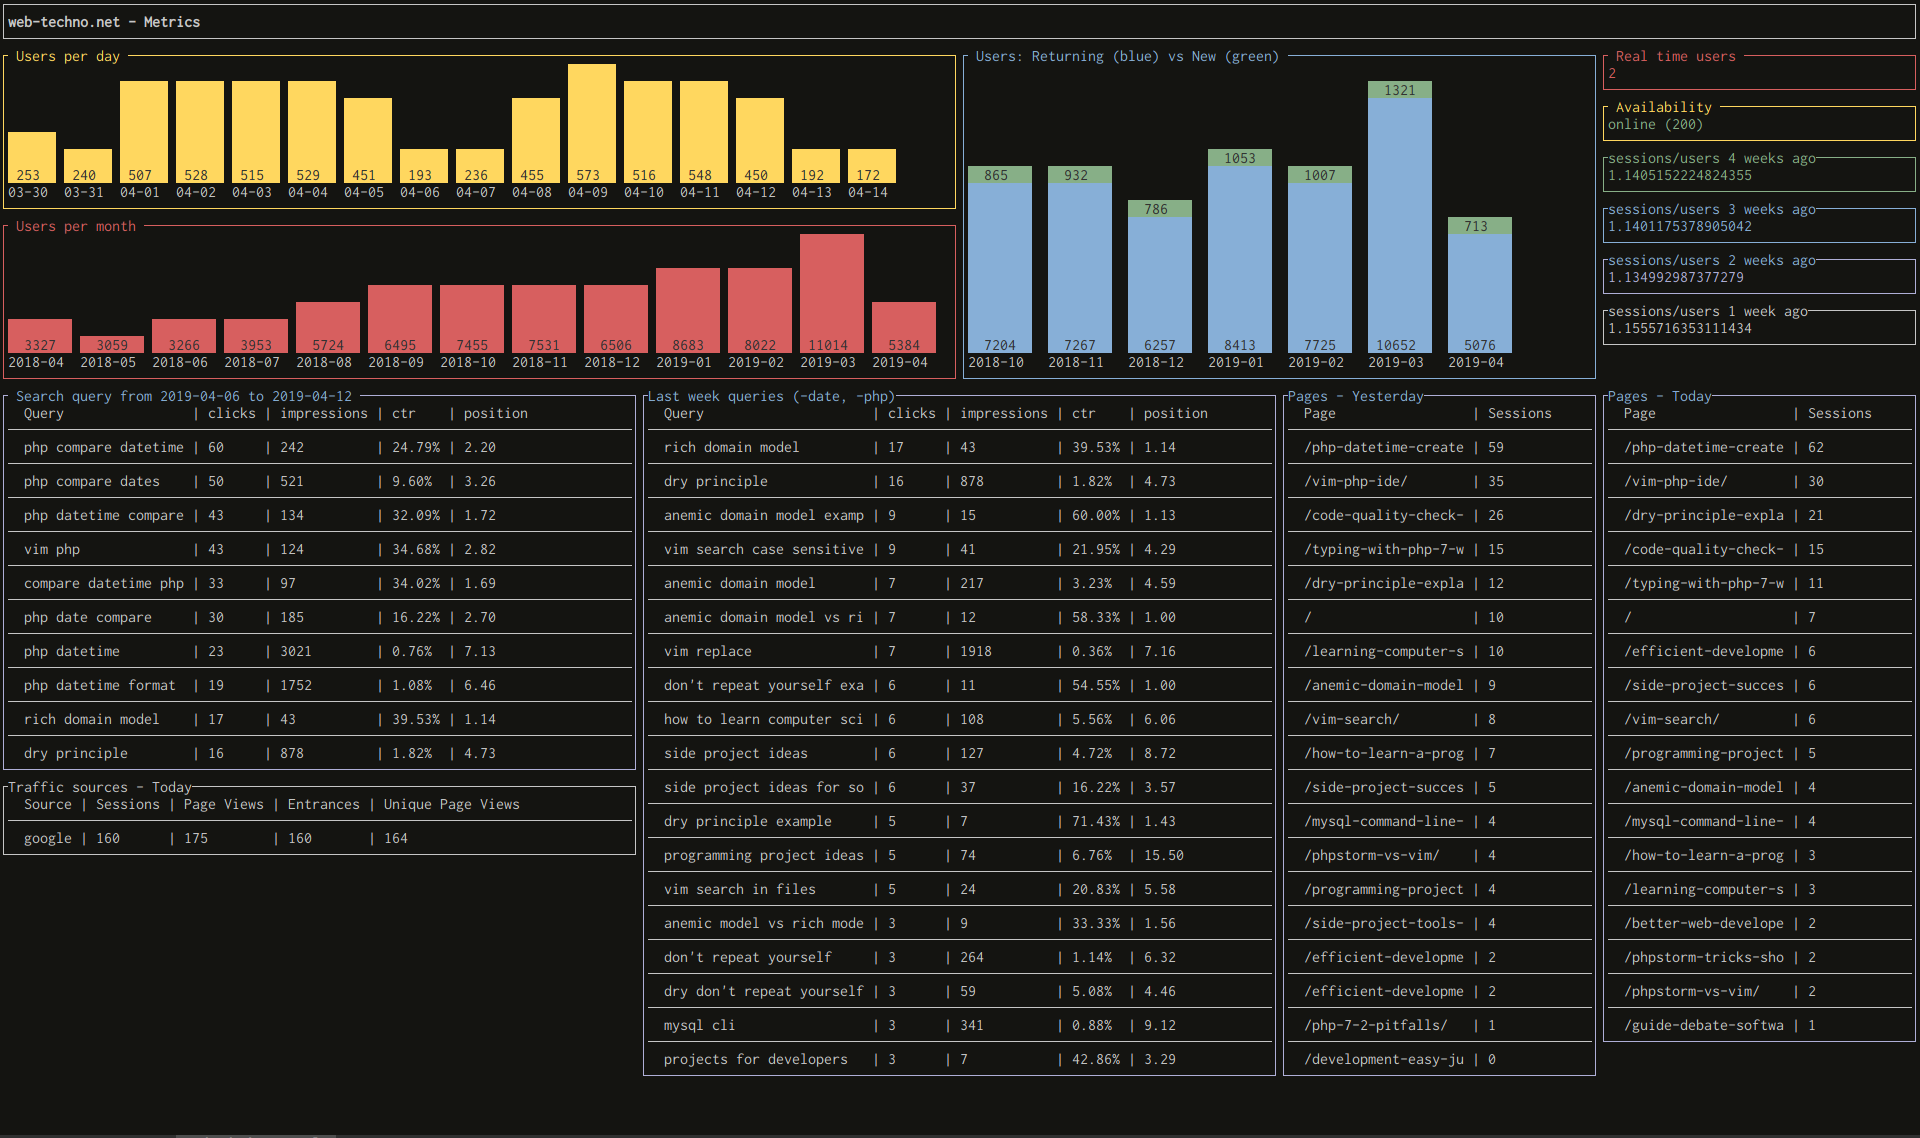
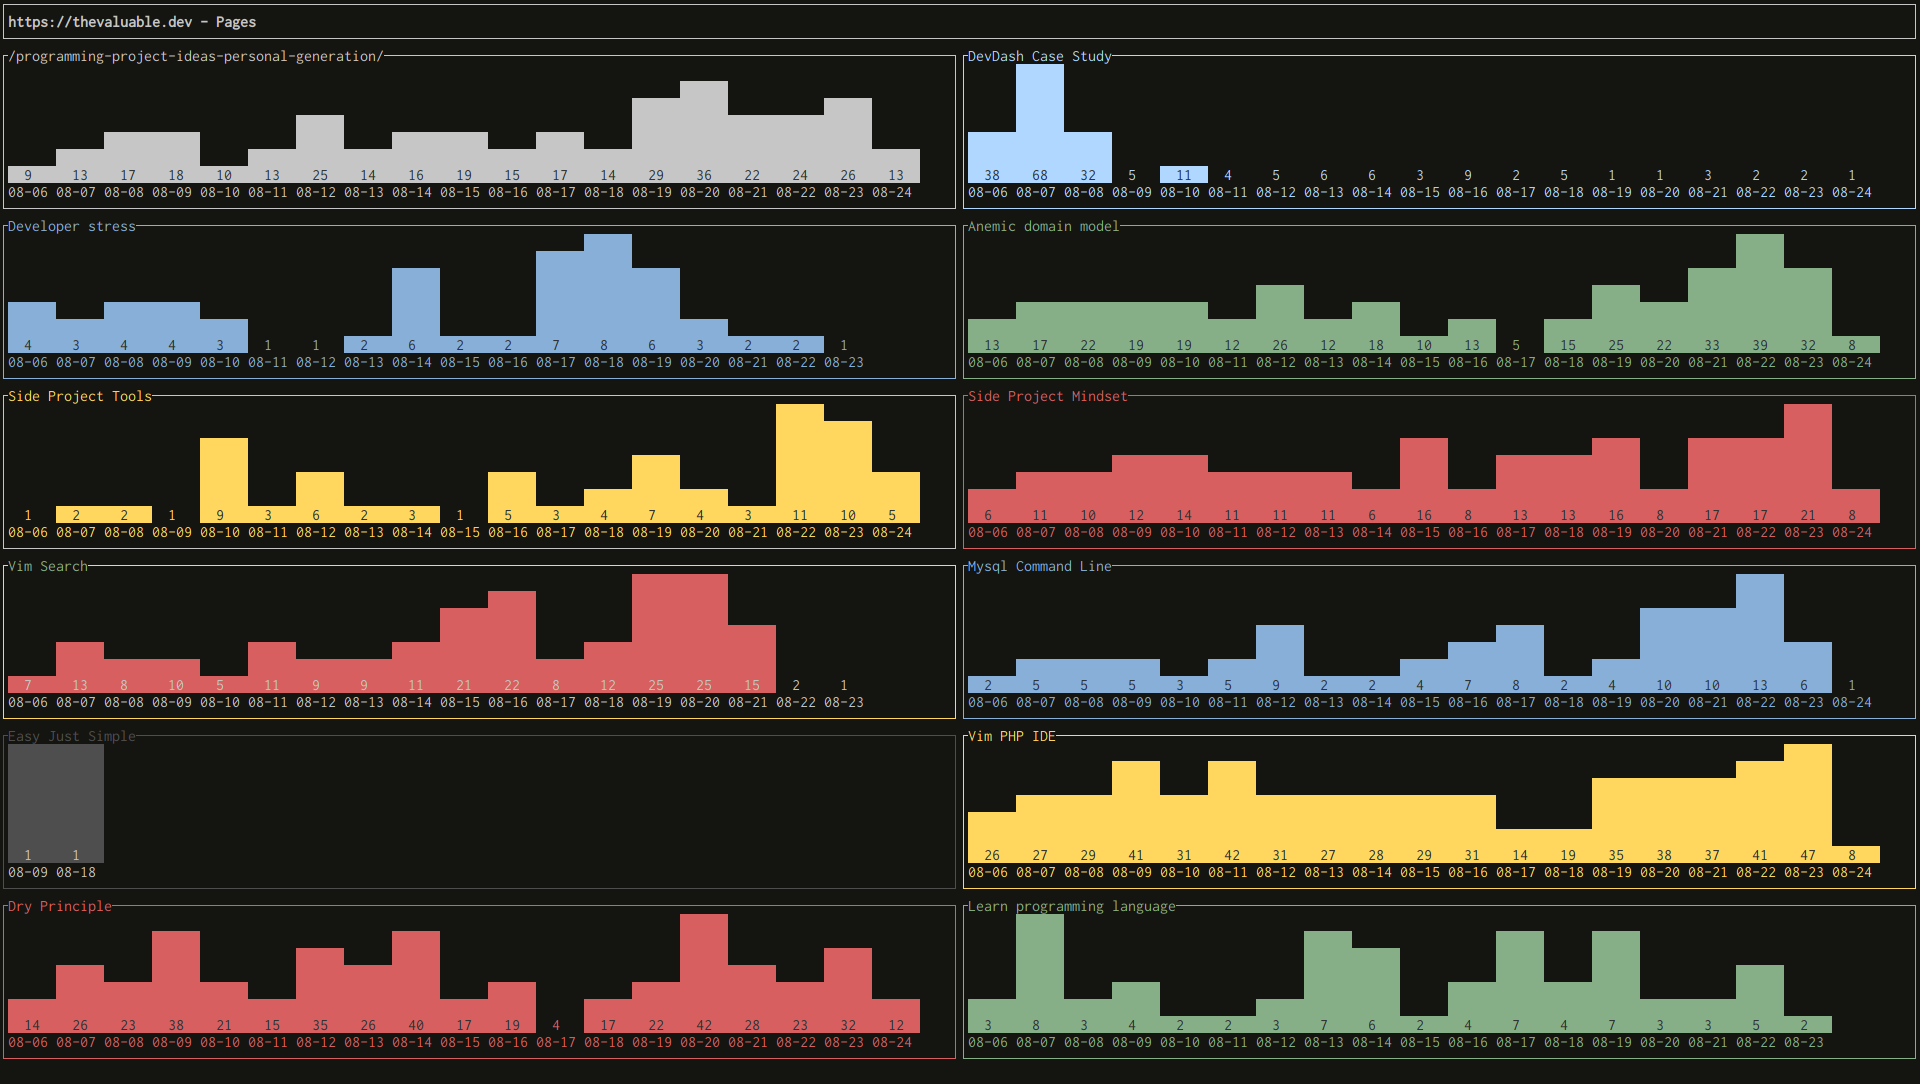
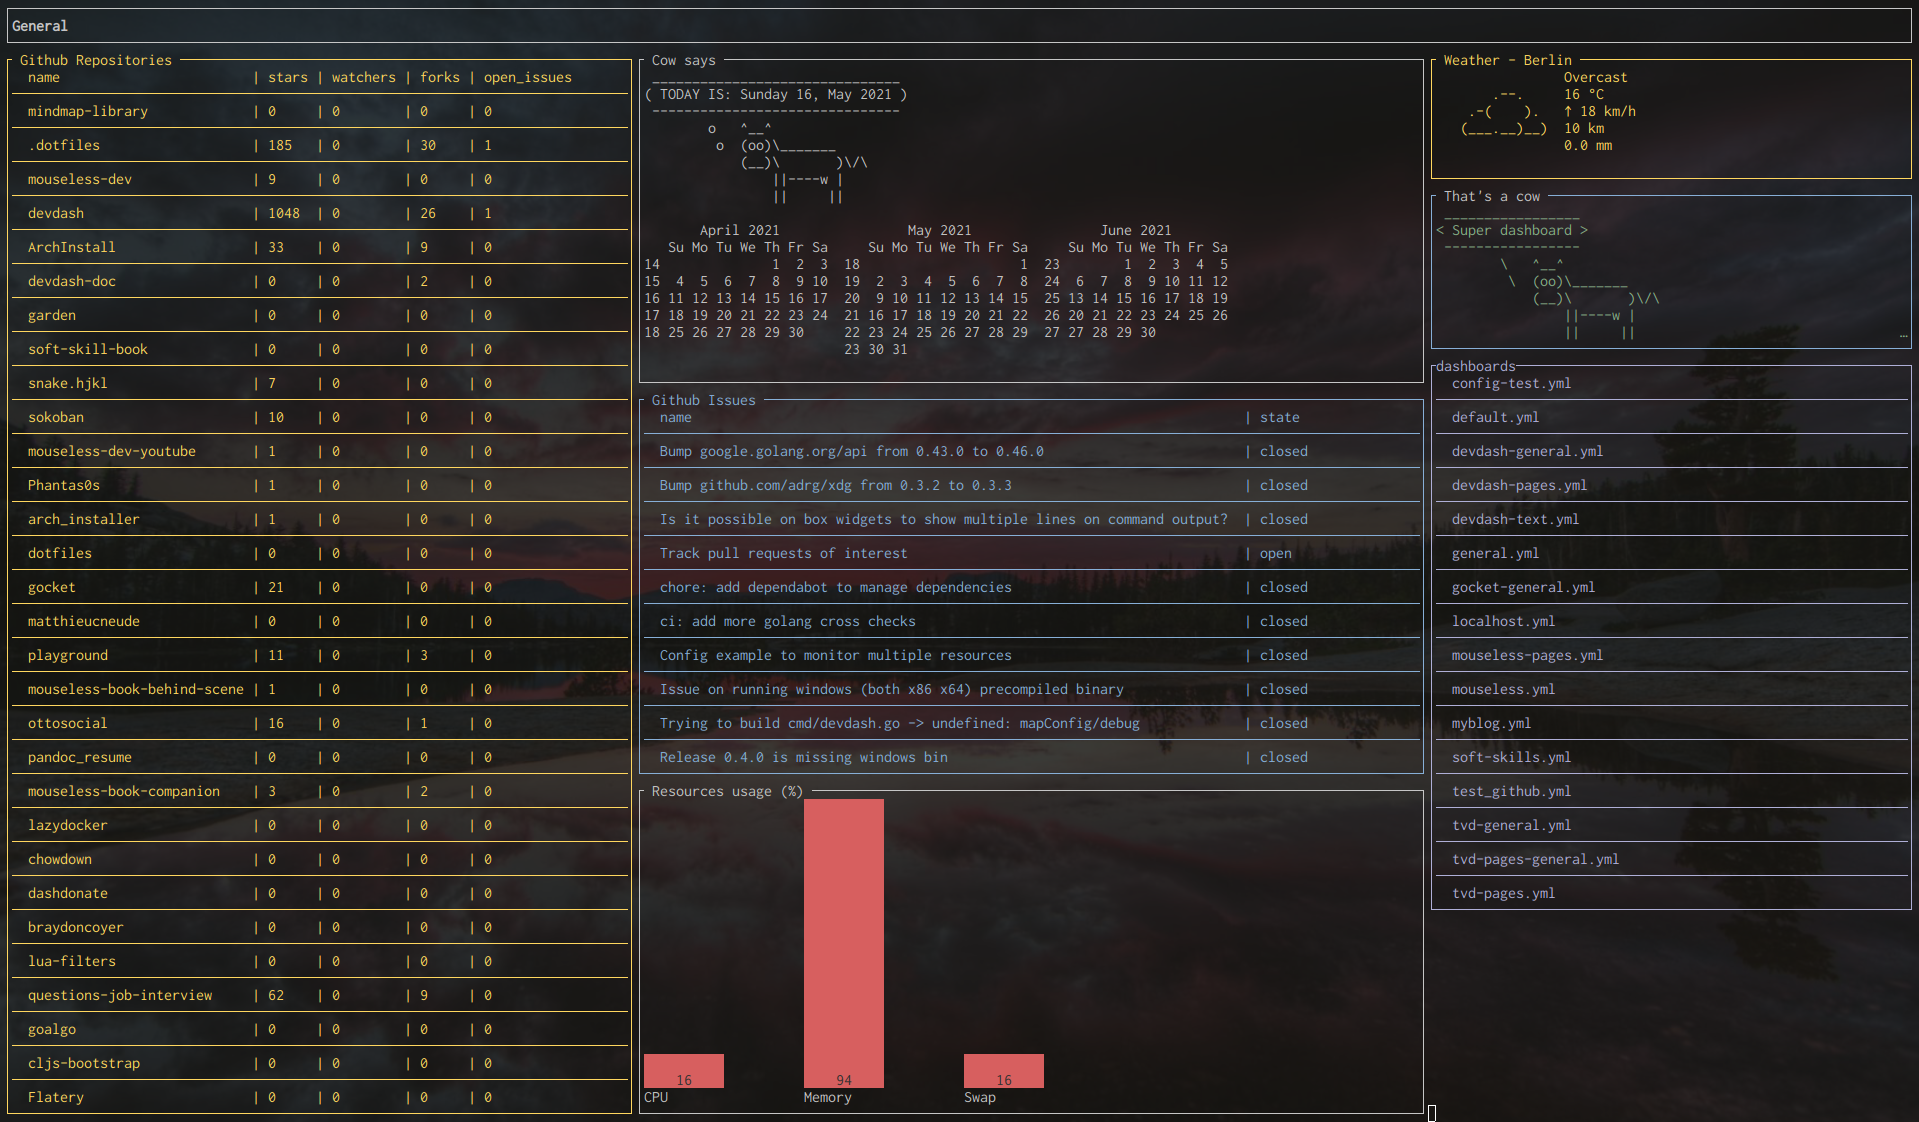
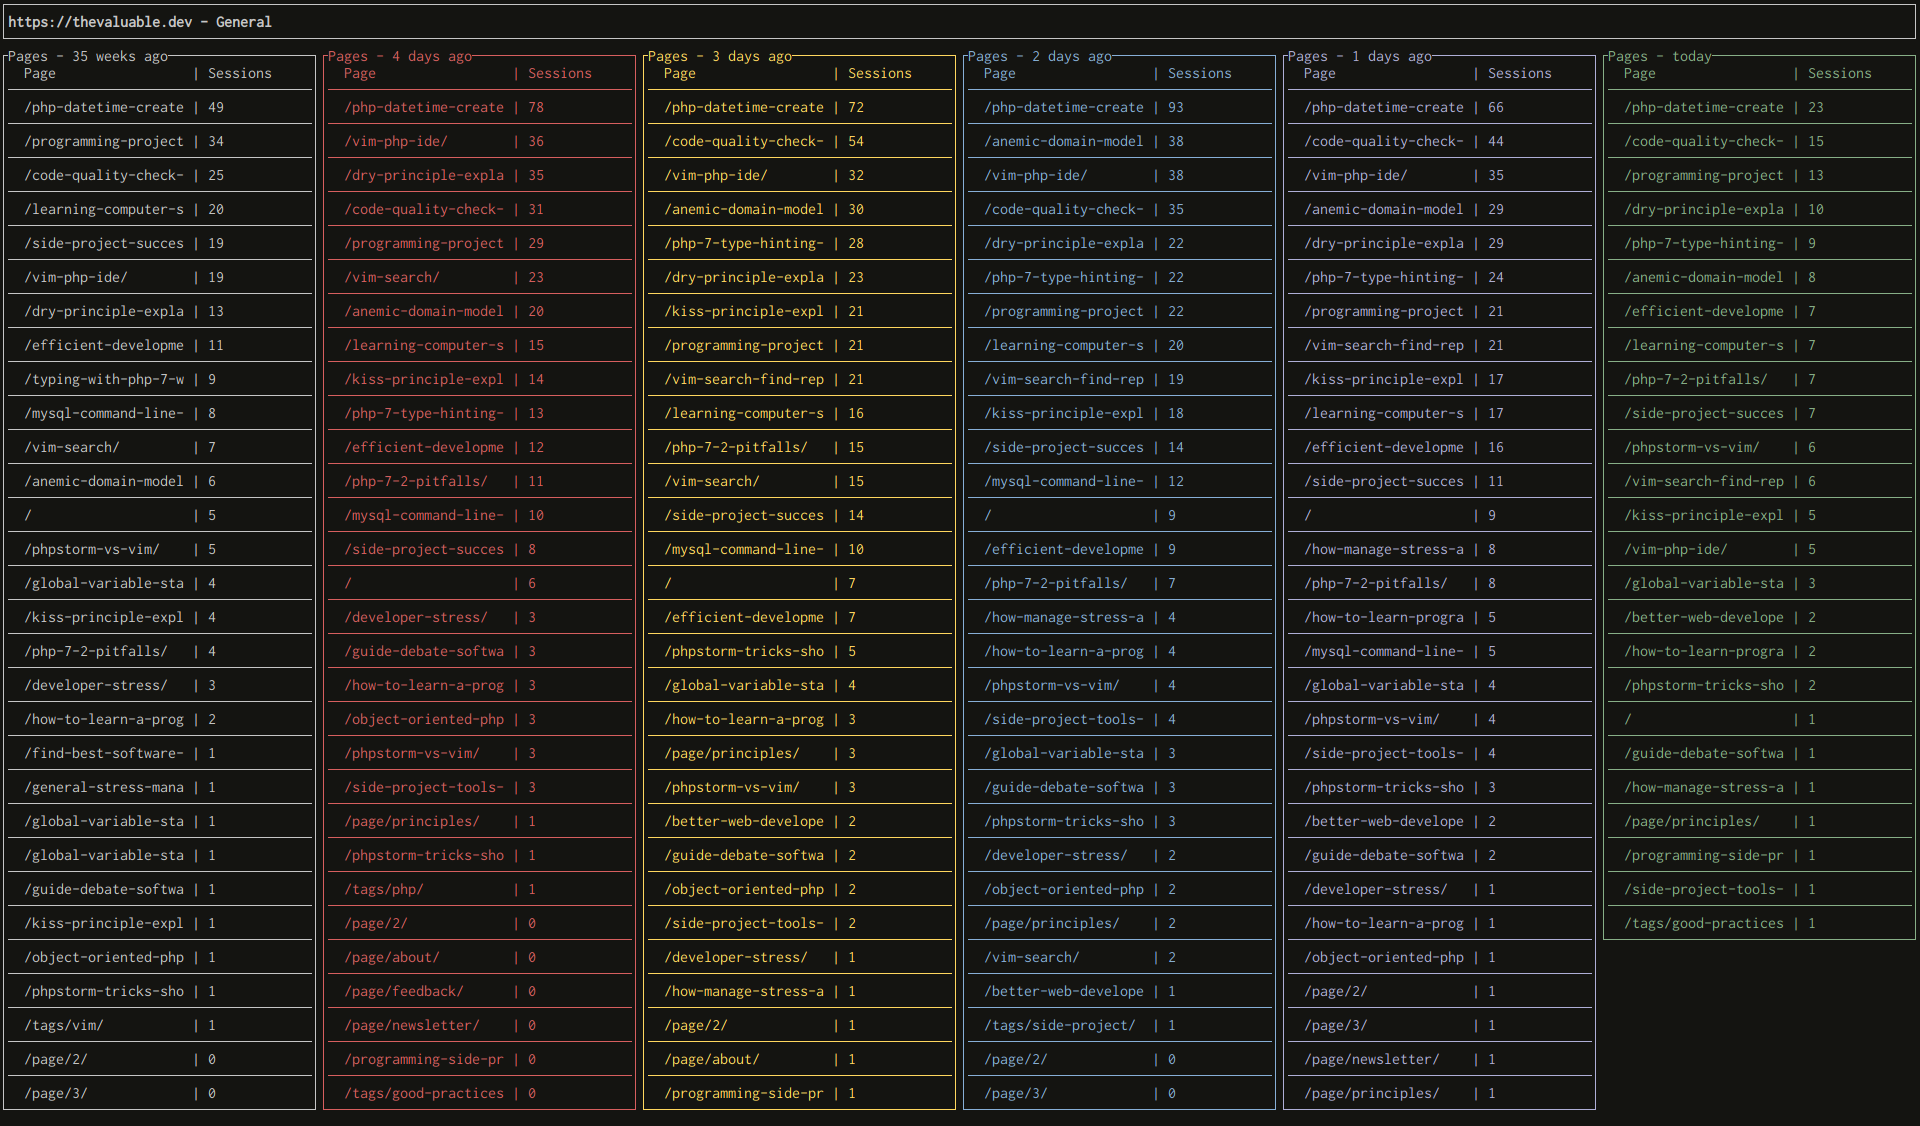
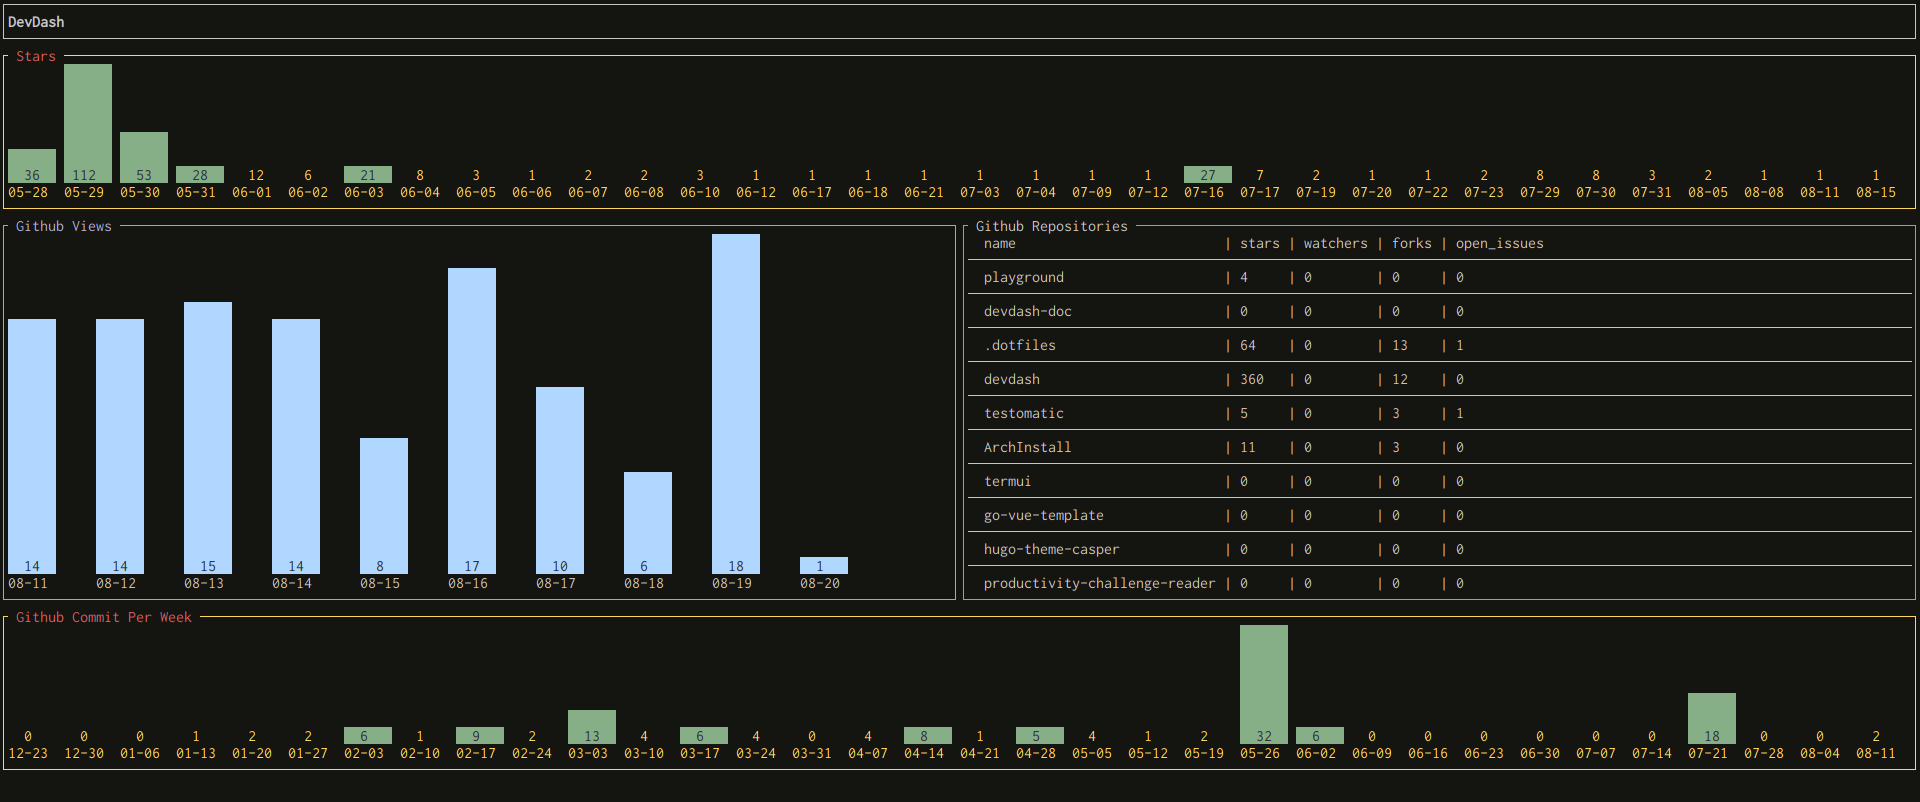
DevDash is a highly configurable terminal dashboard for developers and creators who want to choose and display the most up-to-date metrics they need, at one place.
-
Pull and display the data in nice widgets using YAML (or JSON) config files, from:
- Your own computer. From your own scripts and command lines too!
- A remote computer via SSH.
- Github.
- Travis.
- Google Analytics.
- Google Search Console.
- Feedly.
-
A lot of flexibility compared to other terminal dashboards:
- Choose the widgets you want.
- Place your widgets where you want.
- Choose the data you want to display, the colors you want to use, and a lot of other things for each widget.
- Don't want to personalize everything? Don't overwrite the defaults, then.
-
Unlimited amount of different dashboards with different configurations.
-
Data refreshed automatically via time ticks, or via a keyboard shortcut (Ctrl + r by default).
You can watch a quick demo on Youtube.
You can simply grab the latest released binary file and download the version you need, depending on your OS.
To download DevDash in /usr/local/bin, run the following in a terminal:
curl -LO https://raw.githubusercontent.com/Phantas0s/devdash/master/install/linux.sh | bashOn macOS, DevDash can also be installed via MacPorts:
sudo port install devdashMore information here.
You need to:
- Clone this repository
- In your terminal, run in the root directory of the project
go build devdash.go
- If you run
devdashwithout giving a dashboard configuration, it will:- Create a config for the default dashboard (
default.yml) in$XDG_CONFIG_HOME/devdash. - Display this default dashboard.
- Create a config for the default dashboard (
- You have many examples here to modify this default dashboard or create your own from scratch.
- Each dashboard need a config file. To pass this config file to DevDash, you need to use the option
-c. For example:devdash -c default.- If you only pass the filename of the dashboard's config, it needs to be in the working directory or in
$XDG_CONFIG_HOME/devdash. - You can also pass a relative or absolute path to the config.
- The dashboard's config can be written in YAML, JSON, or TOML.
- If you only pass the filename of the dashboard's config, it needs to be in the working directory or in
The value of $XDG_CONFIG_HOME depends of your OS. Here are the defaults (if you didn't modify it):
- Unix systems:
~/.config - macOS:
~/Library/Application Support - Windows:
%LOCALAPPDATA%
The complete DevDash documentation is here
You'll find in there:
- Installation / getting started
- Simple examples
- Real-life use cases
- Complete reference of dashboard's config
If you want to see even more real life examples, I've all of them in my dotfiles.
Thanks to MariaLetta for the awesome and beautiful Gopher pack! I used it for my logo on top.
DevDash was inspired from other open source projects:
If you have any idea to improve DevDash or if you see any bug, please open an issue.
Thanks a lot if you want to contribute to DevDash!
If you want to implement a new feature, let's speak about it first (by opening an issue) and decide if it fits DevDash scope.
For anybody interested how I managed to develop DevDash on side of a full time job, and how I organized my time and kept my motivation, I wrote an article about that on my blog.


