- PHILL WESTON
- Table of contents
- Abstract
- Introduction
- How to Run the Code
- MODEL AND ALGORITHM
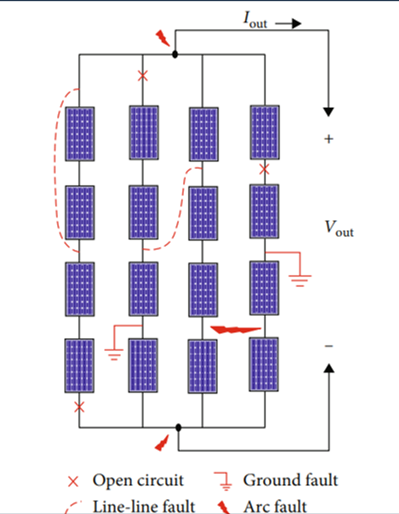
- Types of Faults
- Autonomous Drone Navigation
- Conclusion
- References
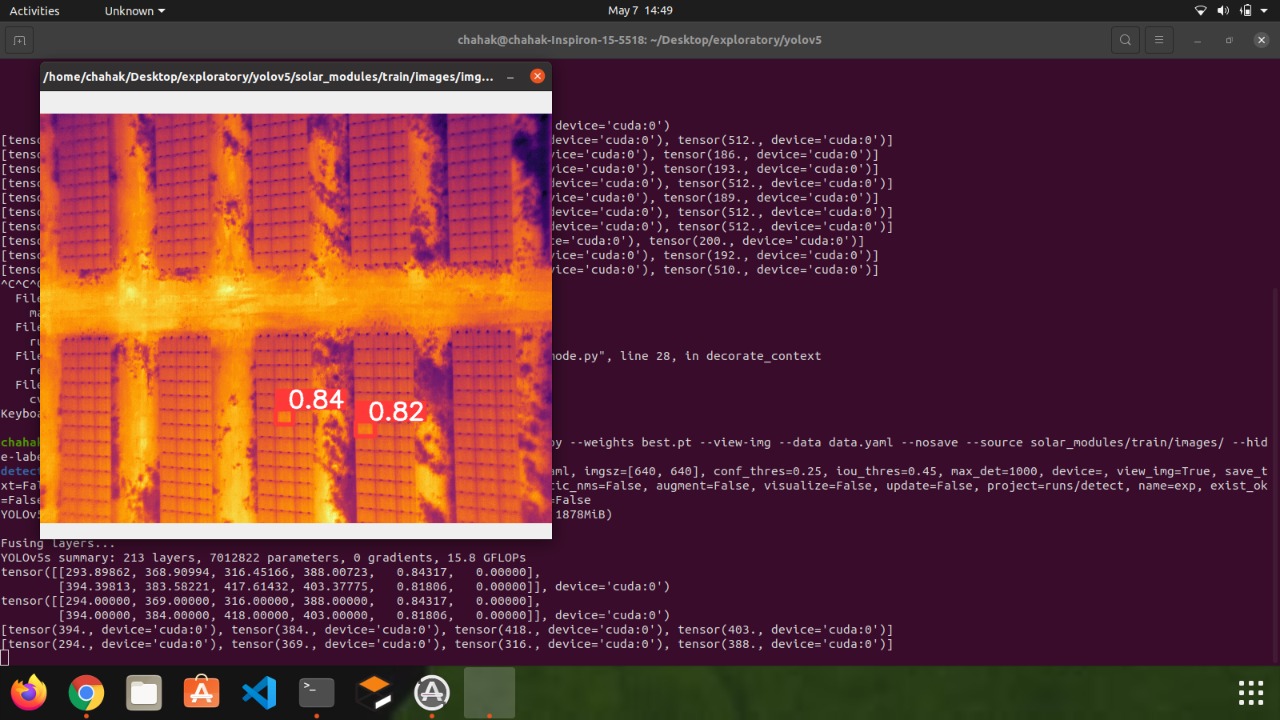
- Because of the increasing demand for renewable energy, proper management of photovoltaic hubs is important. But fault detection in them is still a challenge. The main temperature consequenced faults can be detected using Thermal analysis of PV modules. In this paper, we used YOLOv5 (YOU LOOK ONLY ONCE version 5) for detections, which is a novel state-of-the-art convolutional neural network (CNN) that detects objects in real time with great accuracy. This approach uses a single neural network to process the entire picture, then separates it into parts and predicts bounding boxes and probabilities for each component. Using YOLOv5 we detected:
- Photovoltaic array module
- Single PV module
- Faulted PV module (based on the temperature variation)
.....................
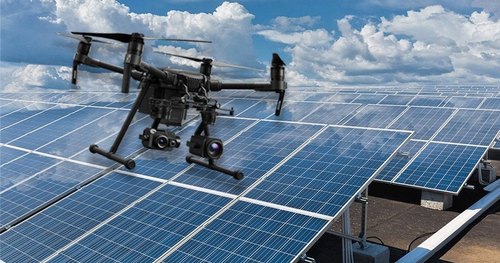
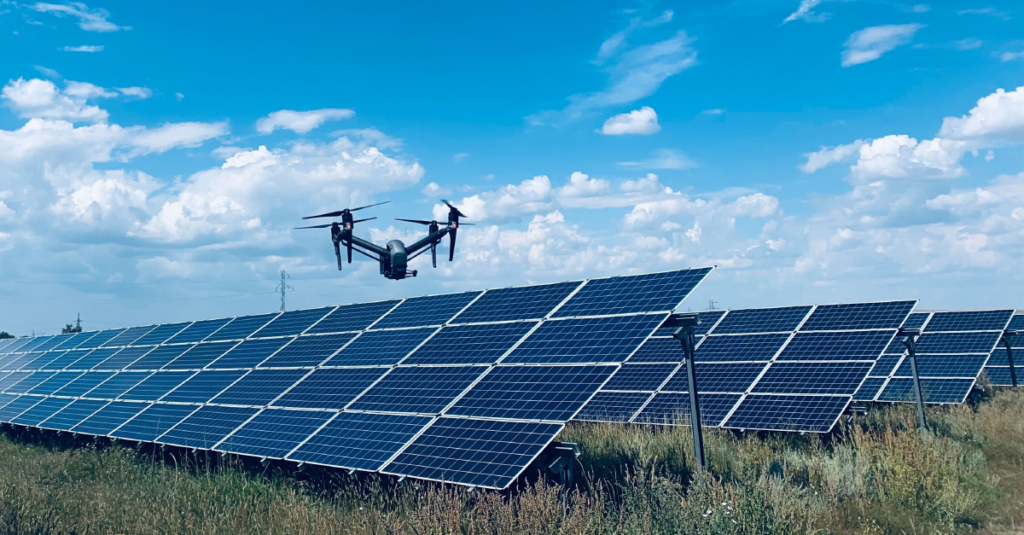
- This model will be used in the UAV quadcopter for the detection of faults on our campus. It will be uploaded using the Ardu-mission planner in the Pixhawk and jetson-nano will be used as a companion computer.
Today renewable energy sources are revolutionizing the sector of energy generation and represent the only alternative to limit fossil fuel usage. Because of its increasing needs, this sector of renewable energy generation is to be managed in a way to fulfills the ever-increasing requirements and demands. The most common and widely used renewable source is photovoltaic (PV) power plants. Which is one of the main systems adopted to produce clean energy. Monitoring the state of health of its system machines and ensuring their proper working is essential for maintaining maximum efficiency. However, due to the tremendously large area of solar farms, present techniques are time demanding, cause stops to the energy generation, and often require laboratory instrumentation, thus being not cost-effective for frequent inspections. Moreover, PV plants are often located in inaccessible places, making any intervention dangerous.
So automated fault and error detections in solar plants are today among the most active subjects of research. In this paper, we have used YOLOv5 deep learning network for the detection of solar panels and faults in thermal images of solar farms.
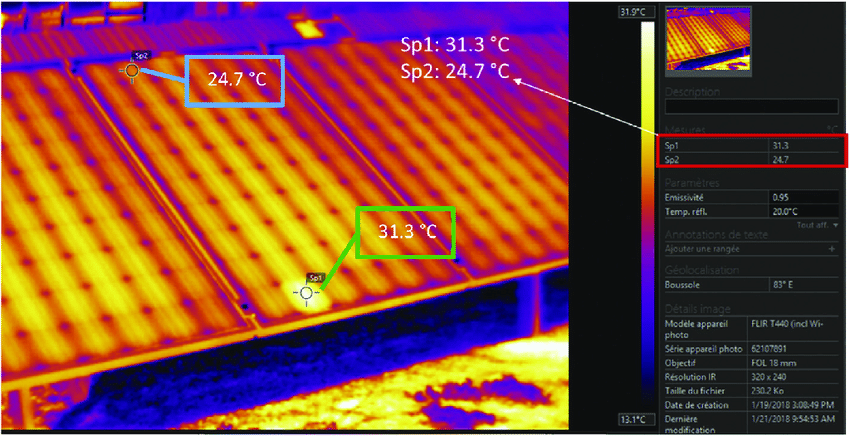
Since it is known that photovoltaic modules consist of PV cell circuits sealed in an environmentally protective laminate and are the fundamental building blocks of PV systems. Photovoltaic panels include one or more PV modules assembled as a pre-wired, field-installable unit. A photovoltaic array is the complete power-generating unit, consisting of any number of PV modules and panels. Irradiance and temperature are some of the factors that decide the efficiency of PV modules and hence can be used as parameters for fault detection in PV arrays. Irradiance is defined as the measure of the power density of sunlight received and is measured in watts per meter square. With the increasing solar irradiance, both the open-circuit voltage and the short-circuit current increase and hence the maximum power point varies. Temperature plays another major factor. As the temperature increases, the rate of photon generation increases thus reverse saturation current increases rapidly and this reduces the band gap. Hence this leads to marginal changes in current but major changes in voltage. Temperature acts as a negative factor affecting solar cell performance. Hence Temperature difference is used by us as the main parameter for the detection of faults because defects and faults in PV modules and arrays almost always generate some temperature difference on the laminated semiconductor panel screen.
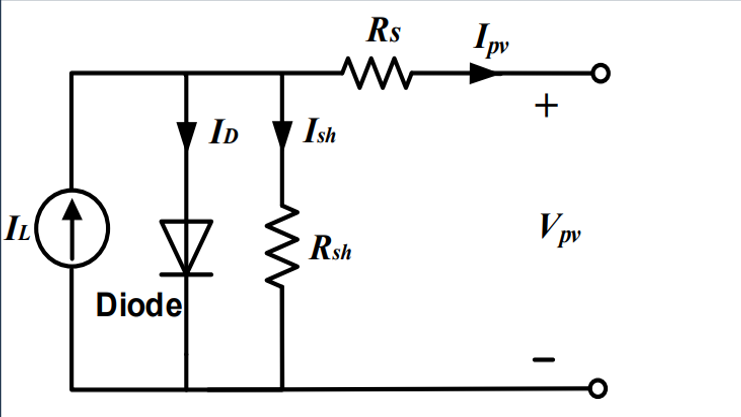
Equivalent circuit of a PV cell
Parameters of circuit
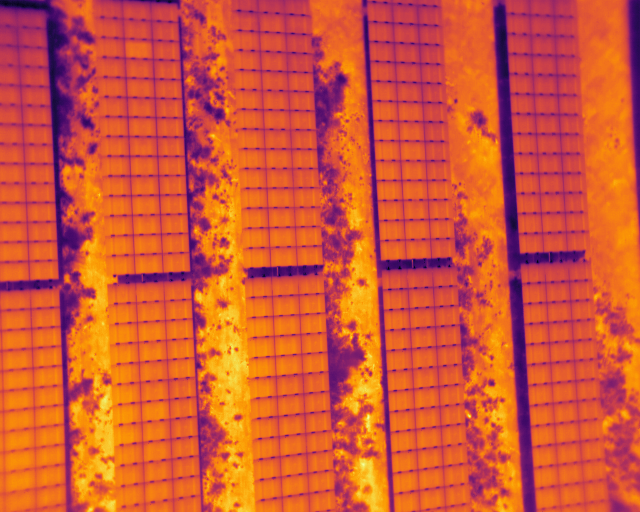
This temperature variation when taken as an RGB 3-dim arrayed image matrix through a thermal camera mounted on the UAV is used as the feeding data for training of our YOLO model.
- Clone the repository to your local machine.
- Open the command prompt or terminal with your specific Python environment and type pip install requirement.txt.
- Now place the test thermal image in the
test_folderfolder. - Run the
app.pyfile with your Python interpreter. - View the results on the browser at
http://127.0.0.1:7860
YOLO an acronym for 'You only look once', is an object detection algorithm that divides images into a grid system. Each cell in the grid is responsible for detecting objects within itself. Today YOLO is one of the most famous object detection algorithms due to its speed and accuracy.
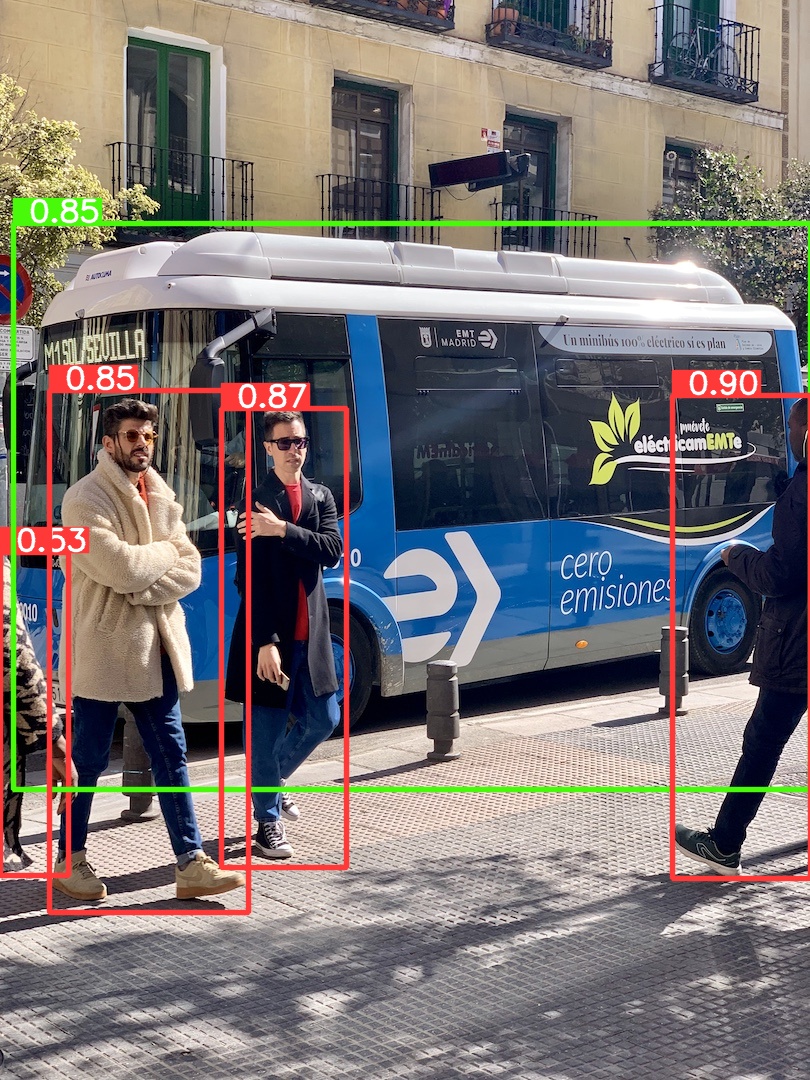
It uses a single neural network to process the entire picture, then separates it into parts and predicts bounding boxes and probabilities for each component. These bounding boxes are weighted by the expected probability. The method “just looks once” at the image in the sense that it makes predictions after only one forward propagation run through the neural network. It then delivers detected items after non-max suppression (which ensures that the object detection algorithm only identifies each object once).
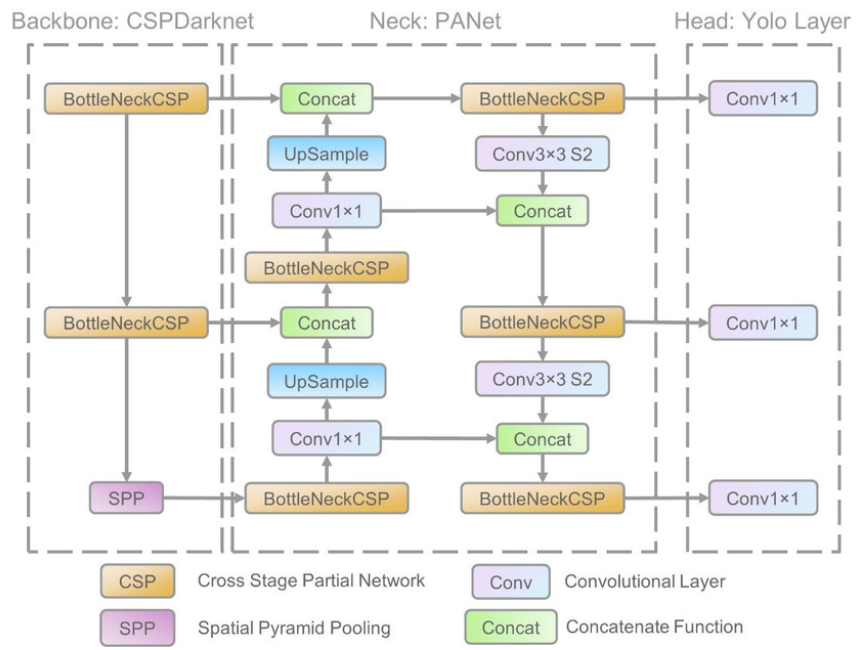
Its architecture mainly consisted of three parts, namely:
- Backbone: The model Backbone is mostly used to extract key features from an input image. CSP(Cross Stage Partial Networks) are used as a backbone in YOLO v5 to extract rich in useful characteristics from an input image.
- Neck: The Model Neck is mostly used to create feature pyramids. Feature pyramids aid models in generalizing successfully when it comes to object scaling. It aids in the identification of the same object in various sizes and scales. Feature pyramids are quite beneficial in assisting models to perform effectively on previously unseen data. Other models, such as FPN, BiFPN, and PANet, use various sorts of feature pyramid approaches. PANet is used as a neck in YOLO v5 to feature pyramids.
- Head: The model Head is mostly responsible for the final detection step. It uses anchor boxes to construct final output vectors with class probabilities, objectness scores, and bounding boxes.
YOLO ARCHITECTURE
- YOLOv5 is specifically preferred above other YOLO versions because YOLOv5 is about 88% smaller than YOLOv4 (27 MB vs 244 MB), It is about 180% faster than YOLOv4 (140 FPS vs 50 FPS) and is roughly as accurate as YOLOv4 on the same task (0.895 mAP vs 0.892 mAP).
- It was released shortly after the release of YOLOv4 by Glenn Jocher using the Pytorch framework on 18 May 2020
- Also, YOLOv5 is preferred over other detection models like R-CNN, Fast-RCNN and Faster-RCNN even though YOLO and Faster RCNN both share many similarities. They both use an anchor box-based network structure, both use bounding regressions. Things that differentiate YOLO from Faster RCNN is that it makes the classification and bounding box regression at the same time. Judging from the year they were published, it makes sense that YOLO wanted a more elegant way to do regression and classification. YOLO however does have its drawbacks in object detection. YOLO has difficulty detecting objects that are small and close to each other due to only two anchor boxes in a grid predicting only one class of object. It doesn’t generalize well when objects in the image show rare aspects of ratio. Faster RCNN on the other hand, does detect small objects well since it has nine anchors in a single grid, however, it fails to do real-time detection with its two-step architecture.
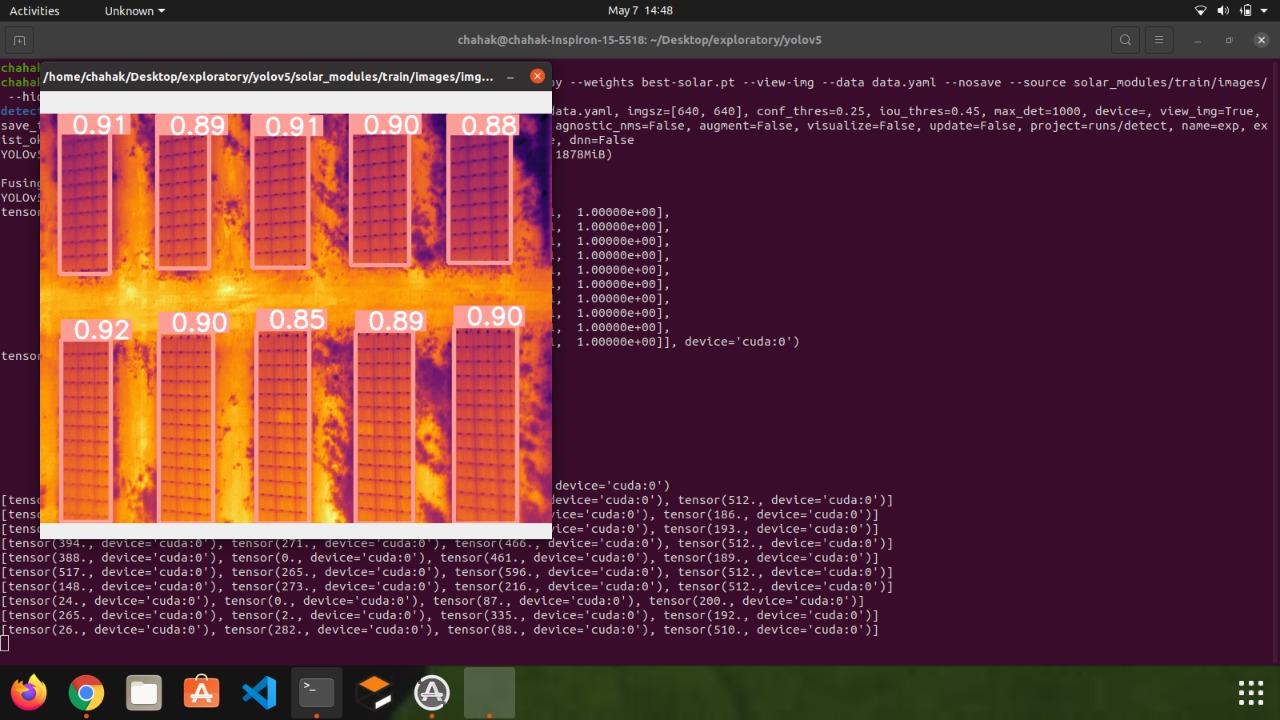
Bounding boxes around detected objects
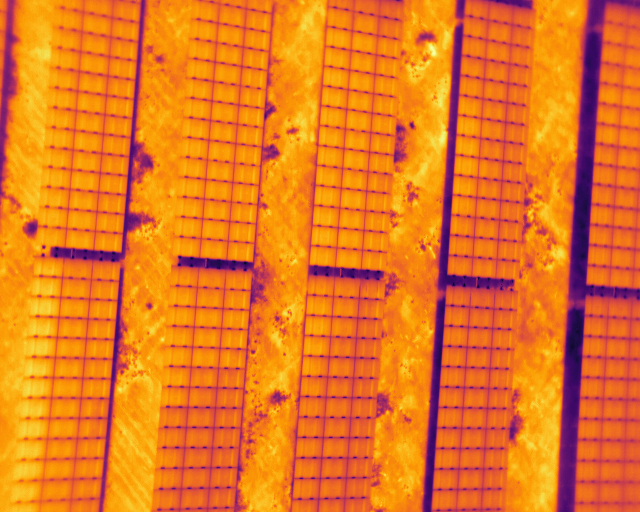
The basic data used for this project is The photovoltaic thermal image dataset which was given to us by the Robotics and Artificial Intelligence Department of Information Engineering Università Politecnica Delle Marche. For its collection, a thermographic inspection of a ground-based PV system was carried out on a PV plant with a power of approximately 66 MW in Tombourke, South Africa. The thermographic acquisitions were made over seven working days, from 21 to 27 January 2019 with the sky predominantly clear and with maximum irradiation. This situation is optimal for enhancing any abnormal behavior(faults) of entire panels or any specific portion.
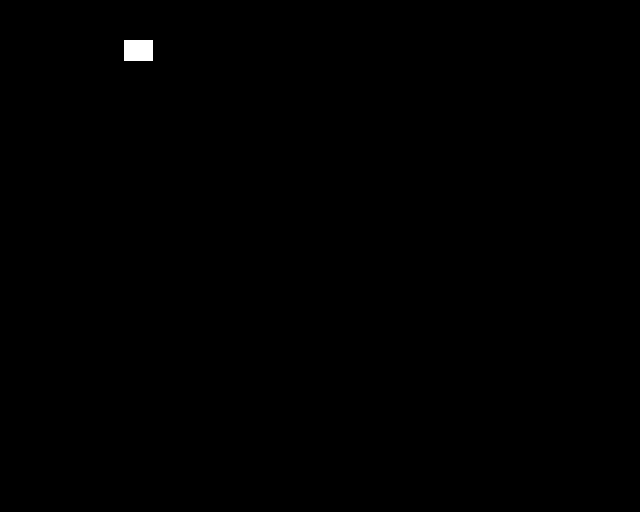
The dataset contains 3 folders each containing 1009 images. 1st folder stores pre-processed thermal images taken by the UAV copter, the 2nd folder contains the equivalent grayscale images of the same thermal image taken through the copter, while 3rd folder contains masked images showing the separated single defected cells or a contiguous sequence of faulty cells (string). Each folder contains images of size 512 X 640 pixels.
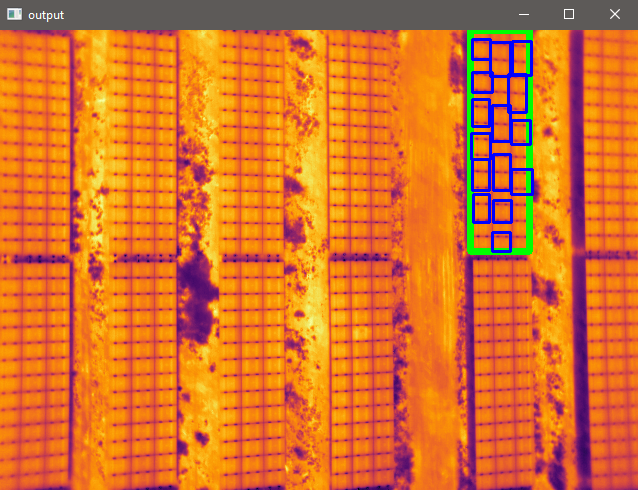
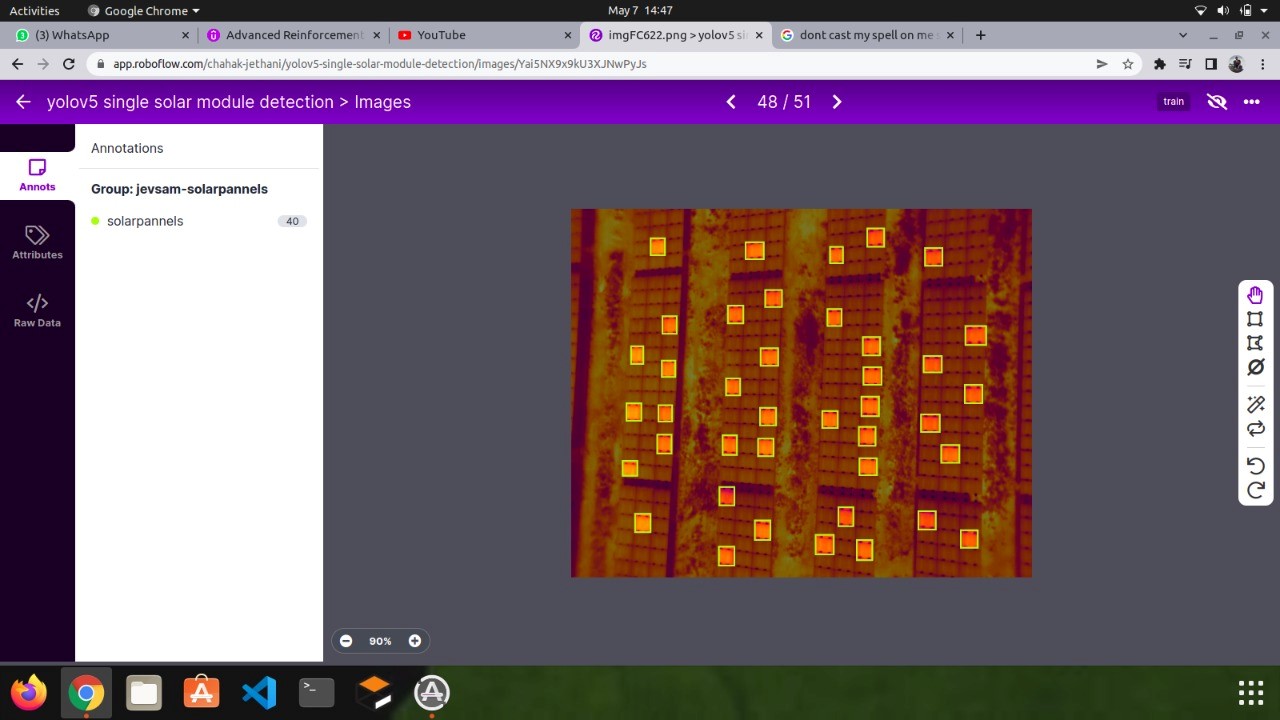
This data is modified in three different forms to obtain three different detection models for PV array, module and fault respectively. For YOLO to work we need bounding boxes around the object of consideration. YOLO needs images along with the text file containing the coordinates of the bounding rectangle around the object of consideration. We made bounding boxes around the faulty cells and strings using the masked images provided to us. But for PV array and single cell detection, we made bounding boxes using app.roboflow.com.
For the PV array, we made on average 4 bounding boxes per image for about 200 images. And on average 30 bounding boxes per image for 72 images for single PV cell detection.
- In-depth specifications of the drone are here.
- To learn more about the sensors used in the drone, click here
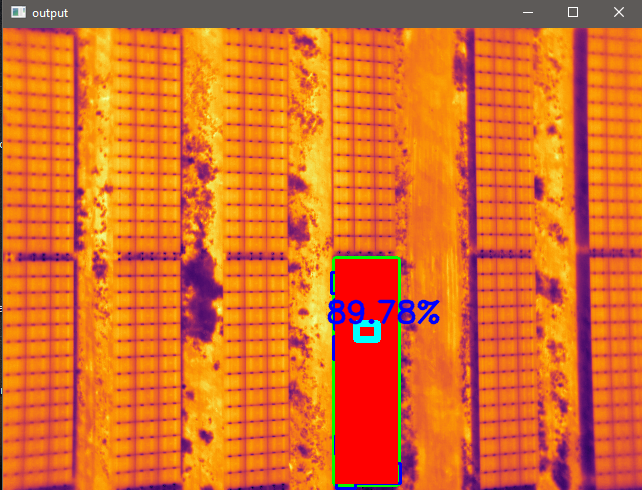
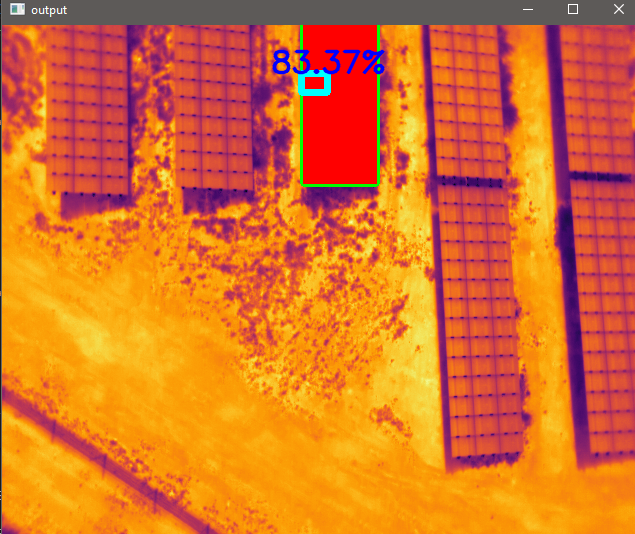
Predictions are reasonably acceptable. Detections do not have any false positives in them.
- PV array detection has given the best results among all 3 detections during validations and testing. The model has almost perfect weights for PV array detection with an accuracy of.
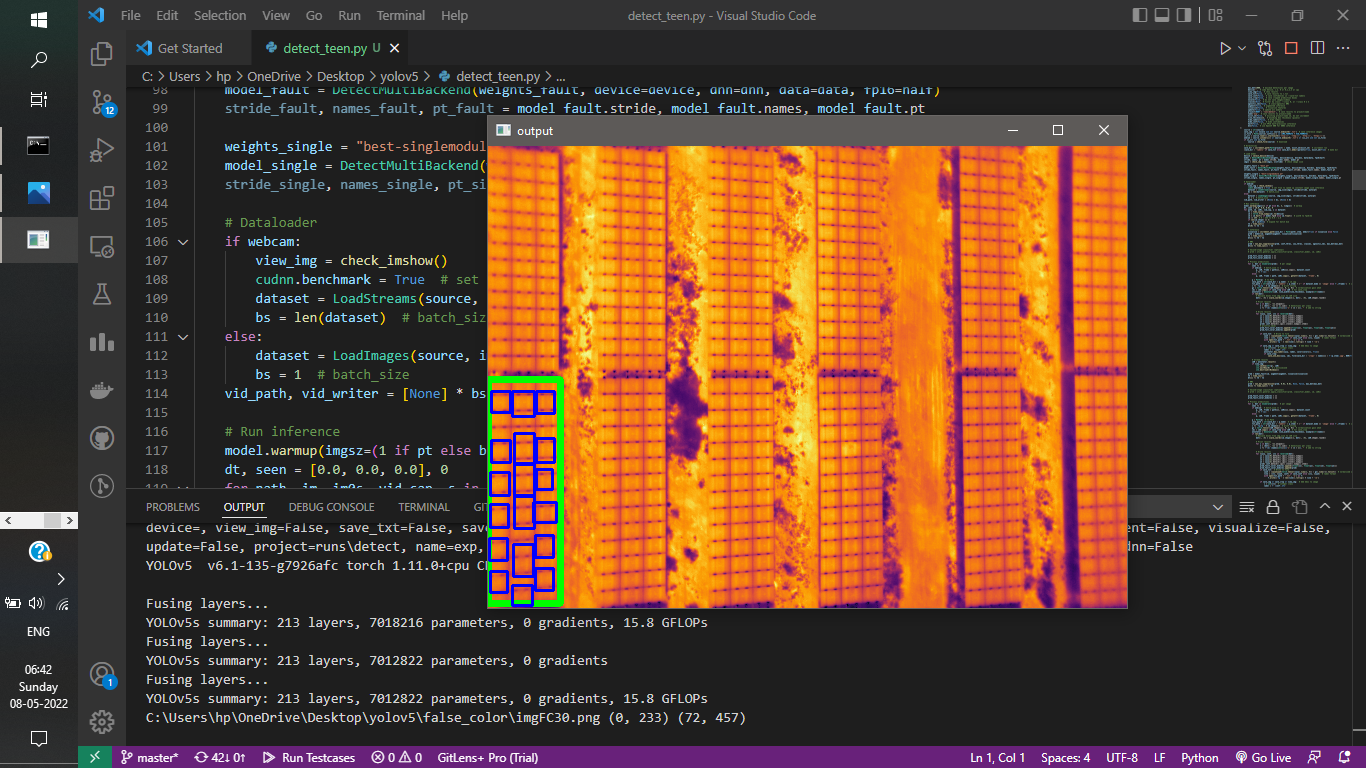
- Single PV cell detection model predictions are also fairly accurate. However, sometimes it considers 2-3 PV modules as a single separated cell. And also sometimes leaves some boundary cells by not considering them as PV cells. Has accuracy of
- Faulty cell detections are also accurate for single defected cells and contiguous sequences of defective cells (string). The model has the accuracy of
| Requirements | Link(s) |
|---|---|
| python3 | |
| torch-python | |
| packages | |
| Bounding box maker | |
| Exploratory Repository |
- Gitclone the repository in your system.
- Open the command prompt or terminal with your specific Python environment and type pip install requirement.txt.
- Now place the test thermal image in the false color folder.
- Open the detect_teen.py file and run it with your Python interpreter.
- Results will be displayed on a screen and will be stored inside the runs folder.
-
Soiling Fault:
- Detection of Faults due to dirt(because of various reasons) could be done easily as it will be warmer as compared to its surroundings.
- Could be detected if a local temperature variation is encountered while scanning.
-
Diode Fault:
- High Resistance or other defects at specific parts of the Diode screen of the panel(ex: bending etc)
- Can be detected if different spots of temperature variation are encountered within a single module
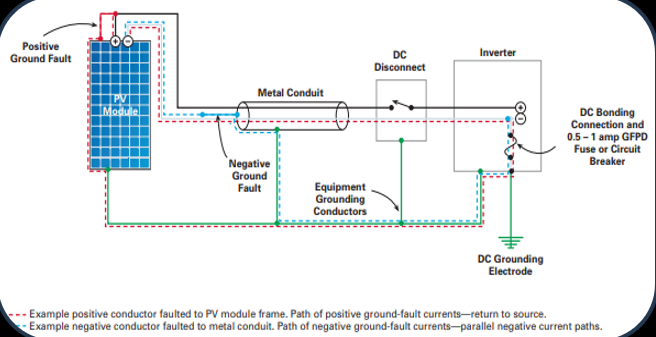
- These above electrical faults mostly affect the whole PV array/string, hence the faults coming in the whole PV array can be considered as any of the electrical faults.
- These errors can be confirmed from the parameters we can obtain through the inverter like string currents, rate of change of string current, dimensionally reduced data(PCA) of various parameters etc.
- Hence our future works will based on electrical fault detection using inverter parameters and ML model classifiers like SVM, k-nearest neighbor, random forest etc. The model with the highest accuracy will be finalized.
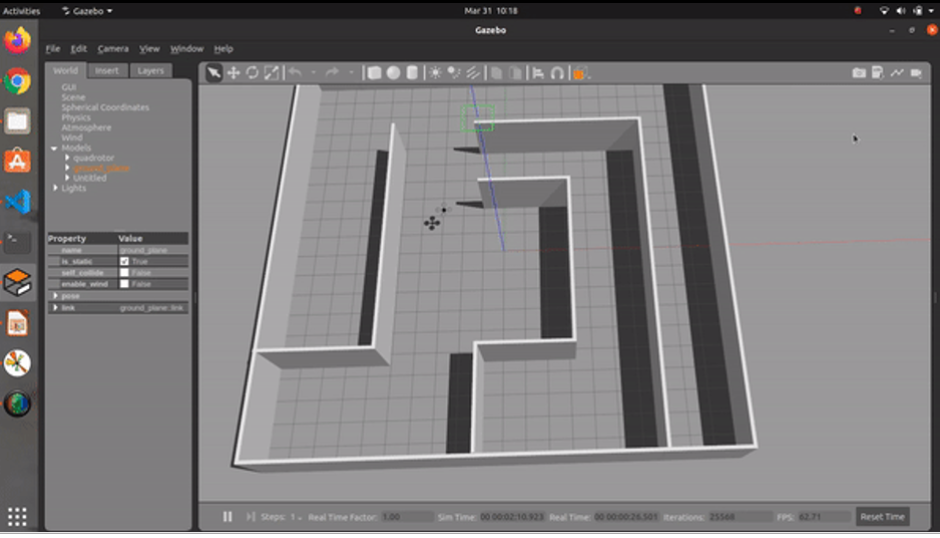
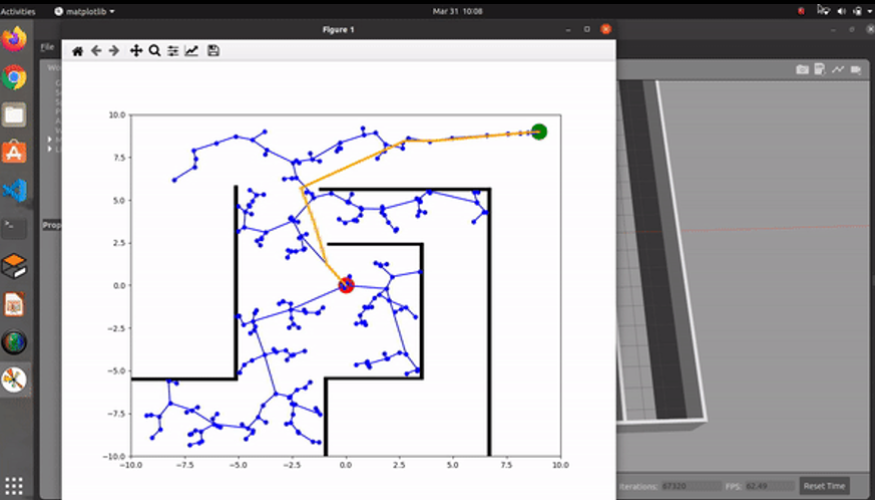
- To make the UAV quadcopter fully autonomous and capable of taking images on its own, we have simulated scripts in ROS(noetic and ubuntu 20.0) and Gazebo(version-10).
- Drone URDF and plugins were made to test the drone on simulation.
- Navigation packages from the ROS Navigation stack are added to the Drone controller. Also, Fine-tuning mapping and navigating parameters is done for best results.
- Obstacle avoidance and path planning packages are also added to the drone.
- However, due to the lack of a thermal camera plugin in the gazebo, complete testing on the simulation of drone was done.
In this paper, YOLOv5, a novel deep-learning model is used for detecting faults in large-scale PV farms and plants. To achieve great results, an improved Photovoltaic thermal image dataset was used along with a properly hypertuned model. Proper detections are shown while code runs and results are properly saved.
The proposed model(in the future) is to be deployed in Jetson which will be used as a companion computer in our UAV Copter. Copter design is almost complete in simulation(except for the thermal camera).
Demo video can be seen from HERE
-
Fault detection, classification and protection in solar photovoltaic arrays
-
Classification and Detection of Faults in Grid Connected Photovoltaic System (ijser.org)
-
2016-GOALI-Rep-1-Fault-Detection-using-Machine-Learning-in-PV-Arrays.pdf (asu.edu)
-
Deep Learning Approach for Automated Fault Detection on Solar Modules Using Image Composites
