Deecamp-Dataset-Analysis
summrize the feature of the Deecamp Dataset
this repository is about the data analysis of Deecamp Dataset and KITTI Dataset.
the related files are in Deecamp-KITTI-Dataset-Analysis
1 preprocess
File Tree:
├── csv
│   ├── Car.csv
│   ├── Car_describe.csv
│   ├── ......
├── data_pre_analysis.py
├── object_nums
│   ├── object_nums.png
│   └── val_object_nums.csv
├── plot
│   ├── Car
│   │   ├── Car_h.png
│   │   ├── ......
│   ├── Cyclist
│   ├── DontCare
│   ├── Pedestrian
│   ├── Tricar
│   └── Truck
├── data_pre_analysis.py
└── need_to_process.txt
Quick Start:
python data_pre_analysis.py
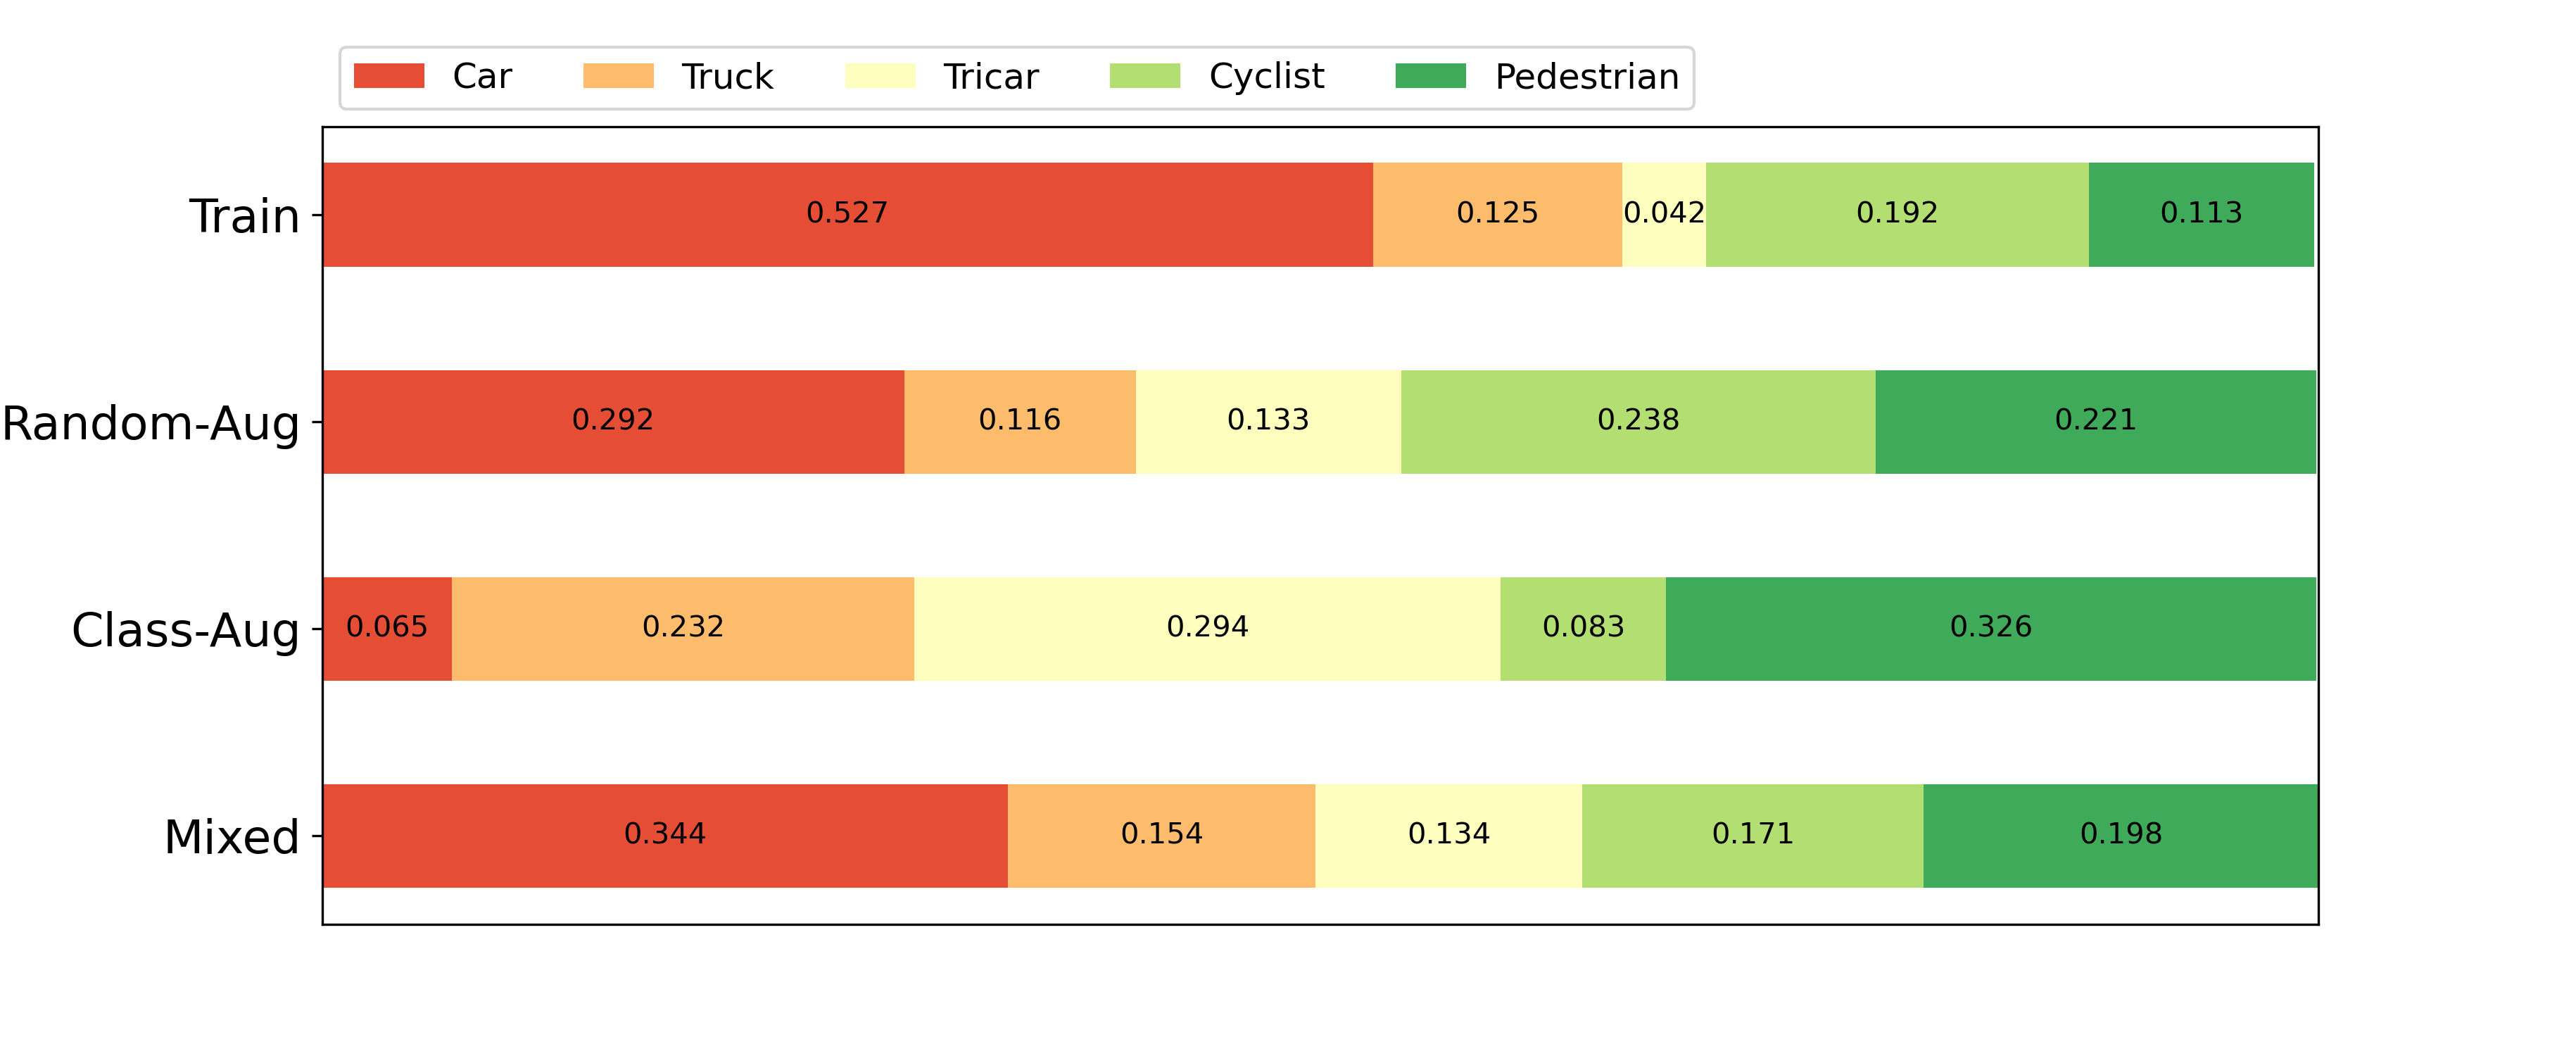
Demo, the comparison of different types of Deecamp Dataset:
2 postprocess
File stream :
graph LR
A[val_filter.txt] -->|txtfileio.py|C(tlabels.json)
    C -->|fileio.py| E(labels.json)
    E -->|getfpfn.py| H(fpfn.json)
    E -->|hist.py| G(labelshist.json)
    G -->|percentage.py| I(percentage.json)

B(prediction.pkl) -->D(tpre.json)
    D -->|fileio.py| F(prediction.json)
    F -->|getfpfn.py| H(fpfn.json)
    H -->|hist.py| J(prehist.json)
    J -->|percentage.py| I
from percentage.json analyze data and plot
Quick Start:
python plot.py
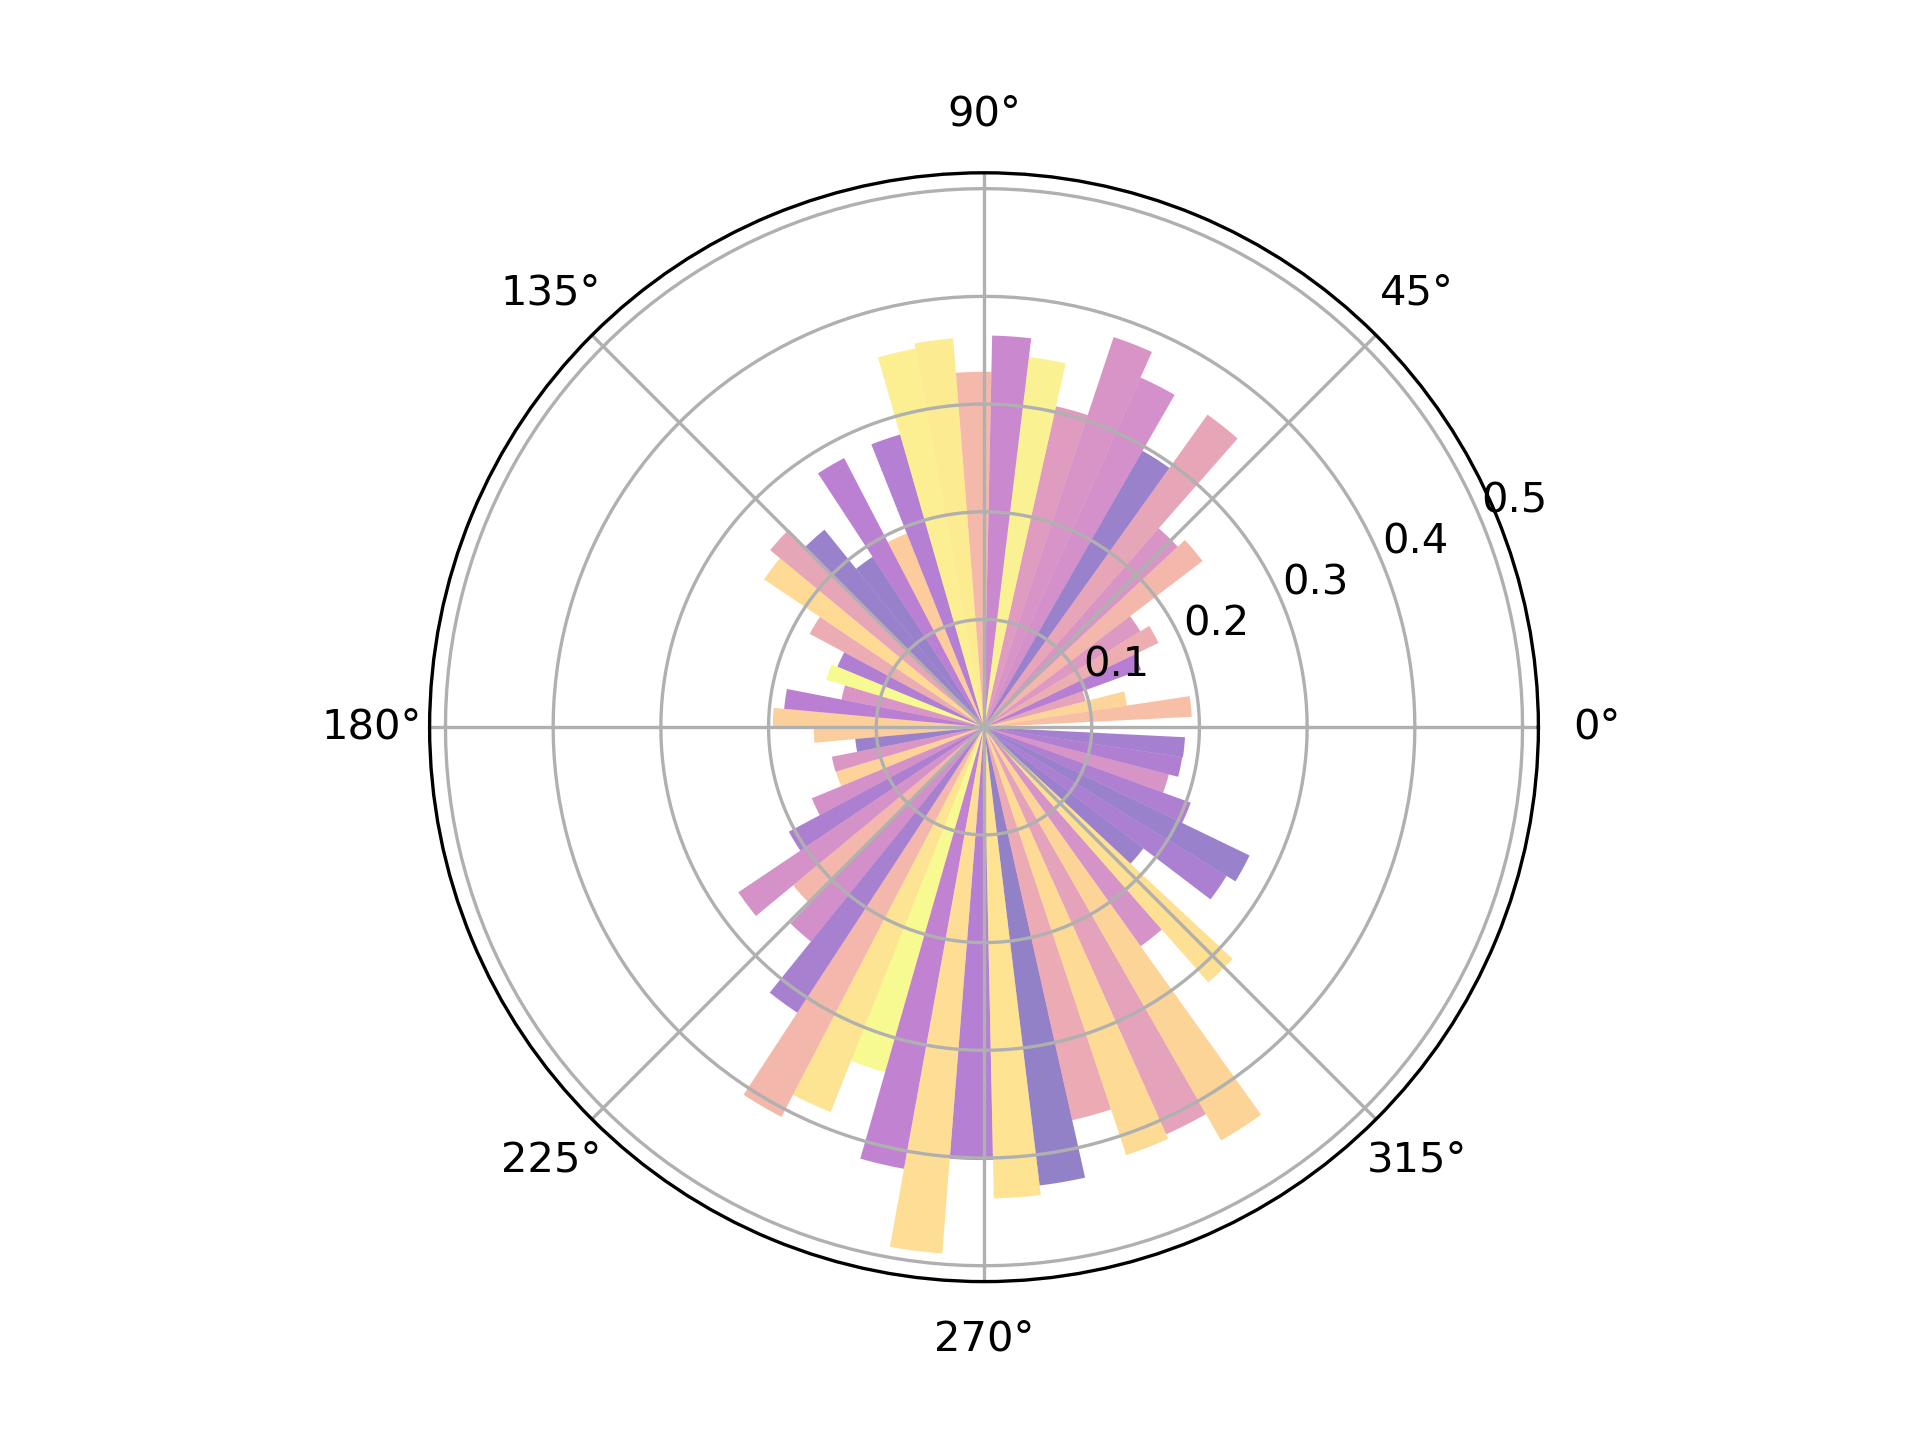
Demo, the relationship between directions to LiDAR and Miss Rate of 'Car':
3 kitti process
process kitti trainset
Quick Start:
python kitti_analysis.py
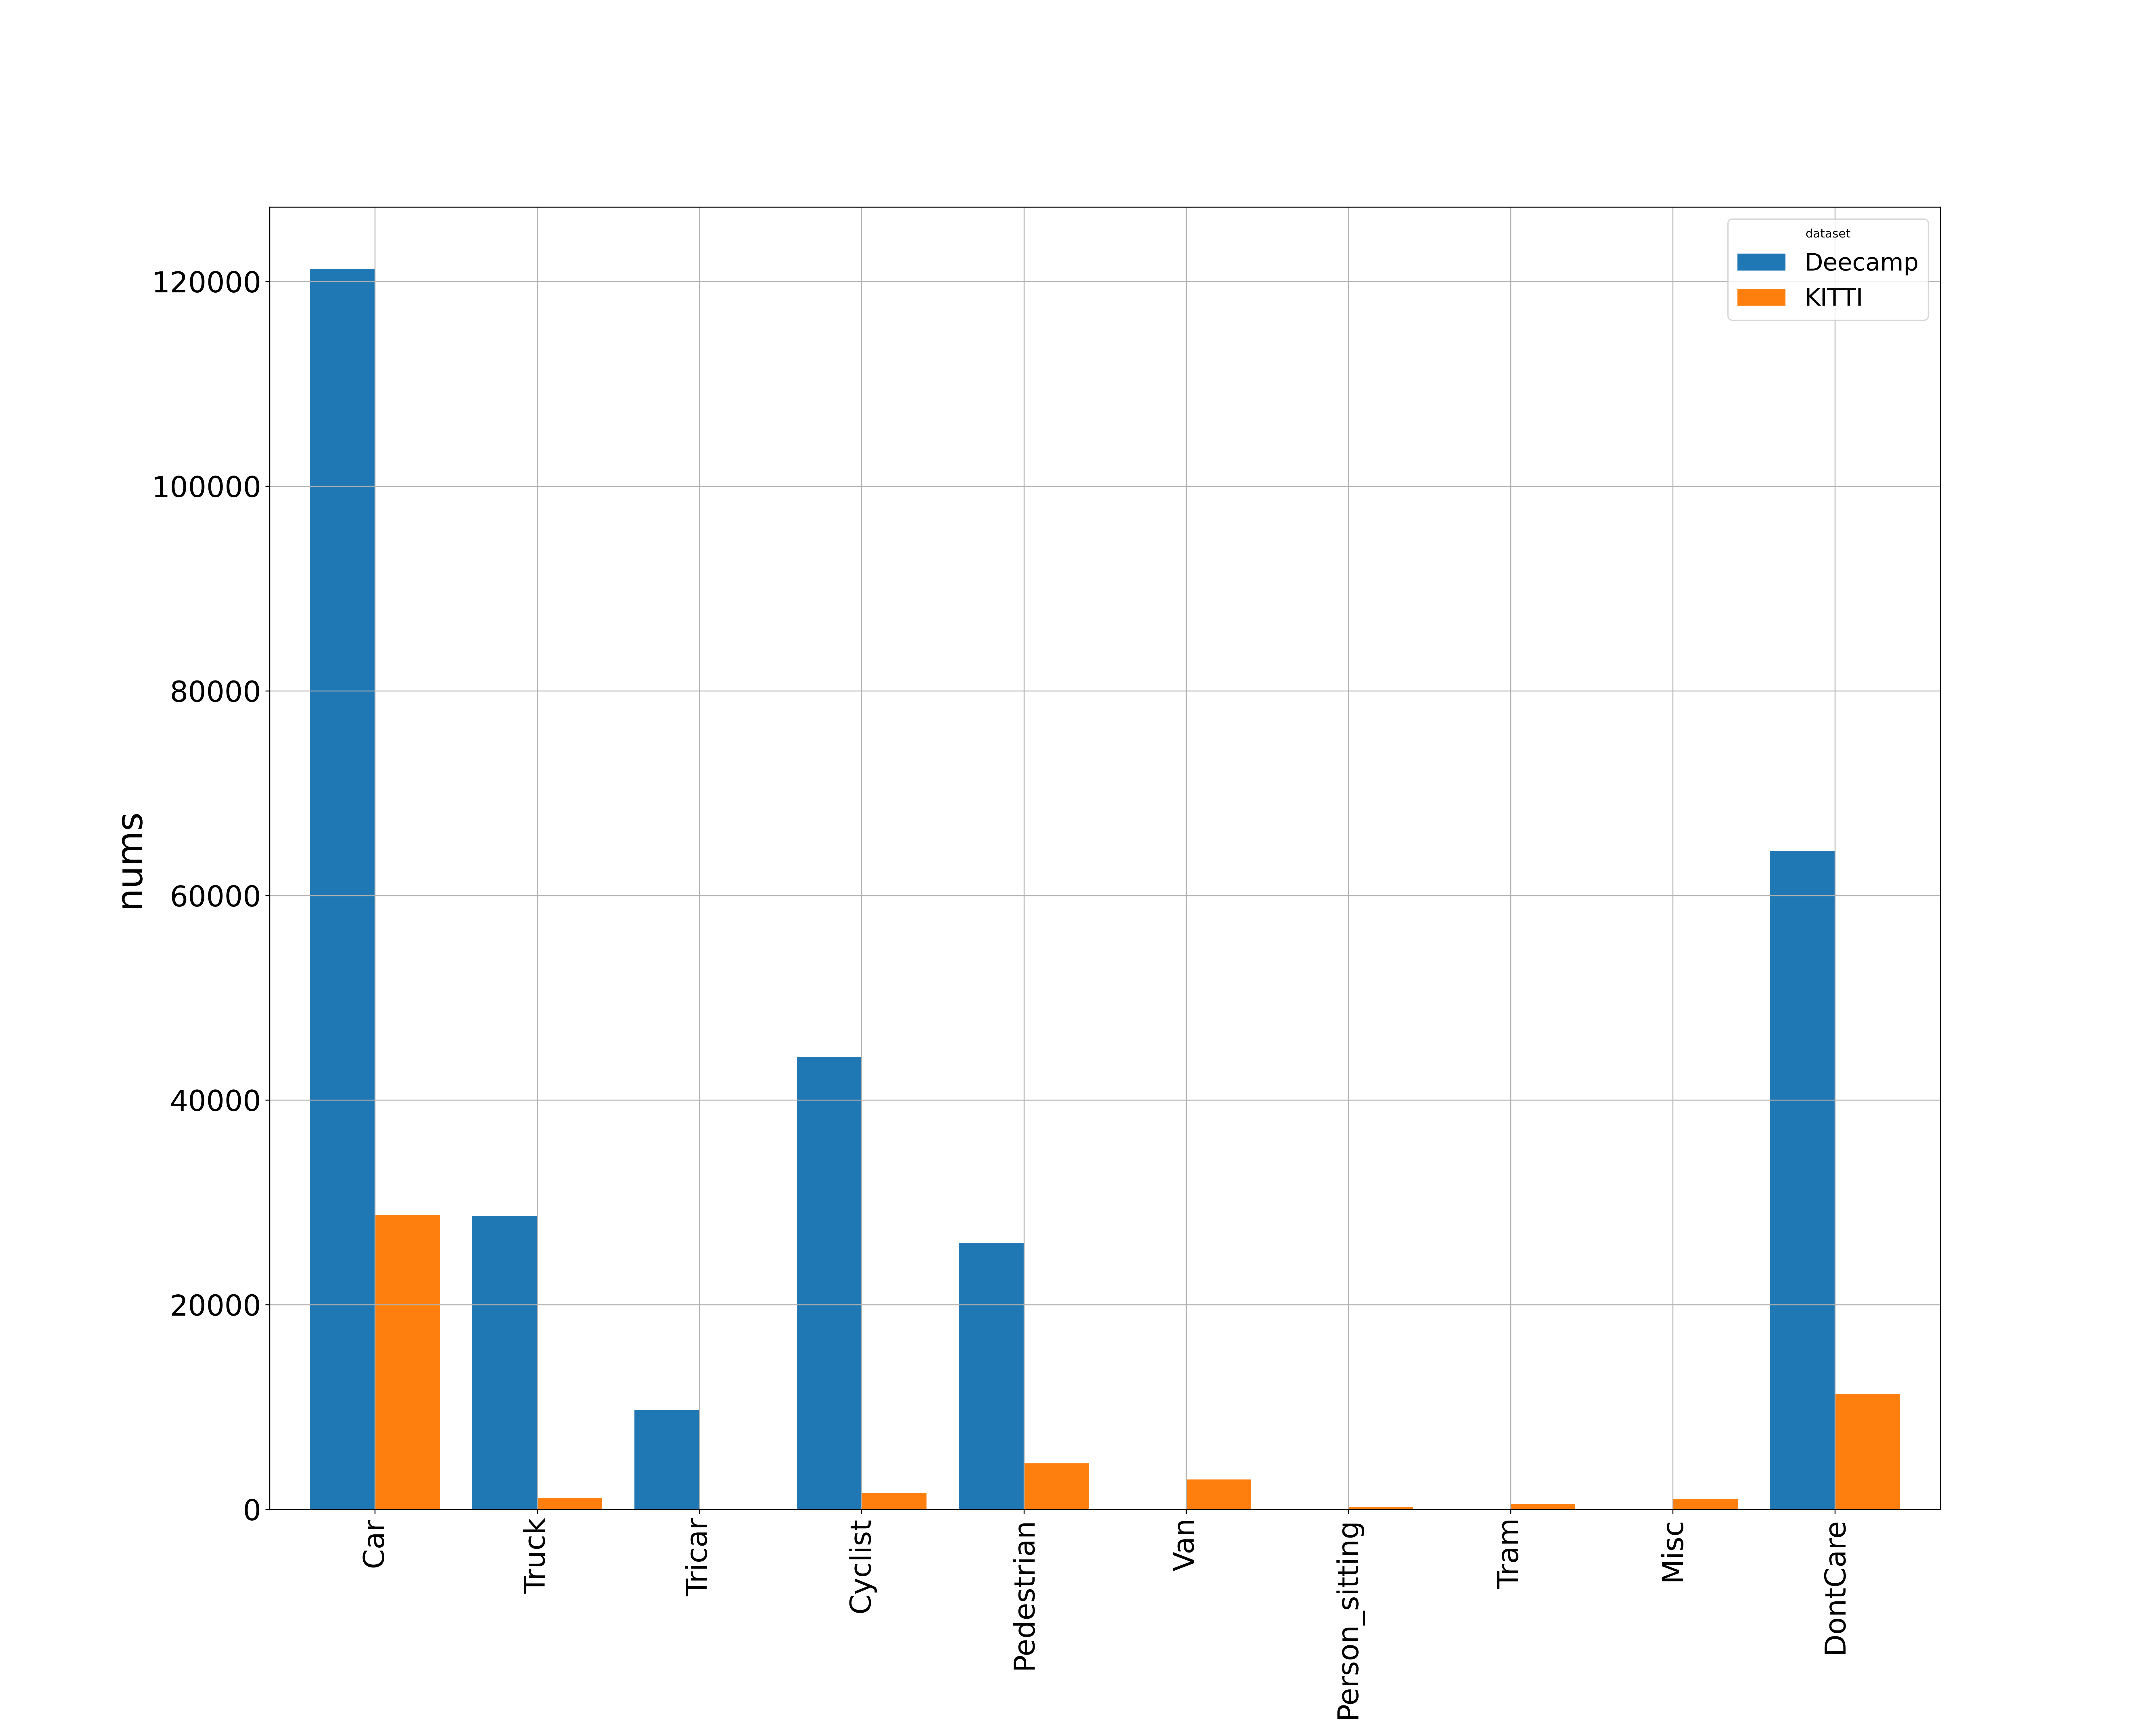
Demo, the comparison of KITTI Dateset and Deecamp Dataset:


