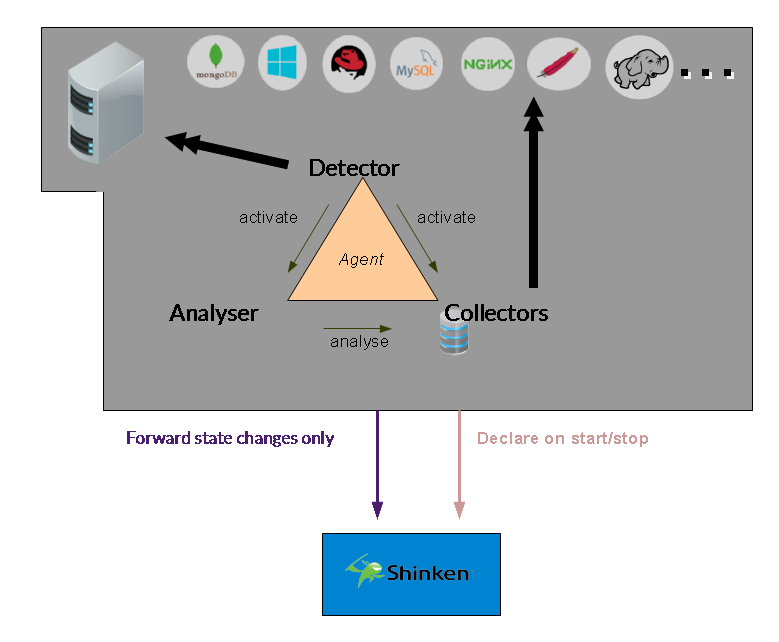
This is a first release of the kunai project about a service discovery / monitoring / light cfg management / command execution tool.
You will need:
- python >= 2.6 (but not 3 currently)
- python-leveldb
- python-requests
- python-jinja2
- python-cherrypy3
To monitor linux:
- sysstat
To monitor mongodb server:
- python-pymongo
To monitor mysql server:
- python-mysql
To monitor redis server:
- python-redis
Just launch:
python setup.py install
You can start kunai as a daemon with:
/etc/init.d/kunai start
You can also launch it in foreground:
kunai agent start
Just launch:
kunai agent stop
Or use the init.d script:
/etc/init.d/kunai stop
Just launch:
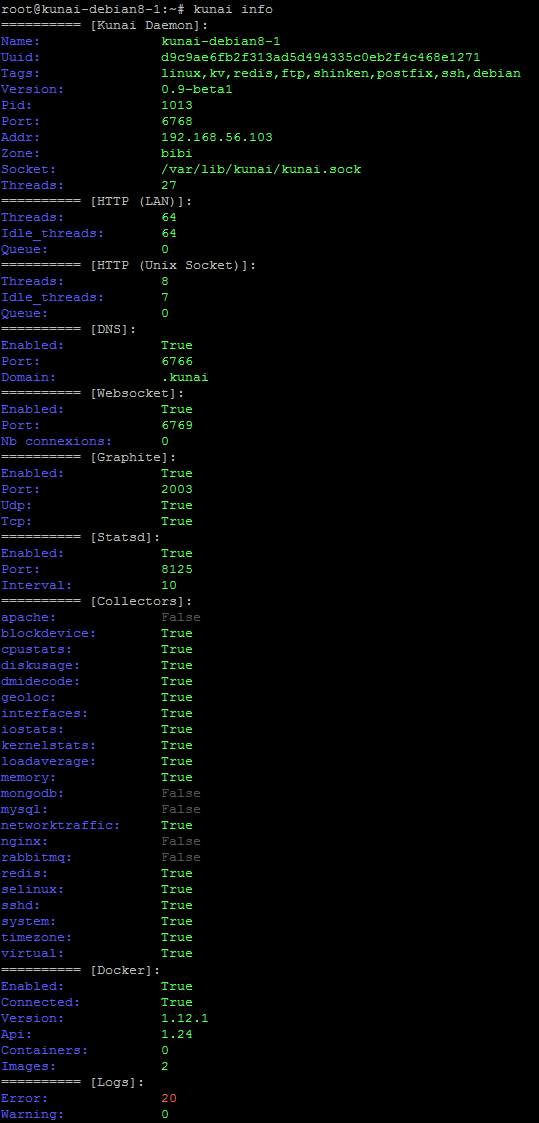
kunai info
You will have several information about the current kunai agent state:
First you need to install and launch the node in another server.
Then in this other server you can launch:
kunai join OTHER-IP
You can list the cluster members on all nodes with :
kunai members
And you will see the new node on the UI if you enable it
Detectors are rules that are executed by the agent to detect your server properties like
- OS (linux, redhat, centos, debian, windows, ...)
- Applications (mongodb, redis, mysql, apache, ...)
- Location (city, GPS Lat/Long)
You should declare a json object like:
{
   "detector": {
      "interval": "10s"
      "apply_if": "grep('centos', '/etc/redhat-release')",
      "tags": ["linux", "centos"],
   }
}
- Execute every 10 seconds
- If there is the strong centos in the file /etc/redhat-release
- Then add the tags "linux" and centos" to the local agent
Collectors are code executed by the agent to grok and store local os or application metrics.
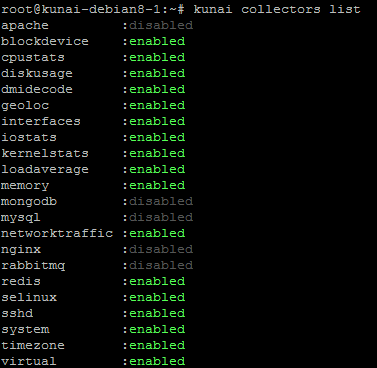
You can list available collectors with the command:
kunai collectors list
- enabled: it's running well
- disabled: it's missing a librairy for running
You can execute checks on your agent by two means:
- Use the collectors data and evaluate check rule on it
- Execute a nagios-like plugin
Some parameters are common on the two check types you can defined.
- interval: how much seconds the checks will be scheduled
- apply_on: if present, will declare and execute the check only if the agent tag is present
Evaluated check will use collectors data and should be defined with:
- ok_output: python expression that create a string that will be shown to the user if the state is OK
- critical_if: python expression that try to detect a CRITICAL state
- critical_output: python expression that create a string that will be shown to the user if the state is CRITICAL
- warning_if: python expression that try to detect WARNING state
- warning_output: python expression that create a string that will be shown to the user if the state is WARNING
- thresholds: [optionnal] you can set here dict of thresholds you will access from your check rule by "configuration.thresholds.XXX"
The evaluation is done like this:
- if the critical expression is True => go CRITICAL
- else if warning expression is True => go WARNING
- else go OK
For example here is a cpu check on a linux server:
 {
    "check": {
        "interval":          "10s",
        "apply_on":          "linux",

        "ok_output":         "'OK: cpu is great: %s%%' % (100-{collector.cpustats.cpuall.%idle})",

        "critical_if":      "{collector.cpustats.cpuall.%idle} < {configuration.thresholds.cpuidle.critical}",
        "critical_output":  "'Critical: cpu is too high: %s%%' % (100-{collector.cpustats.cpuall.%idle})",

        "warning_if":       "{collector.cpustats.cpuall.%idle} < {configuration.thresholds.cpuidle.warning}",
        "warning_output":   "'Warning: cpu is very high: %s%%' % (100-{collector.cpustats.cpuall.%idle})",

        "thresholds" :       {"cpuidle" : { "warning": 5, "critical": 1} }
    }
 }
Nagios based checks will use Nagios plugins and run them. Use them if you don't have access to the information you need in the collectors.
The parameter for this is:
- script: the command line to execute your plugin
Here is an example
  {
         "check": {
              "apply_on": "linux",
              "script": "$nagiosplugins$/check_mailq -w $mailq.warning$ -c $mailq.critical$",
              "interval": "60s",

               "mailq" : {
                  "warning": 1,
                  "critical": 2
               }
         }
  }
NOTE: the $$ evaluation is not matching the previous checks, we will fix it in a future version but it will break the current version configuration.
You can be notified about check state changed with handlers. currently only one is managed: email.
You must define it in your local configuration:
{
      "handler": {
            "type": "mail",
            "severities": [ "ok", "warning", "critical", "unknown" ],
            "contacts": [ "admin@mydomain.com" ],
            "addr_from": "kunai@mydomain.com",
            "smtp_server": "localhost",
            "subject_template": "email.subject.tpl",
            "text_template": "email.text.tpl"
      }
}
- type: currently only 'mail' is managed
- severities: raise this handler only for this new states
- contacts: who notifies
- addr_from: from address to set your email from
- smtp_server: which SMTP server to end your notification
- subject_template: jinja2 template for the email subject, from the directory /templates
- text_template: jinja2 template for the email content, from the directory /templates
Then your handler must be registered into your checks, in the "handlers" list.
You can export all your nodes informations (new, deleted or change node) into your Shinken installation. It will automatically:
- create new host when you start a new node
- change the host configuration (host templates) when a new tag is add/removed on your agent
- remove your host when you delete your agent (by terminating your Cloud instance for example)
You must add in the agent installed on your shinken arbiter daemon the following local configuration:
 {
     "shinken": {
         "cfg_path": "/etc/shinken/agent"
     }
 }
- cfg_path: a directory where all your nodes will be sync as shinken hosts configuration (cfg files)
Currently it also use hard path to manage your shinken communication:
- the unix socket /var/lib/shinken/nagios.cmd should be created by your shinken arbiter/receiver named-pipe module.
- it call the "/etc/init.d/shinken reload" command when a node configuration is changed(new, removed or tag/template change)
If you enable the DNS interface for your agent, it will start an internal DNS server that will answer to queries. So your applications will be able to easily exchange with the valid node that is still alive or launched.
You must define a dns object in your local configuration to enable this interface:
{
    "dns":{
        "enabled"    : true,
        "port"       : 6766,
        "domain"     : ".kunai"
    }
}
- enabled: start or not the listener
- port: UDP port to listen for UDP requests
- domain: allowed domain to request, should match a specific domain name to be redirected to this
You will be able to query it with dig for test:
$dig -p 6766 @localhost redis.tag.dc1.kunai  +short
192.168.56.103
192.168.56.105
It list all available node with the "tag" redis.
TODO: document the local dns redirect to link into resolv.conf
The statsd protocol is a great way to extract performance statistics from your application into your monitoring system. You application will extract small timing metrics (like function execution time) and send it in a non blocking way (in UDP).
The statsd daemon part will agregate counters for 10s and will then export the min/max/average/99thpercentile to a graphite server so you can store and graph them.
In order to enable the statsd listener, you must define the statsd in your local configuration:
{
    "statsd": {
        "enabled"    : true,
        "port"       : 8125,
        "interval"   : 10
    }
}
- enabled: launch or not the statsd listener
- port: UDP port to listen
- interval: store metrics into memory for X seconds, then export them into graphite for storing
TODO: change the ts tag that enable this feature to real role
You can store your metrics into a graphite like system, that will automatically agregate your data.
In order to enable the graphite system, you must declare a graphite object in your local configuration:
{
    "graphite": {
        "enabled"    : true,
        "port"       : 2003,
        "udp"        : true,
        "tcp"        : true
    }
}
- enabled: launch or not the graphite listener
- port: TCP and/or UDP port to listen metrics
- udp: listen in UDP mode
- tcp: listen to TCP mode
TODO: finish the graphite part, to show storing and forwarding mode.
TODO: test and show graphite /render interface of the agent into grafana
You can get notified about a node change (new node, deleted node or new tag or check state change) with a websocket interface on your local agent.
All you need is to enable it on your local node configuration:
{
    "websocket": {
        "enabled"    : true,
        "port"       : 6769
    }
}
- enabled: start or not the websocket listener
- port: which TCP port to listen for the websocket connections
Note: the HTTP UI need the websocket listener to be launched to access node states.
The agent expose a KV store system. It will automatically dispatch your data into 3 nodes allowed to store raw data.
Write and Read queries can be done on the node you want, it don't have to be a KV storing node. The agent will forward your read/write query to the node that manage your key, and this one will synchronize the data with 2 others nodes after it did answer to the requestor.
The KEY dispatching between nodes is based on a SHA1 consistent hashing.
The API is:
- /kv/ (GET) : list all keys store on the local node
- /kv/KEY-NAME (GET): get the key value with base64 encoding
- /kv/KEY-NAME (PUT) : store a key value
- /kv/KEY-NAME (DELETE) : delete a key
TODO: change the KV store from tag to a role in the configuration
// Generators
The kunai agent is by default getting lot of metrology data from your OS and applications. It's done by "collctors" objets. You can easily list them and look at the colelcted data by launching:
kunai collectors show
TODO Allow to export into json format
If docker is launched on your server, Kunai will get data from it, like collectors, images and performances.
To list all of this just launch:
kunai docker show
You can ask your node cluster system to elect a node for a specific task or application thanks to the RAFT implementation inside the agents
TODO: currently in alpha stade in the code
TODO: this must be developed, in order to access your node API available in text or HTTP
Yes. There is a UI available in the /var/lib/kunai/ui/ directory. It's just flat files and so you can just export the directory with apache/nginx and play with it.


