To check metrics fetched from prometheus during testing tidb and other PingCAP products.
Check develop note for roadmap, TODOs and external documentations.
Metrics checker periodically checks query given in PromQL.
A query is satisified if it returns:
- nonempty vector. (vector: return a table in grafana's
exploreview) - non-nil scalar. (scalar: return a single line)
When a query is satisified, metric checker will send alert -- in current implementation it just fails.
rules:
    - tag: uptime
      promql: rate(process_start_time_seconds{tidb_cluster="", job="tikv"}[1m]) != 0
        # Place the PromQL you want to check here.
        # They should return a bool value.
Minimum config file. More config examples are in directory config_examples.
- Place it in ./config.yaml, or
--config {filepath}. - Pass it with
--config-base64flag. This will override the former method.
Specify the prometheus address and run:
./metrics-checker --address 127.0.0.1:9090
# output:
# 2021/01/25 15:21:07 Start checking metrics after 0s
# 2021/01/25 15:21:07 Start checking metrics
# 2021/01/25 15:21:07 Prometheus address: http://127.0.0.1:9090
# 2021/01/25 15:21:07 checking query: sum(rate(tidb_session_transaction_duration_seconds_count[5m])) > bool sum(rate(tidb_session_transaction_duration_seconds_count[10m]))Add metrics you want to show in config.yaml:
metrics-to-show:
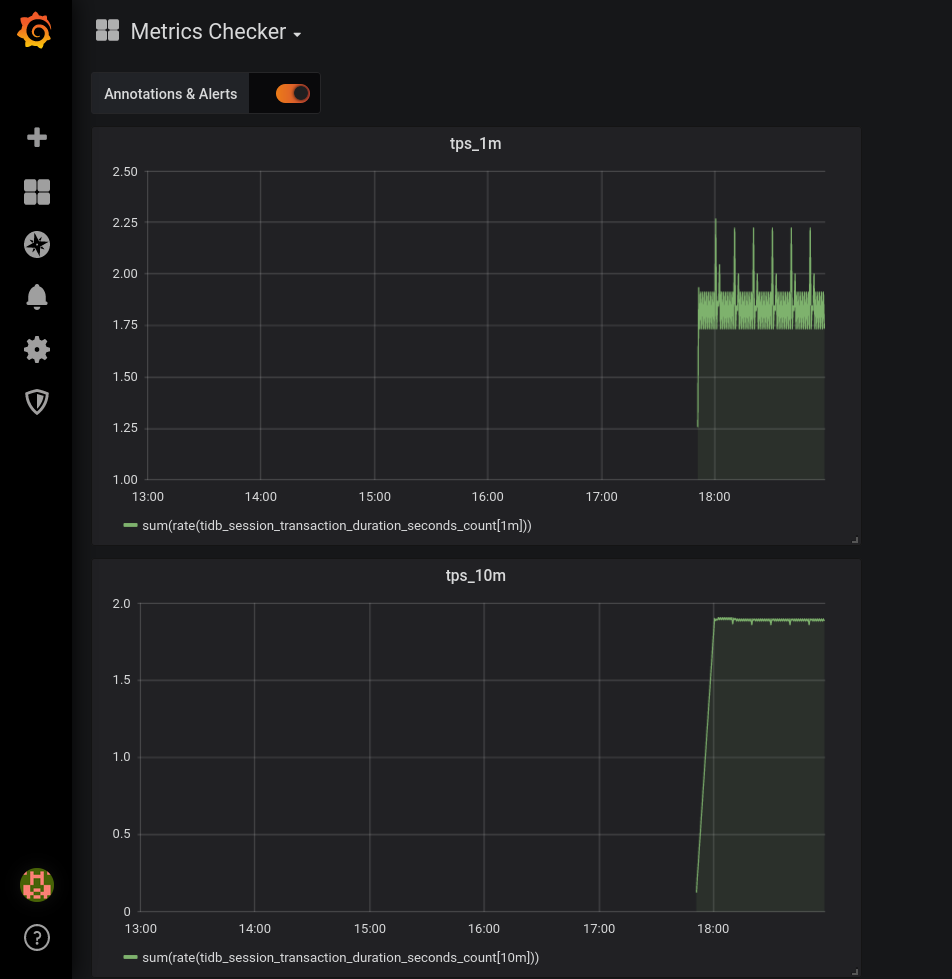
  tps_1m: sum(rate(tidb_session_transaction_duration_seconds_count[1m]))
  tps_10m: sum(rate(tidb_session_transaction_duration_seconds_count[10m]))
Specify grafana api address with --grafana flag, metrics-checker will create a dashboard named "Metrics Checker".
./metrics-checker --address 127.0.0.1:9090 --grafana 127.0.0.1:3000Examples are in config_examples directory.
Config can also passed by base64 string, make it easier to use in some conditions, like in a container image.
./metrics-checker --config-base64 c3RhcnQtYWZ0ZXI6IDEwMHMKaW50ZXJ2YWw6IDEwcwpydWxlczogICAgIyDlr7kgcHJvbWV0aGV1cyBhcGkg55qEIHF1ZXJ5CiAgICAtIHRhZzogdHBzCiAgICAgIHByb21xbDogc3VtKHJhdGUodGlkYl9zZXNzaW9uX3RyYW5zYWN0aW9uX2R1cmF0aW9uX3NlY29uZHNfY291bnRbMW1dKSkgPiBib29sIDIvMyAqIHN1bShyYXRlKHRpZGJfc2Vzc2lvbl90cmFuc2FjdGlvbl9kdXJhdGlvbl9zZWNvbmRzX2NvdW50WzVtXSkpCg==
# output:
# ...
# 2021/01/26 09:58:37 Load config from base64 string
# 2021/01/26 09:58:37 Start checking metrics after 1m40s