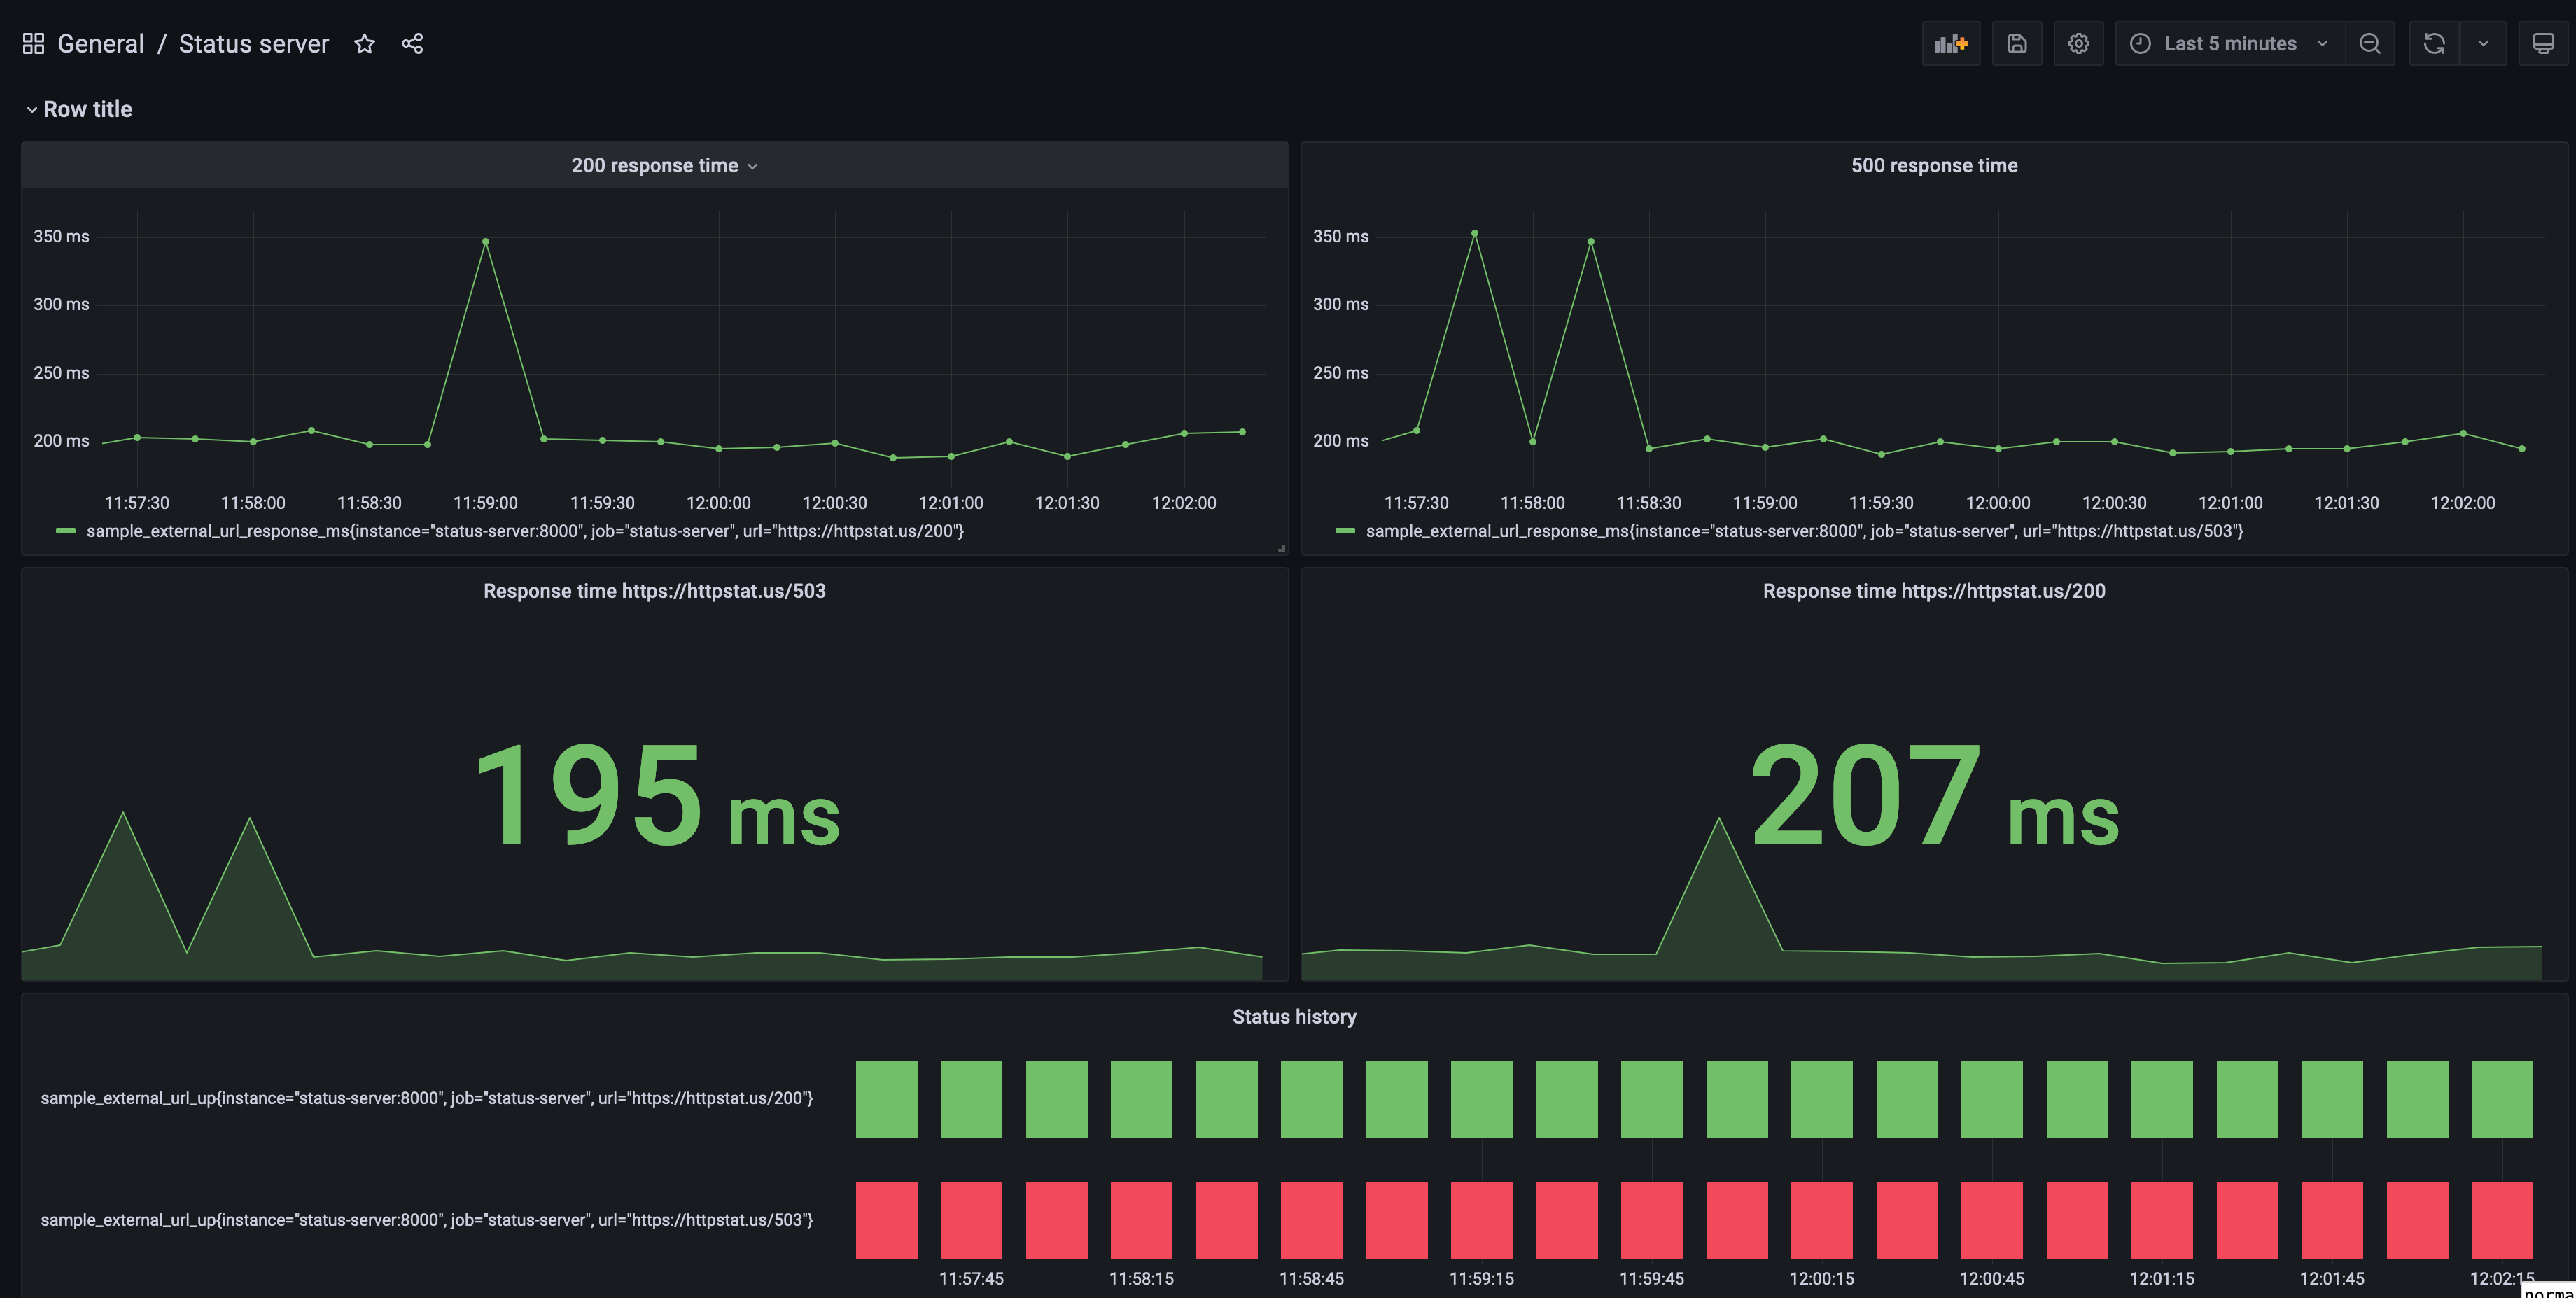
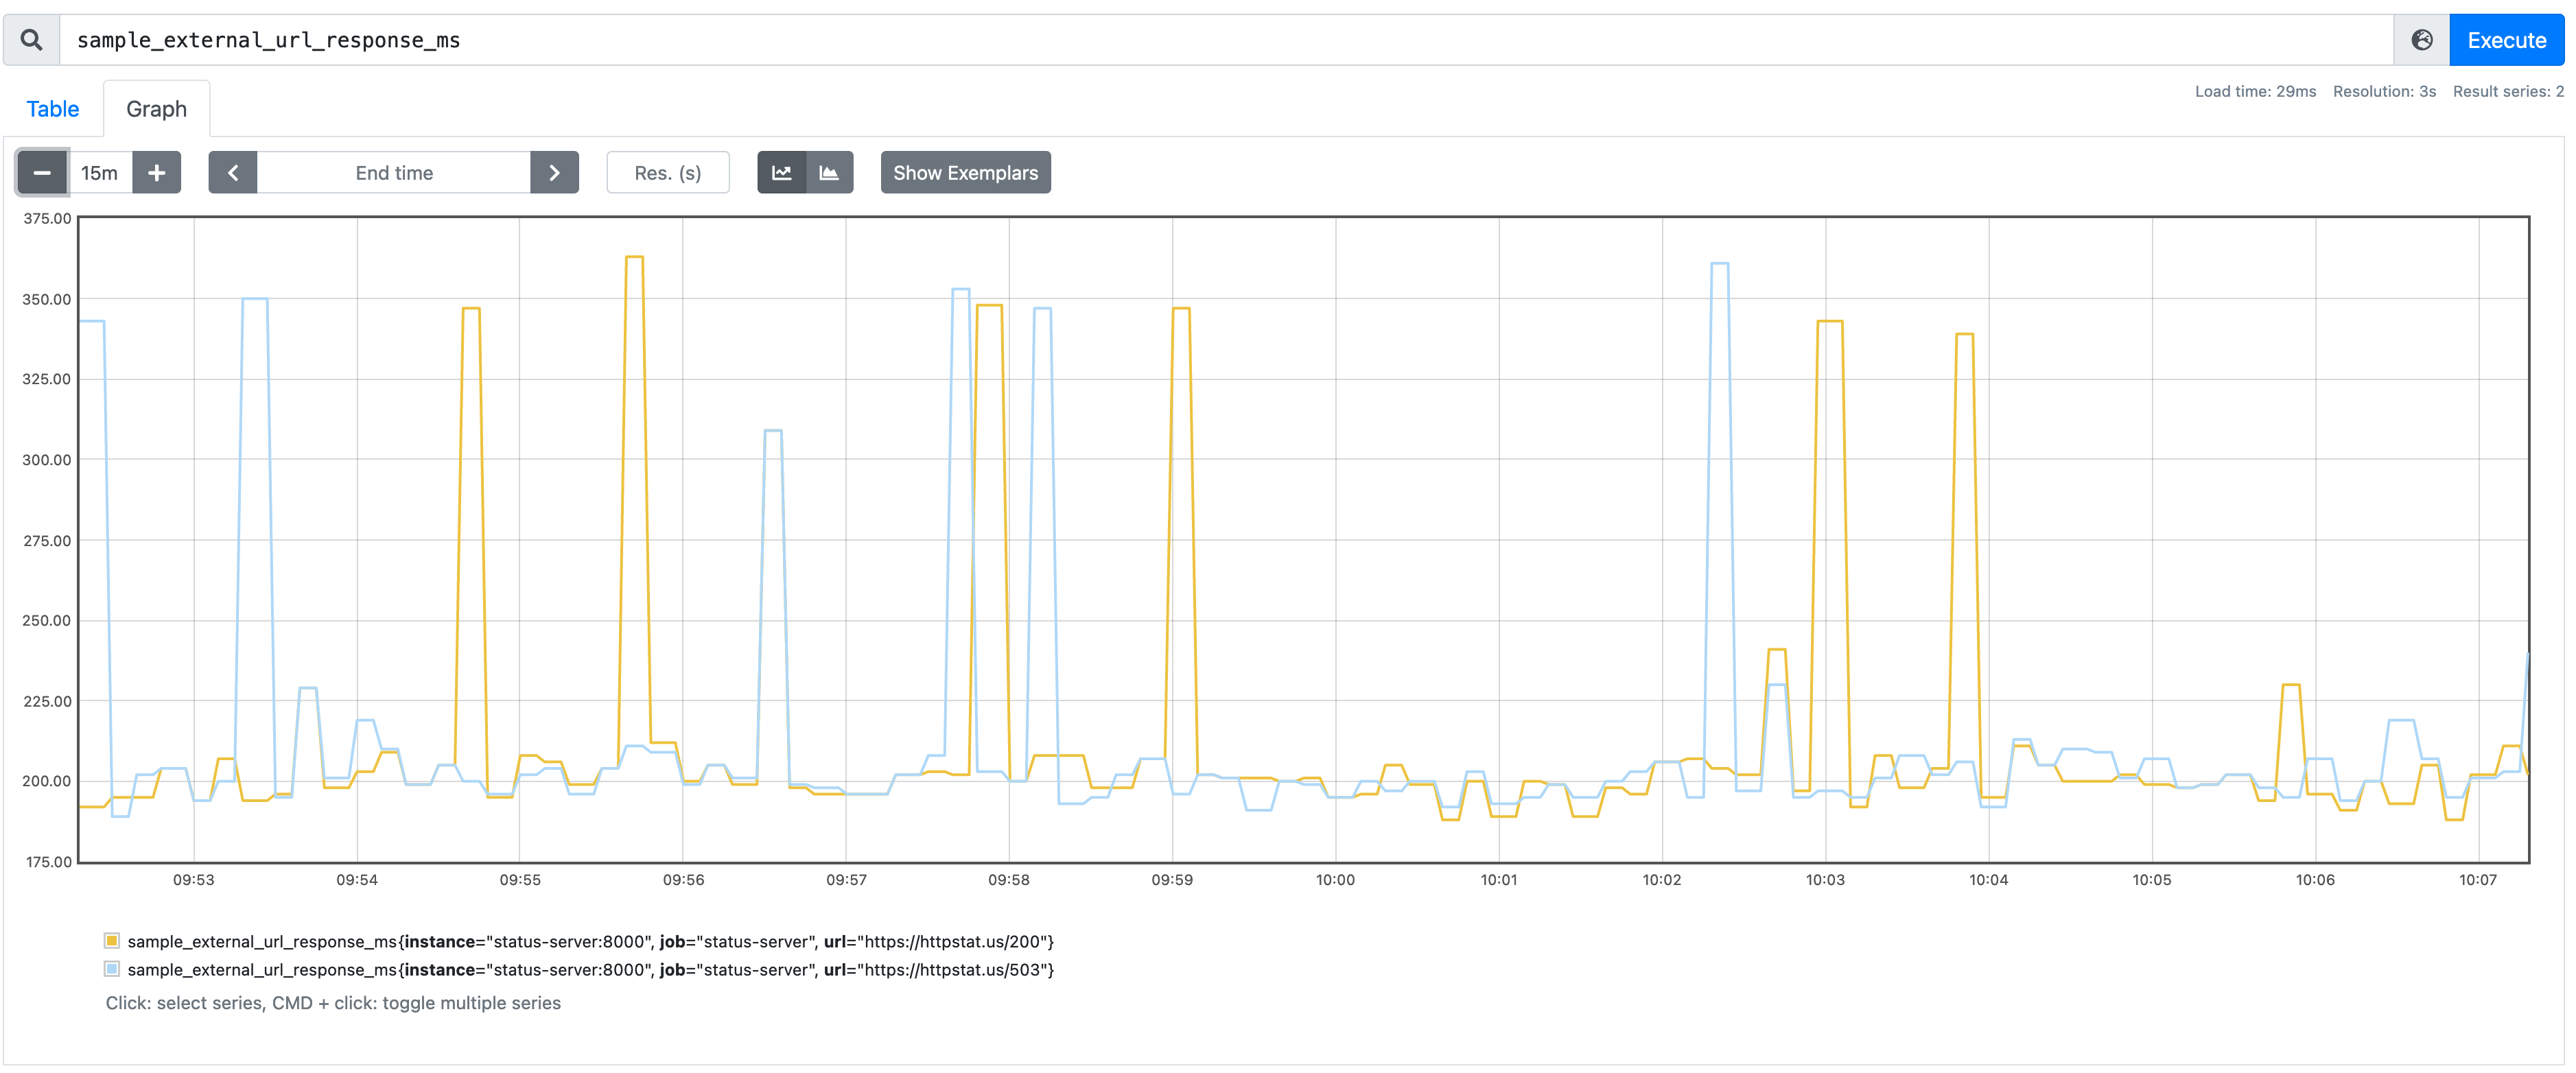
Monitor endpoints and expose Prometheus metrics. For now it only supports checking 2 endpoints:
Prometheus endpoint is exposed in /metrics. Exposed metrics are:
sample_external_url_upsample_external_url_response_ms
By default status-server add one label to each metric:
url
In order to build status-server execute:
$ make buildThe outcome binary can be found as _output/status-server
In order to build docker image run:
$ make build-dockerDefault value of the image is status-sever:latest. It can be modified be setting environment variable IMAGE, e.g:
$ IMAGE=docker.io/my-repo/status-server:v0.0.1 make build-dockerstatus-server accepts two command lines arguments:
-interval- which accepts a duration between consecutive checks. It accepts string which will be parsed as GO'stime.Duration, e.g.100msor10s. Valid time units are "ns", "us" (or "µs"), "ms", "s", "m", "h". Defaults to1s.-port- TCP port that the server will accept requests. By default8000.
So to run status-server that listens on port 7000 and check urls every 10s run:
$ _output/status-server -interval 10s -port 7000or as docker container:
$ docker run -it -p 7000:7000 -_name status-server status-server -port 7000 -interval 10sAnd to validate it is working run:
$ curl localhost:7000/metricsIt should return such response:
# HELP sample_external_url_response_ms Response time in ms
# TYPE sample_external_url_response_ms gauge
sample_external_url_response_ms{url="https://httpstat.us/200"} 384
sample_external_url_response_ms{url="https://httpstat.us/503"} 396
# HELP sample_external_url_up Whether service is up or down
# TYPE sample_external_url_up gauge
sample_external_url_up{url="https://httpstat.us/200"} 1
sample_external_url_up{url="https://httpstat.us/503"} 0
To run unit tests execute:
$ make testsIn kubernetes directory, one can find kustomization file, deployment and service manifest to deploy status-server to Kubernetes.
Before deploying make sure the images section of kustomization.yaml file is edited to point to docker registry where status-server image is present.
To deploy in other namespace than default change namespace section of kustomization.yaml file.
To install status-server to Kubernetes, execute:
$ kubectl apply -k kubernetesI have prepared scripts to deploy Grafana, Prometheus and status-server locally, to be able to test integration between status-server and Prometheus.
The script hack/setup_stack.sh is building status-server docker image, creating docker network and running Prometheus, Grafana and status-server as docker containers in this network. To deploy it execute:
$ hack/setup_stack.shAccessing services:
localhost:3000- Grafana, logging in requires to type usernameadminand passwordadmin, Grafana is already configured to connect to Prometheus and has one default dashboard calledStatus serverlocalhost:9090- Prometheus UI, which is already configured to scrapestatus-serverevery10s
To clean up run hack/teardown_stack.sh script which will remove all docker containers and docker network.


