Integrate all single cell rank-based gene set enrichment analysis and easy to visualize the results.
For more details, please view irGSEA And you can view Chinese tutorial ## Installation
# install packages from CRAN
cran.packages <- c("msigdbr", "dplyr", "purrr", "stringr","magrittr",
                   "RobustRankAggreg", "tibble", "reshape2", "ggsci",
                   "tidyr", "aplot", "ggfun", "ggplotify", "ggridges",
                   "gghalves", "Seurat", "SeuratObject", "methods",
                   "devtools", "BiocManager","data.table","doParallel",
                   "doRNG")
if (!requireNamespace(cran.packages, quietly = TRUE)) {
    install.packages(cran.packages, ask = F, update = F)
}

# install packages from Bioconductor
bioconductor.packages <- c("GSEABase", "AUCell", "SummarizedExperiment",
                           "singscore", "GSVA", "ComplexHeatmap", "ggtree",
                           "Nebulosa")
if (!requireNamespace(bioconductor.packages, quietly = TRUE)) {
    BiocManager::install(bioconductor.packages, ask = F, update = F)
}

if (!requireNamespace("UCell", quietly = TRUE)) {
    devtools::install_github("carmonalab/UCell")
}
if (!requireNamespace("irGSEA", quietly = TRUE)) {
    devtools::install_github("chuiqin/irGSEA")
}
load PBMC dataset by R package SeuratData
# devtools::install_github('satijalab/seurat-data')
library(SeuratData)
# view all available datasets
View(AvailableData())
# download 3k PBMCs from 10X Genomics
InstallData("pbmc3k")
# the details of pbmc3k.final
?pbmc3k.finallibrary(Seurat)
library(SeuratData)
# loading dataset
data("pbmc3k.final")
pbmc3k.final <- UpdateSeuratObject(pbmc3k.final)
# plot
DimPlot(pbmc3k.final, reduction = "umap",
group.by = "seurat_annotations",label = T) + NoLegend()# set cluster to idents
Idents(pbmc3k.final) <- pbmc3k.final$seurat_annotationslibrary(UCell)
library(irGSEA)calculate enrichment scores, return a Seurat object including these score matrix
AUcell or ssGSEA will run for a long time if there are lots of genes or cells. Thus, It’s recommended to keep high quality genes or cells.
Error (Valid ‘mctype’: ‘snow’ or ‘doMC’) occurs when ncore > 1 : please ensure the version of AUCell >= 1.14 or set ncore = 1.
It can be ignore when warnning occurs as follow: 1. closing unused connection 3 (localhost) 2. Using ‘dgCMatrix’ objects as input is still in an experimental stage. 3. xxx genes with constant expression values throuhgout the samples. 4. Some gene sets have size one. Consider setting ‘min.sz’ > 1.
pbmc3k.final <- irGSEA.score(object = pbmc3k.final, assay = "RNA",
                             slot = "data", seeds = 123, ncores = 1,
                             min.cells = 3, min.feature = 0,
                             custom = F, geneset = NULL, msigdb = T,
                             species = "Homo sapiens", category = "H",
                             subcategory = NULL, geneid = "symbol",
                             method = c("AUCell", "UCell", "singscore",
                                        "ssgsea"),
                             aucell.MaxRank = NULL, ucell.MaxRank = NULL,
                             kcdf = 'Gaussian')
#> Validating object structure
#> Updating object slots
#> Ensuring keys are in the proper strucutre
#> Ensuring feature names don't have underscores or pipes
#> Object representation is consistent with the most current Seurat version
#> Calculate AUCell scores
#> Warning: Feature names cannot have underscores ('_'), replacing with dashes
#> ('-')

#> Warning: Feature names cannot have underscores ('_'), replacing with dashes
#> ('-')
#> Finish calculate AUCell scores
#> Calculate UCell scores
#> Warning: Feature names cannot have underscores ('_'), replacing with dashes
#> ('-')

#> Warning: Feature names cannot have underscores ('_'), replacing with dashes
#> ('-')
#> Finish calculate UCell scores
#> Calculate singscore scores
#> Warning: Feature names cannot have underscores ('_'), replacing with dashes
#> ('-')

#> Warning: Feature names cannot have underscores ('_'), replacing with dashes
#> ('-')
#> Finish calculate singscore scores
#> Calculate ssgsea scores
#> Warning in .local(expr, gset.idx.list, ...): Using 'dgCMatrix' objects as input
#> is still in an experimental stage.
#> Warning in .filterFeatures(expr, method): 1 genes with constant expression
#> values throuhgout the samples.
#> Warning: Feature names cannot have underscores ('_'), replacing with dashes
#> ('-')

#> Warning: Feature names cannot have underscores ('_'), replacing with dashes
#> ('-')
#> Finish calculate ssgsea scores
Seurat::Assays(pbmc3k.final)
#> [1] "RNA" "AUCell" "UCell" "singscore" "ssgsea"Wlicox test is perform to all enrichment score matrixes and gene sets with adjusted p value < 0.05 are used to integrated through RRA. Among them, Gene sets with p value < 0.05 are statistically significant and common differential in all gene sets enrichment analysis methods. All results are saved in a list.
result.dge <- irGSEA.integrate(object = pbmc3k.final,
                               group.by = "seurat_annotations",
                               metadata = NULL, col.name = NULL,
                               method = c("AUCell","UCell","singscore",
                                          "ssgsea"))
#> Calculate differential gene set : AUCell
#> Calculate differential gene set : UCell
#> Calculate differential gene set : singscore
#> Calculate differential gene set : ssgsea
class(result.dge)
#> [1] "list"Show co-upregulated or co-downregulated gene sets per cluster in RRA
irGSEA.heatmap.plot <- irGSEA.heatmap(object = result.dge,
                                      method = "RRA",
                                      top = 50,
                                      show.geneset = NULL)
irGSEA.heatmap.plotShow co-upregulated or co-downregulated gene sets per cluster in RRA.
If error (argument “caller_env” is missing, with no default) occurs : please uninstall ggtree and run “remotes::install_github(”YuLab-SMU/ggtree”)“.
irGSEA.bubble.plot <- irGSEA.bubble(object = result.dge,
                                    method = "RRA",
                                    top = 50)
irGSEA.bubble.plotShow the intersections of significant gene sets among clusters in RRA
Don’t worry if warning happens : the condition has length > 1 and only the first element will be used. It’s ok.
irGSEA.upset.plot <- irGSEA.upset(object = result.dge,
                                  method = "RRA")
#> Warning in if (as.character(ta_call[[1]]) == "upset_top_annotation") {: the
#> condition has length > 1 and only the first element will be used
irGSEA.upset.plotShow the intersections of significant gene sets among clusters in all methods
irGSEA.barplot.plot <- irGSEA.barplot(object = result.dge,
                                      method = c("AUCell", "UCell", "singscore",
                                                 "ssgsea"))
irGSEA.barplot.plotShow the expression and distribution of special gene sets in special gene set enrichment analysis method
Show the expression and distribution of “HALLMARK-INFLAMMATORY-RESPONSE” in Ucell on UMAP plot.
scatterplot <- irGSEA.density.scatterplot(object = pbmc3k.final,
                             method = "UCell",
                             show.geneset = "HALLMARK-INFLAMMATORY-RESPONSE",
                             reduction = "umap")
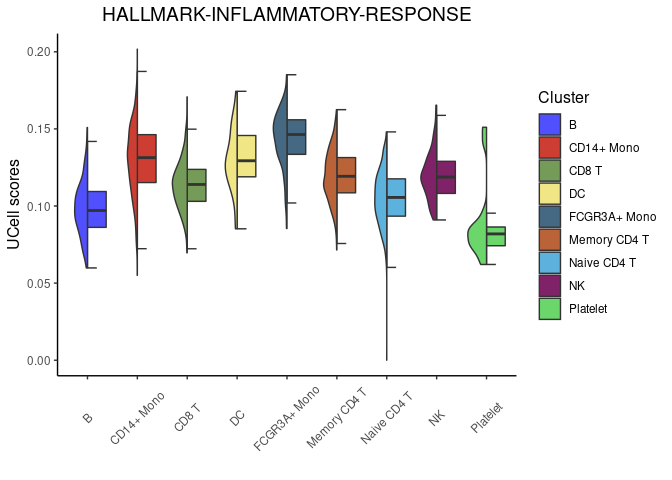
scatterplotShow the expression and distribution of “HALLMARK-INFLAMMATORY-RESPONSE” in Ucell among clusters.
halfvlnplot <- irGSEA.halfvlnplot(object = pbmc3k.final,
                                  method = "UCell",
                                  show.geneset = "HALLMARK-INFLAMMATORY-RESPONSE")
halfvlnplotShow the expression and distribution of “HALLMARK-INFLAMMATORY-RESPONSE” in Ucell among clusters.
ridgeplot <- irGSEA.ridgeplot(object = pbmc3k.final,
                              method = "UCell",
                              show.geneset = "HALLMARK-INFLAMMATORY-RESPONSE")
ridgeplot
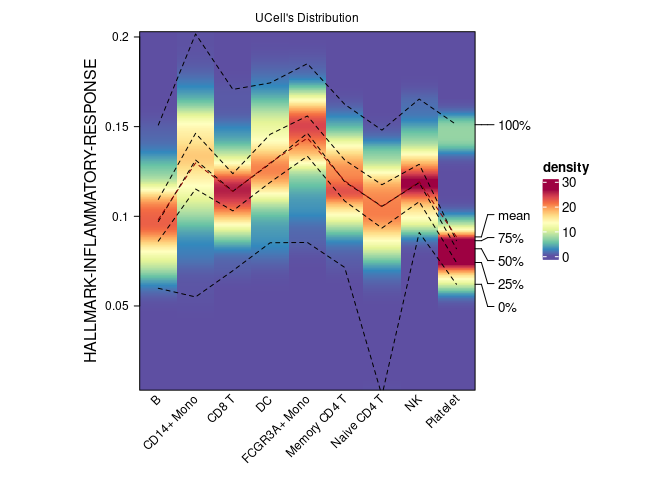
#> Picking joint bandwidth of 0.00533Show the expression and distribution of “HALLMARK-INFLAMMATORY-RESPONSE” in Ucell among clusters.
densityheatmap <- irGSEA.densityheatmap(object = pbmc3k.final,
                                        method = "UCell",
                                        show.geneset = "HALLMARK-INFLAMMATORY-RESPONSE")
densityheatmap


