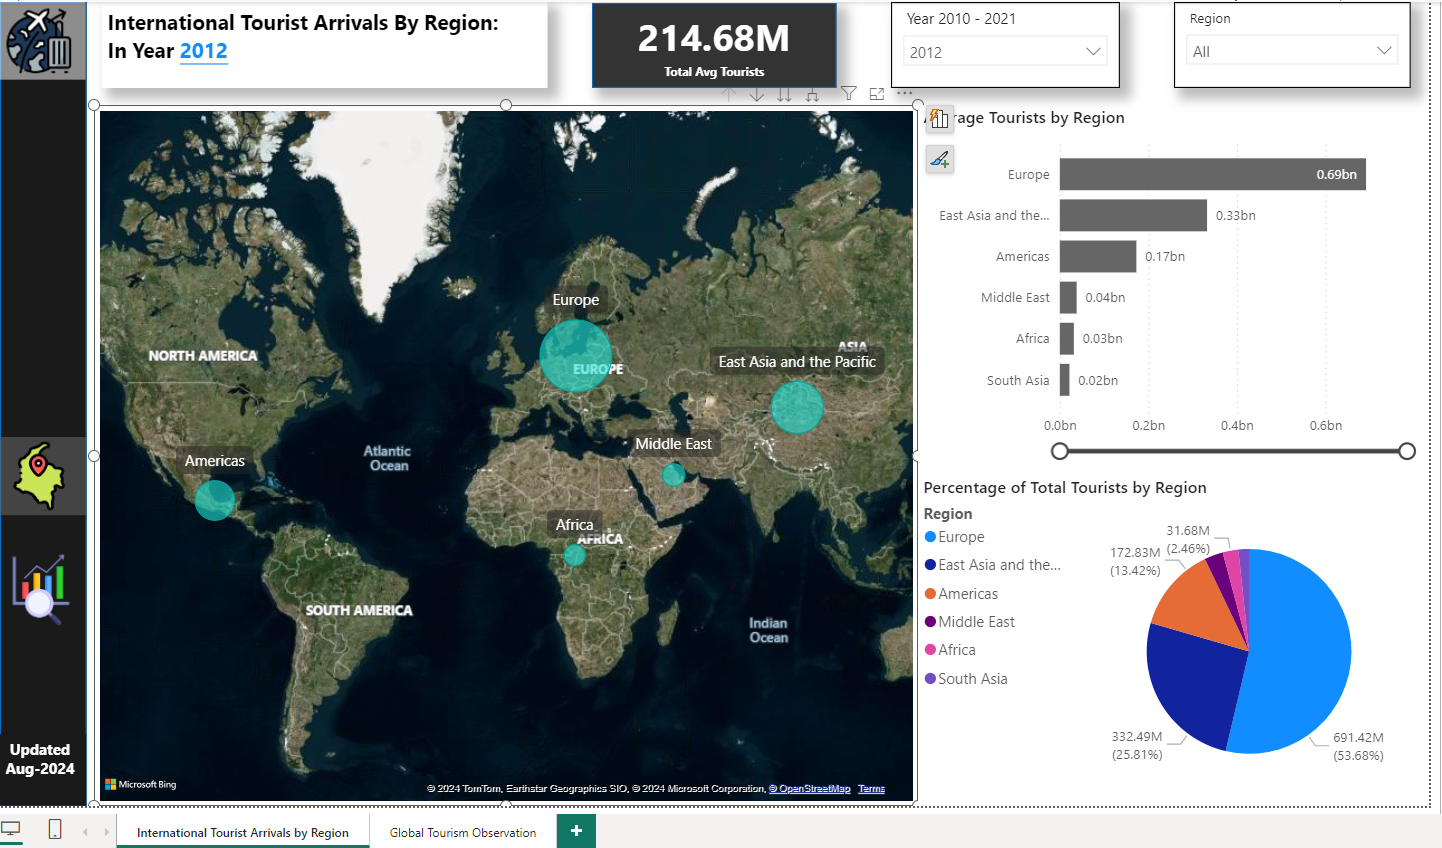
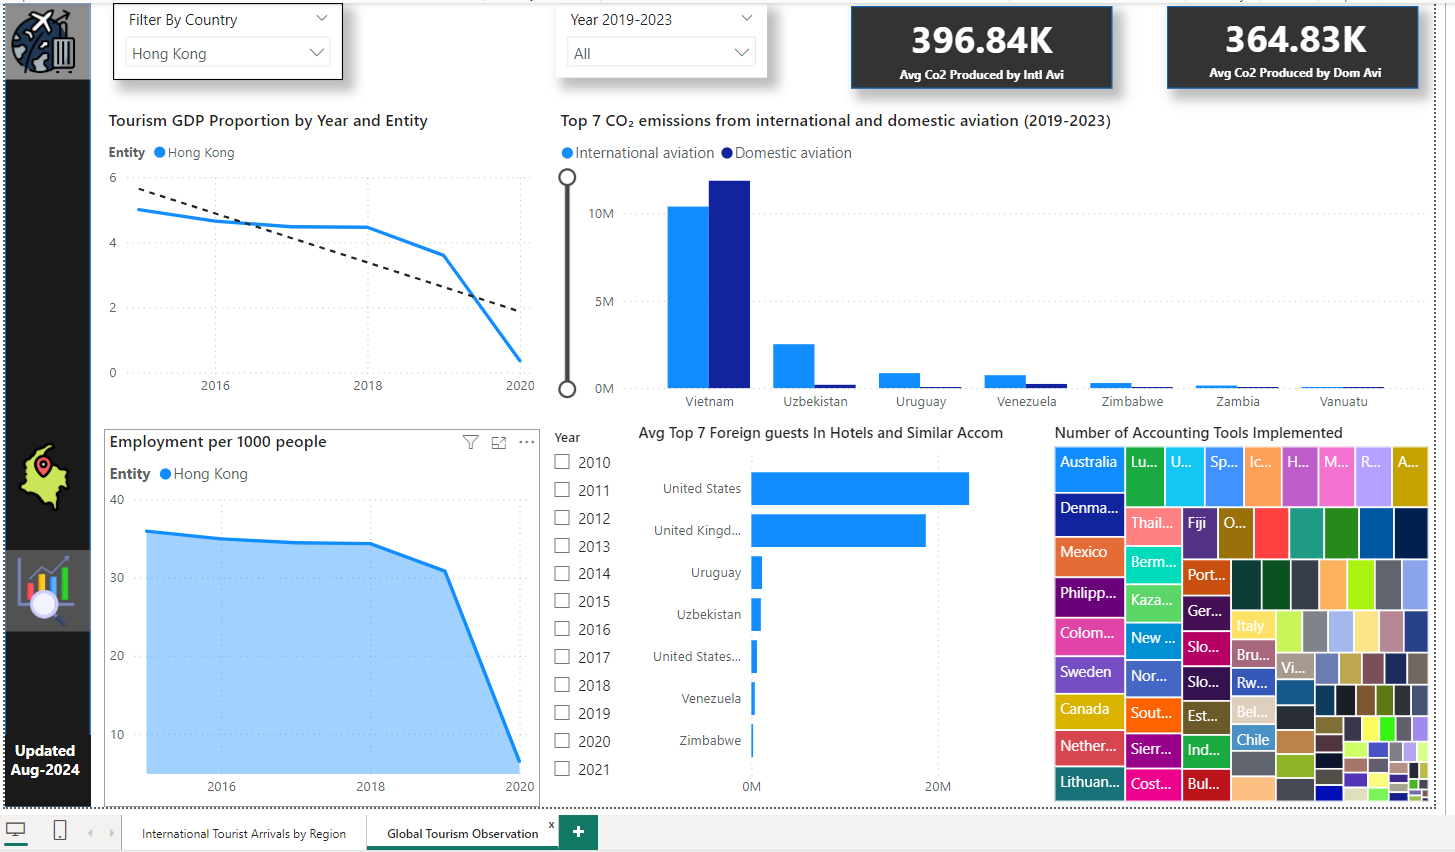
This dashboard provides insights into global tourism trends, economic impacts, and sustainability from 1995 to 2023. By analyzing key metrics such as tourist arrivals, tourism-related GDP, and CO₂ emissions from aviation, the dashboard helps stakeholders make informed decisions to enhance tourism management and promote sustainable practices.
The dataset used for this analysis can be found on Kaggle: Global Tourism Dataset.
- Step 1: Data Collection from multiple sources on Kaggle.
- Step 2: Data Processing - Cleaned and organized the data for analysis.
- Step 3: Data Visualization using Power BI.
- Step 4: Created visuals to represent international tourist arrivals by region, tourism GDP, employment trends, and more.
- Step 5: Incorporated filters and slicers to allow for detailed analysis.
- Step 6: Published the report to Power BI Service for easy access and sharing.
This dashboard can be valuable to a variety of stakeholders in the tourism industry, including:
- Government Agencies: For example, the Ministry of Tourism can use this dashboard to monitor tourism trends and allocate resources to regions with growing tourist numbers.
- Tourism Boards: Organizations like the World Tourism Organization (UNWTO) can utilize this data to understand global tourism patterns and create targeted campaigns for promoting lesser-known destinations.
- Hospitality Industry: A hotel chain like Marriott International could analyze the data to identify key regions where they could expand their operations based on increasing tourist arrivals.
- Airlines and Transport Companies: Airlines like Emirates or transport companies can use insights from the dashboard to optimize flight routes and enhance customer satisfaction in regions with high tourist traffic.
- Environmental Organizations: Non-profits like the WWF can assess the impact of tourism on specific ecosystems and advocate for policies that encourage sustainable tourism.
- Investors and Business Leaders: Venture capitalists and business leaders can use the dashboard to identify high-growth regions for investing in tourism-related ventures.
- Researchers and Academics: Scholars studying the impact of tourism on global economies can use this dashboard to support their research with real-time data and visualizations.
- Insight: Europe remains the top destination with 71.79% of arrivals in 2021, while South Asia accounts for the lowest at 1.84%.
- Insight: A significant drop in tourism GDP was observed globally due to the COVID-19 pandemic.
- Insight: Tourism employment saw a sharp decline post-2019, particularly in Hong Kong.
- Insight: International aviation consistently contributes more to CO₂ emissions compared to domestic flights.
- Insight: The United States leads in the number of foreign guests, reflecting its strong appeal as a global destination.
- Insight: Australia is leading in the adoption of standard accounting tools for sustainable tourism.
- Data Profiling: Ensured the accuracy and consistency of data using Power Query Editor.
- Custom Measures: Created DAX measures to calculate averages and totals for key metrics.
- Interactive Elements: Added slicers and filters to make the dashboard more interactive and user-friendly.
To view the dashboard, visit the Power BI Link.

