Photo by James Wheeler | Free License
Harold's company has just started a new Real Estate Investment division to provide customers with a broader range of portfolio options. Harold was tasked with building a prototype dashboard, and he needs help. The real estate team wants to trial this initial offering with investment opportunities for the Toronto market. If the new service is popular, then they can start to expand to other markets.
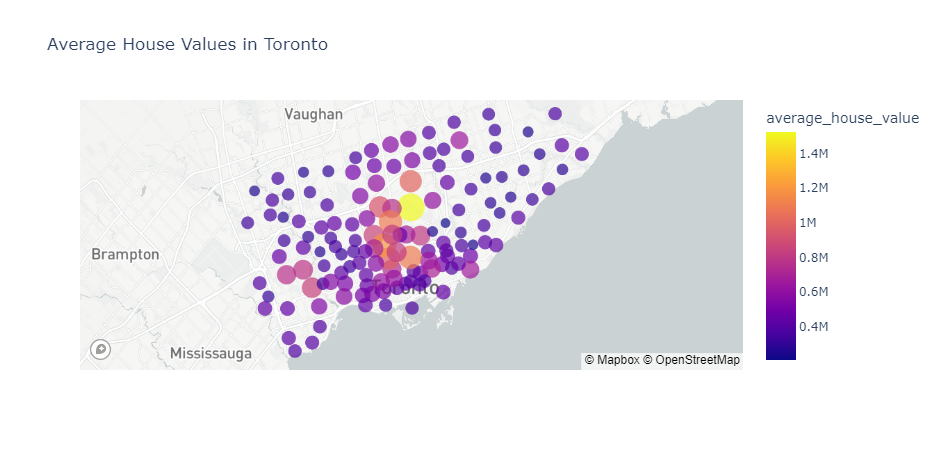
This dashboard's goal is to provide charts, maps, and interactive visualizations that help customers explore the data and determine if they want to invest in rental properties in Toronto.
In this project, helped Harold accomplish the following tasks:
The data provided for project this was retrieved from the following websites:

