This package contains examples of application of Bayesian Global Optimization (BGO) to the identification of minimum energy clusters. The purpose of the code is educational and, I presume, it is quite easy to break it.
The code is developed by the Predictive Science Laboratory (PSL) at Purdue University.
We use the Atomistic Simulations Environment (ASE) module for both the representation of clusters and the computation of their energy. Despite the fact that ASE can serve as an interface to a wide variety of ab initio calculators, we opt for the use of the Effective Medium Theory (EMT) calculator, since it is built in ASE and, therefore, it does not require external, potentially proprietary, software. As a result, do not expect to get the real minimum energies and/or structures. EMT works for the following types of atoms: H, C, N, O, Al, Ni, Cu, Pd, Ag, Pt and Au. It also works with H, C, N and O, but the parameters are wrong.
We give a brief description of what is in each file/folder of this code. For more details, you are advised to look at the extensive comments.
-
binary_molecule_optimization.py: Demonstrates how to use BGO to find the bond length of a binary molecule.
-
cluster_optimization.py: Demonstrates how to use BGO to find the minimum energy structure of an arbitrary cluster.
-
geometry.py: Includes routines that allow the, almost, uniform sampling of clusters given bounds on the distance matrix, i.e., given a minimum and a maximum distance between two arbitrary atoms.
-
plots.py: Includes routines that make the plots you see.
-
pydes: This is a Python module that implements BGO. It will be a separate fully functional module in the near future.
Before trying to use the code, you should install the following dependencies:
There is nothing to install. You can just use the code once you enter the code directory. pydes can be used as an independent python module if you add it to your PYTHONPATH. However, this is not necessary if all you want to do is run the demos.
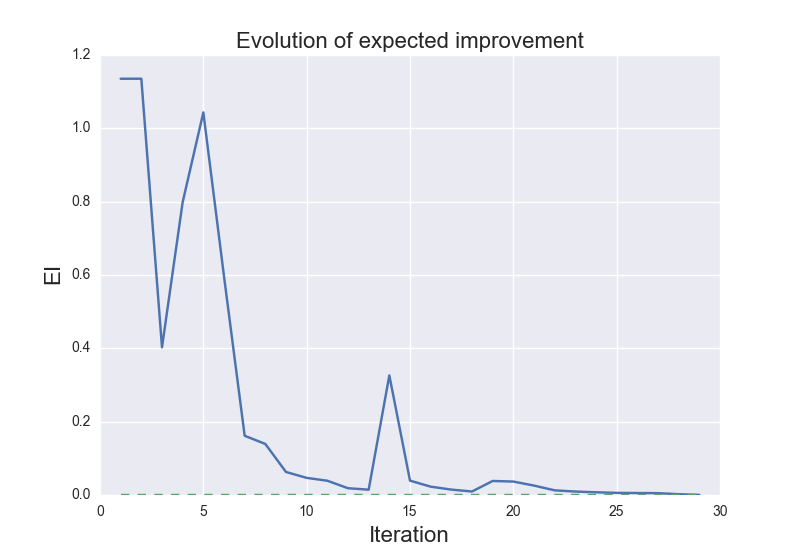
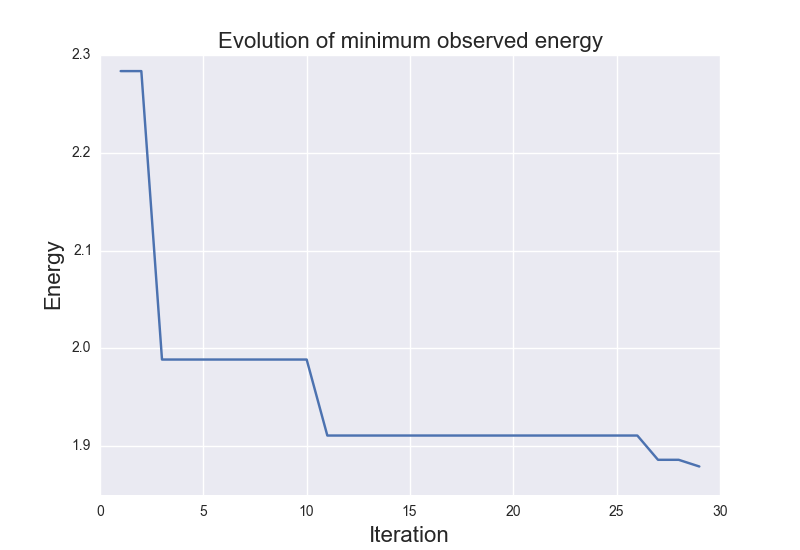
You can run binary_molecule_optimization.py and cluster_optimization.py as usual python scripts. The first one, will create interactive figures. The second one will create figures at the very end.
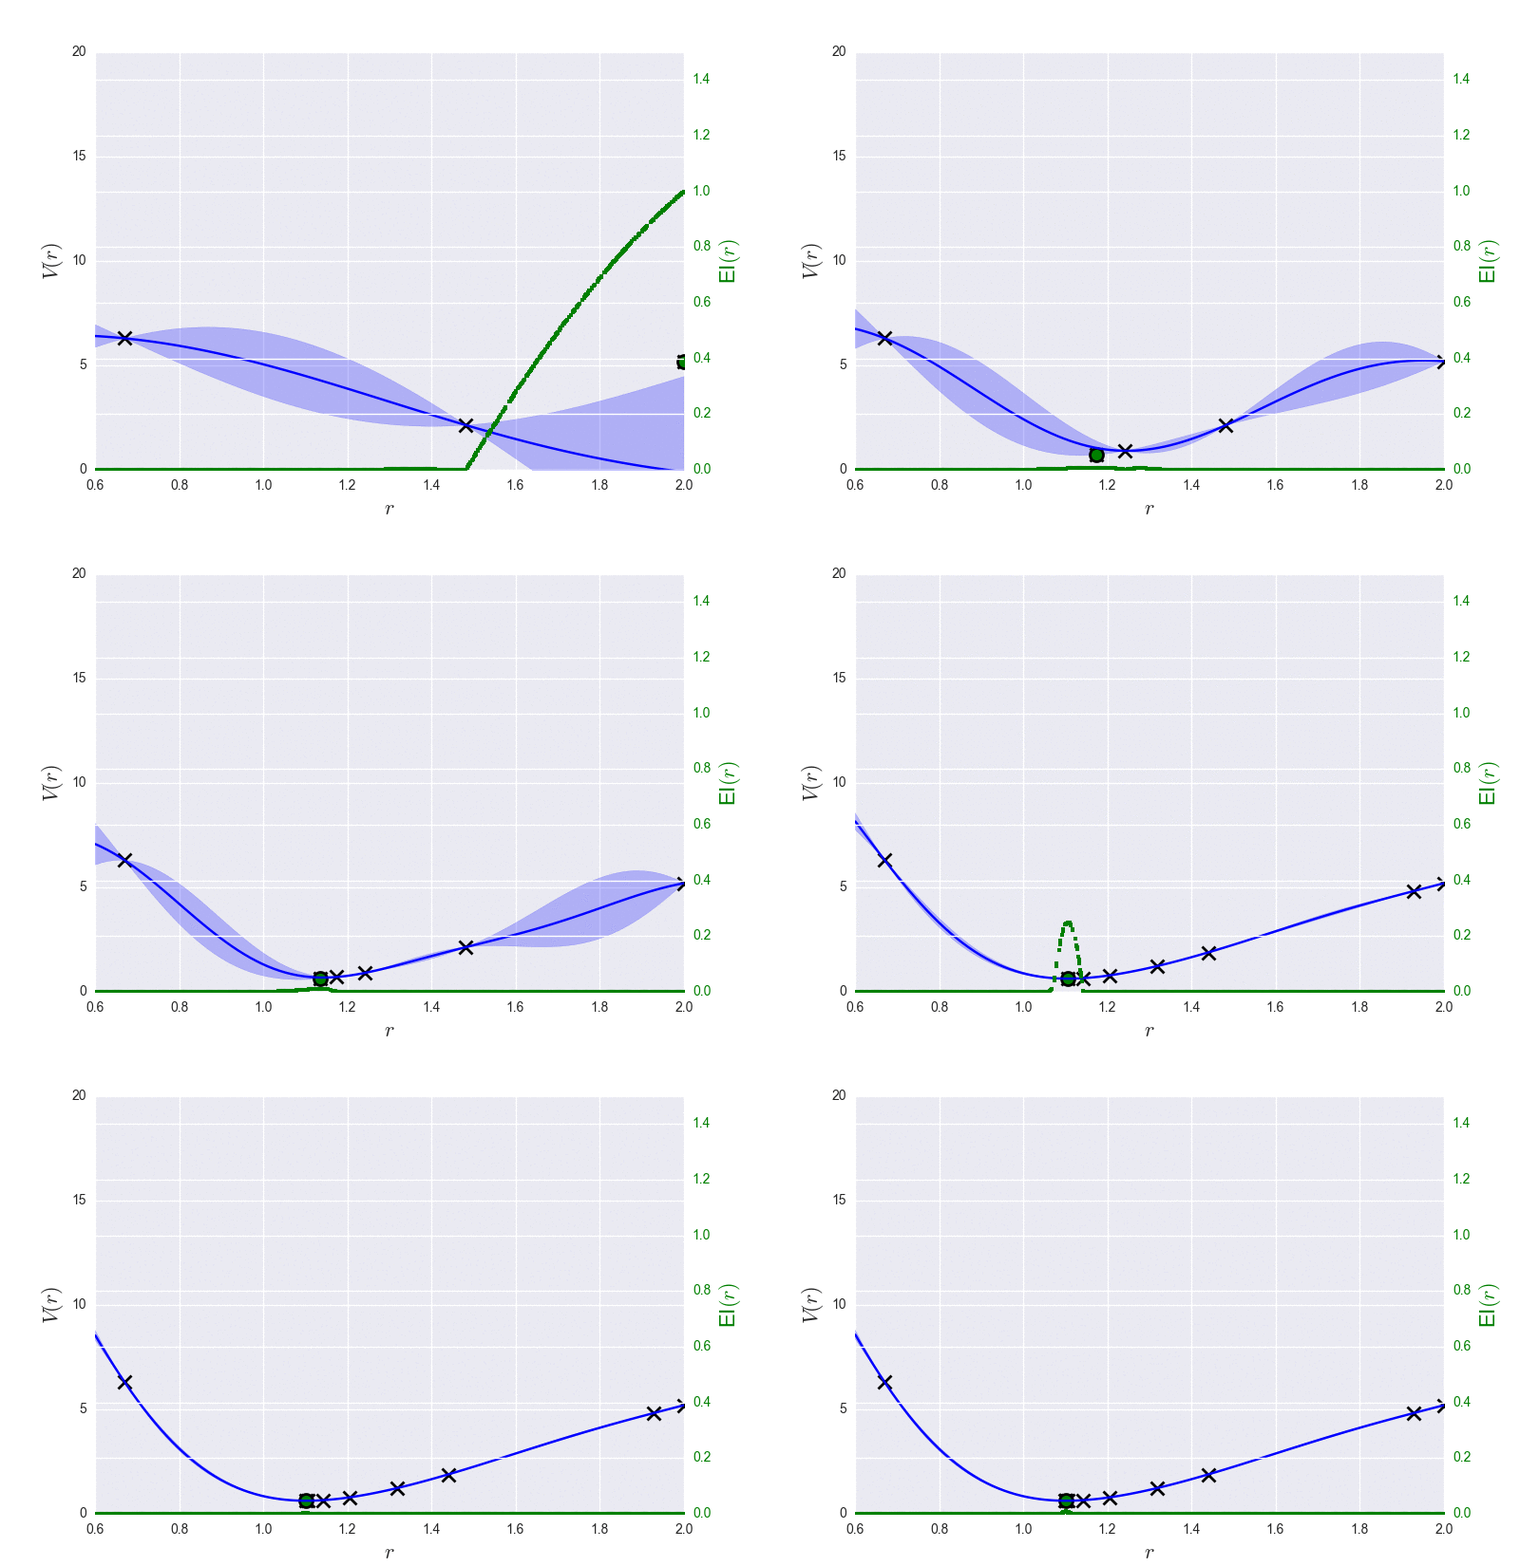
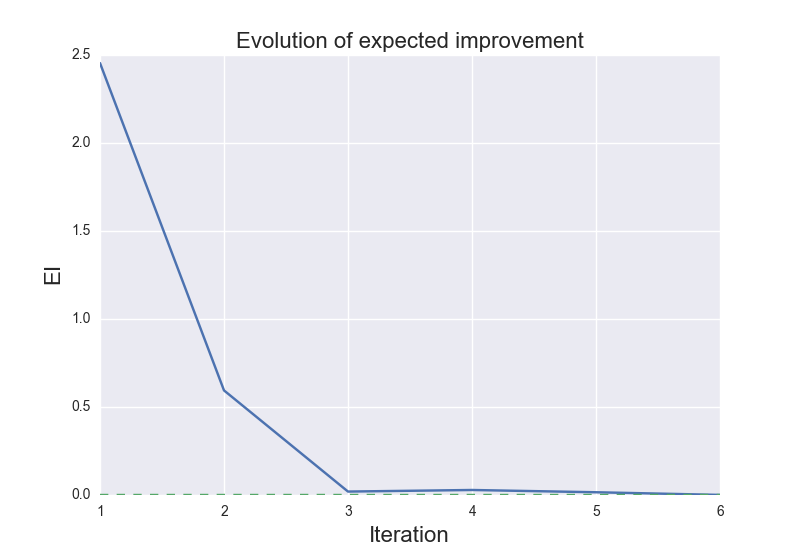
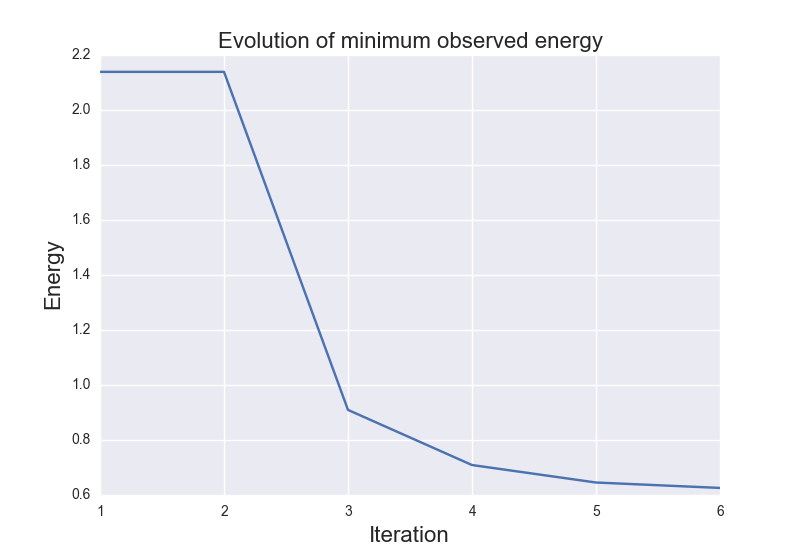
These are the results of binary_molecule_optimization.py when ran it for O2:
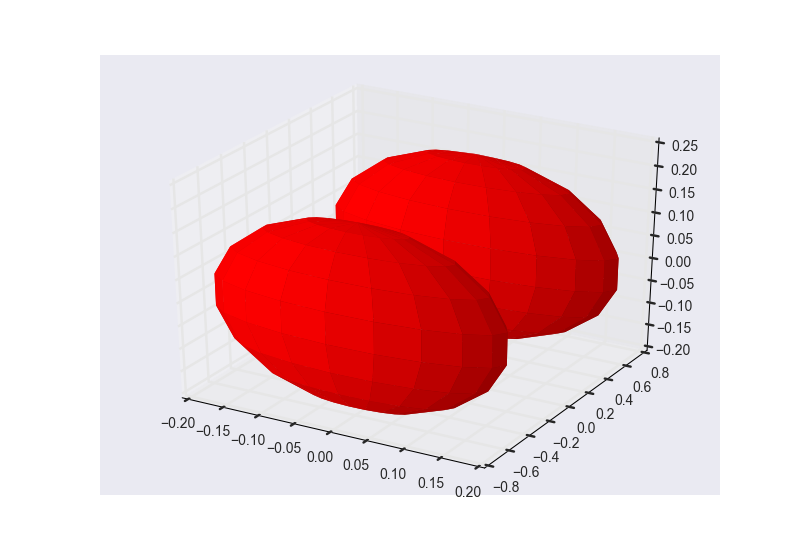
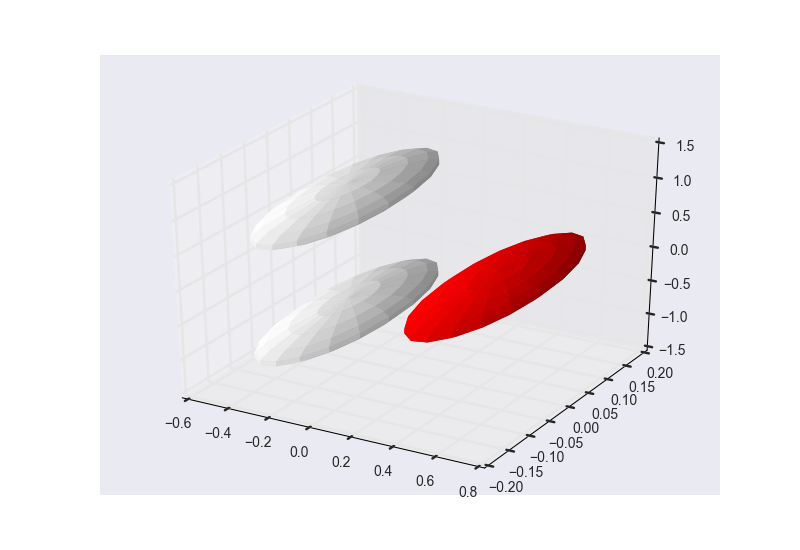
These are the results of cluster_optimization.py when ran for H2O:
