If you like this Docker Swarm Visualizer,
you should also check out the new Visualizer written in Rust.
-
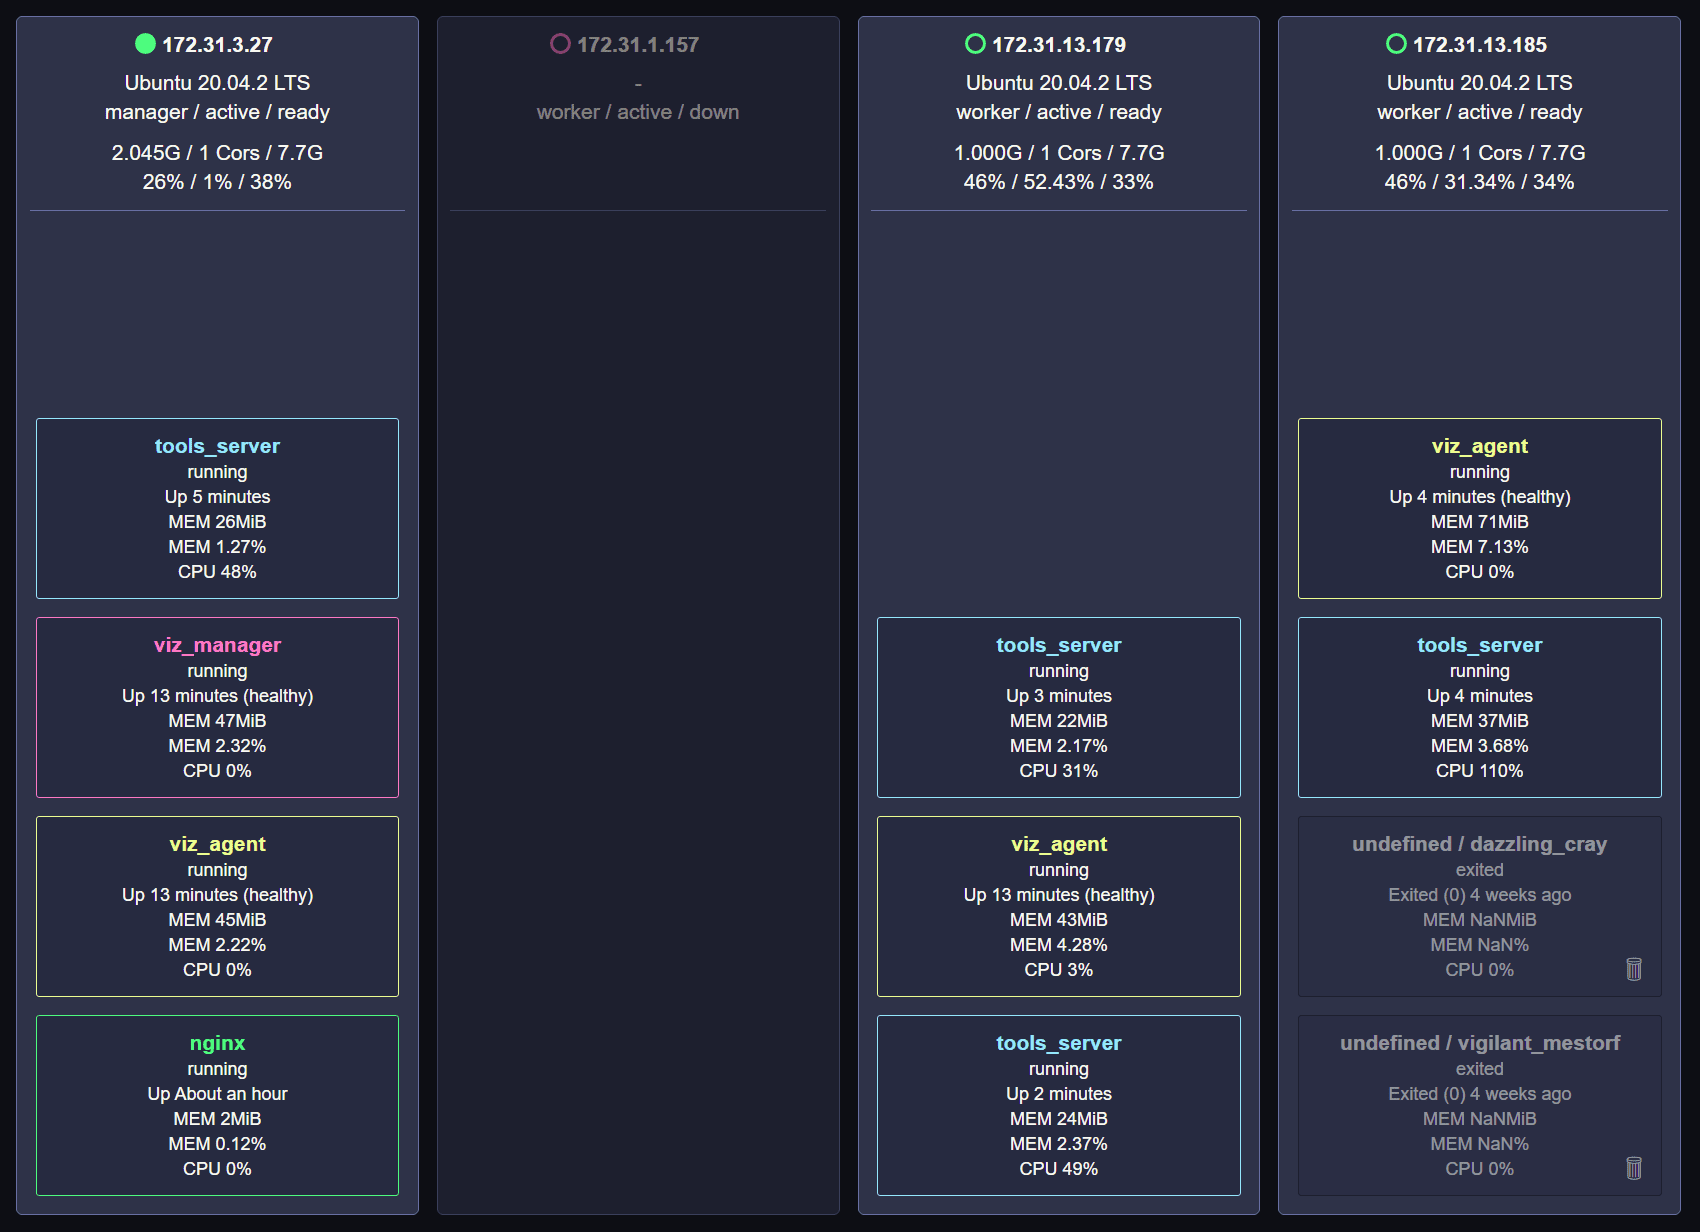
📺 Real-Time Monitoring
Monitor your Swarm Cluster in Real-Time. -
🎚️ Vertical Service Autoscaler (beta)
Automatically scale your services up and down based on CPU usage. -
📦 Automated Image Updates (beta)
Automatically pulls the latest images from your Registry. -
🚀 Drag and Drop Deployment (beta)
Easily deploy Stacks and Secrets via Drag and Drop. -
🧼 Auto Clean your Swarm (in planning)
Remove unused Images and dangling Containers. -
🏷️ Auto Subnet Labeling (beta)
Detects in which subnet your node is to better spread your containers. -
🪝 Webhooks (in planning)
Send useful logs/events to your own servers.
Quick introduction Video on YouTube.
Minimum Docker API = 1.41 (Run docker version to check your API version)
- Make sure you are using docker in swarm mode (
docker swarm init).
# make sure the required ports are open
TCP port 2377 for cluster management communications
TCP and UDP port 7946 for communication among nodes
UDP port 4789 for overlay network traffic -
Make sure you can access your swarm on port 9500/tcp.
-
Make sure the nodes can communicate with each other on port 9501/tcp.
-
Deploy the Visualizer
# Download the Stack File (from GitHub)
curl -L https://git.io/JcGlt -o visualizer.stack.yml

# Deploy the Stack
docker stack deploy -c visualizer.stack.yml visualizer
-
Open the Visualizer Dashboard
http://127.0.0.1:9500orhttp://[NODE_IP]:9500
All tasks are either in Beta or in Development.
Simply click on ⇪ and drag your files (stacks or secrets) into the Square.
To enable and use the autoscaler add the env and labels below to your services:
services:
  manager:
    environment:
      - VISUALIZER_TASK=true
      - VISUALIZER_TASK_AUTOSCALE=true

  agent:
    environment:
      - VISUALIZER_TASK=true
      - VISUALIZER_TASK_AUTOSCALE=true

  your_app:
    labels:
      - visualizer.autoscale.min=1
      - visualizer.autoscale.max=5
      - visualizer.autoscale.up.cpu=0.2
- visualizer.autoscale.down.cpu=0.1For now, you can only update public images from docker hub. I will add support for private images and the GitHub's container registry soon.
To enable and use the auto updates add the env and labels below to your services:
services:
  manager:
    environment:
      - VISUALIZER_TASK=true
      - VISUALIZER_TASK_AUTOUPDATE=true
        # Check for an update every 6th hour (see: https://crontab.guru/)
      - VISUALIZER_TASK_AUTOUPDATE_CRON="0 */6 * * *"

  agent:
    environment:
      - (nothing else to add here)

  your_app:
    labels:
- visualizer.autoupdate=trueTo enable and use the subnet labeling add the env and labels below to your services:
services:
  manager:
    environment:
      - (nothing else to add here)

  agent:
    environment:
      - VISUALIZER_TASK=true
      - VISUALIZER_TASK_SUBNET=true
    labels:
      # Adjust the labels below to your subnet.
      # In this example are 3 subnets in 3 different availability zones, which I call az1, az2 and az3.
      # az1 in subnet 172.31.0.0/20, az2 in 172.31.16.0/20 and az3 in 172.31.32.0/20.
      # You can name your subnets as you want.
      - visualizer.subnet.az1=172.31.0.0/20
      - visualizer.subnet.az2=172.31.16.0/20
      - visualizer.subnet.az3=172.31.32.0/20

      # for testing locally
      - visualizer.subnet.local=192.168.0.0/16

  your_app:
    deploy:
      placement:
        preferences:
          # spread this service out over the "subnet" label
- spread: node.labels.subnetNothing here yet.