🐝 A software for beekeepers that provides scripts for recording data (such as weight or temperature), a powerful REST API for processing it and a dashboard for viewing it.
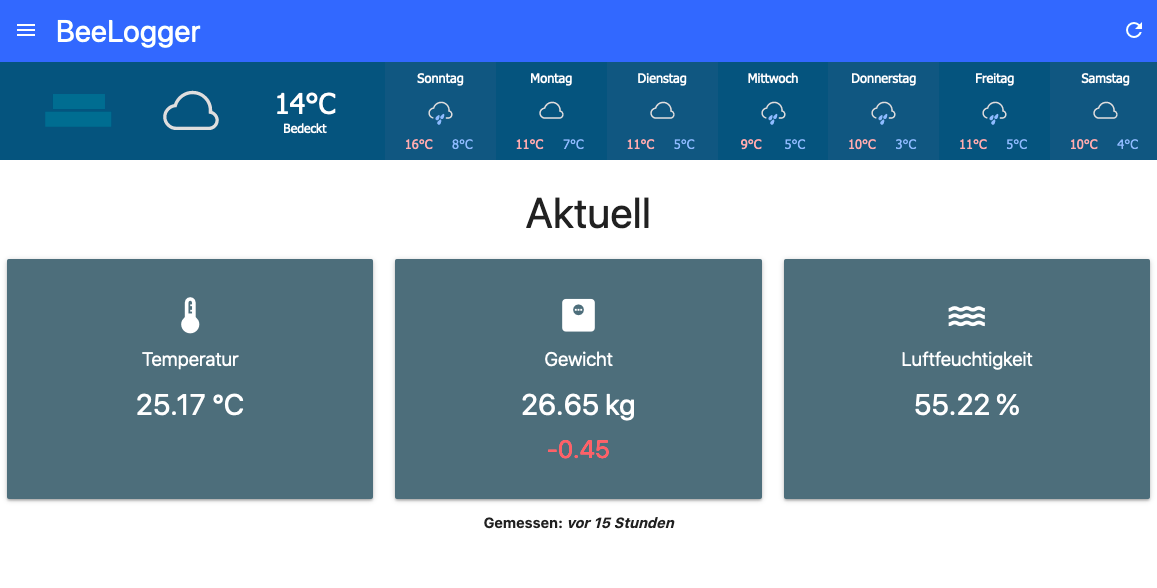
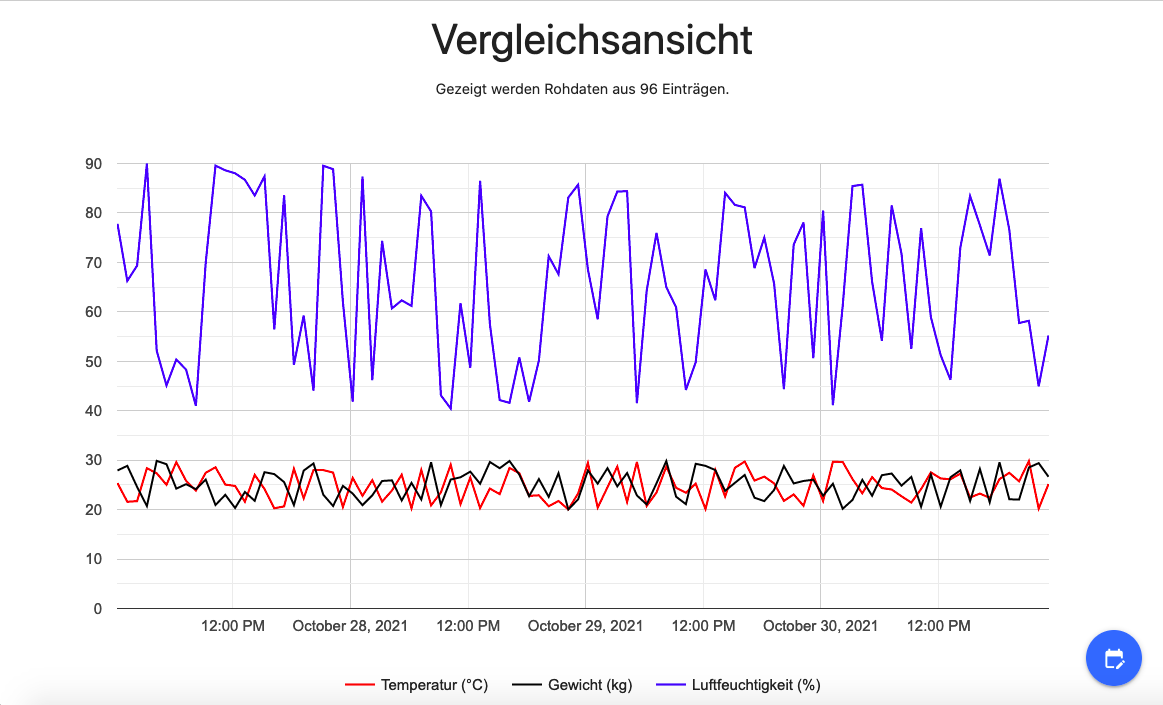
BeeLogger provides a clean web dashboard to view the collected data in a variety of charts and figures.
The data in the screenshots is made up and far from realistic.
See current/recent data at first glance.
There are many different kinds of charts. This is just an example.
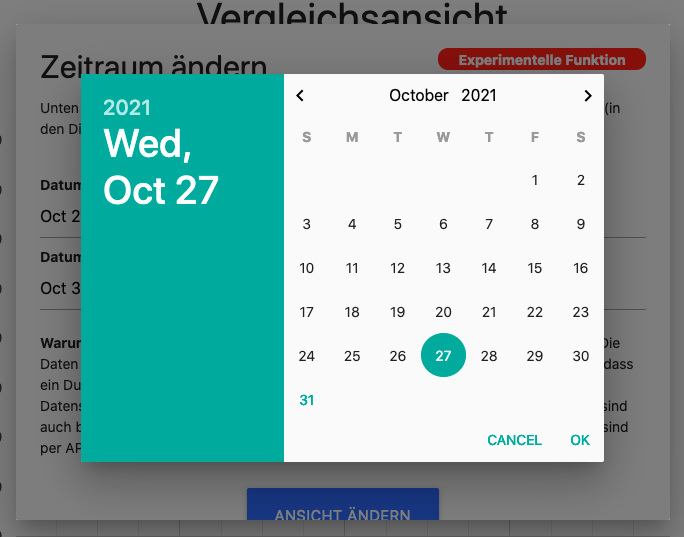
Show data for any date range you like using our custom date pickers.
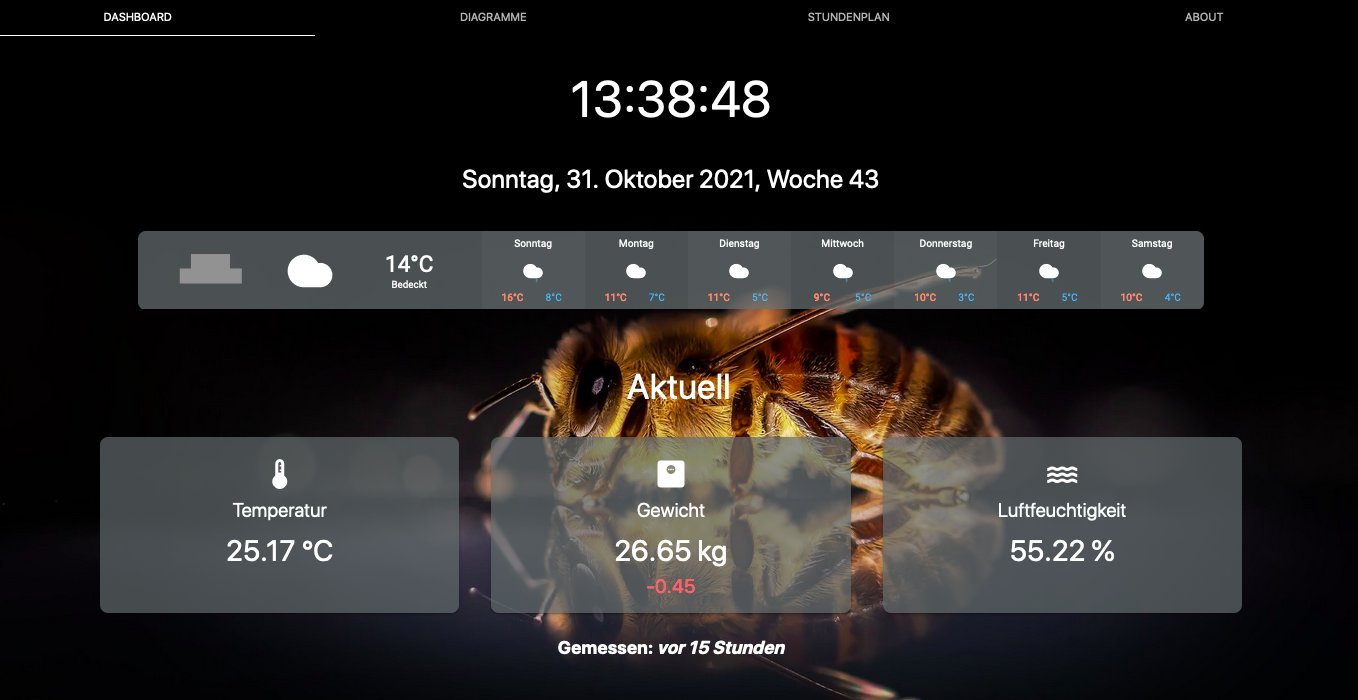
At our school, which is also the origin of this project, we have a touch screen showing some of the collected data in a touchscreen-friendly design. The whole thing is a bit more customizable than the web dashboard and has some other features for students (like timetables). It also provides a (private) gallery of photos that are related to our bee colonies at school.
The data in the screenshots is made up and far from realistic.
Source code and short README here:
chrome-domain-lock/
If you want to secure the kiosk so that it stays on the BeeLogger page, just use the basic plugin for Chrome. Open the background.js file and customize your kiosk URL. Then open the extension-manager and enable developer mode. Then select "load unpacked extension" and open the "Chrome Domain lock" folder, and off you go.
Note that this plugin makes the browser otherwise unusable since it forces to only have a single tab with the set website. It may also be difficult to remove the extension.test
A full guide to both a → Docker (& Docker Compose) and a → non-Docker deployment is available on the corresponding wiki pages.
- Materialize
- Material Icons
- Google Charts
- amCharts weather icons (License CC BY 4.0; file names changed)
- wait-for-it (License MIT)
Copyright (c) 2018-2021 Fabian Reinders, Sönke Klock


