The following work is part of recruitment process as well as science competition, science fair at University. Main task was composed of several steps:
- Implementing a very simple heuristic that will classify the data (doesn't need to be accurate).
- Implementing two simple Machine Learning models, based on Scikit-learn library.
- Implementing a neural network that will classify the data, based on TensorFlow library. Also creating a function that will find a good set of hyperparameters for the NN and plotting training curves for the best hyperparameters.
- Evaluating models - plots or metrics.
- Creating a very simple REST API that will serve models; it should allow users to choose a model and take all necessary input features and return a prediction.
- (Optional) Creating a Docker container image to serve the REST API.
Source of data: https://archive.ics.uci.edu/ml/datasets/Covertype Data was published by Colorado State University in the USA.
Tech stack:
- scikit-learn
- tensorflow/keras
- seaborn
- matplotlib
- pandas
- numpy
- flask
- docker
- pickle
To install one of the above:
pip install <PACKAGE_NAME>
And to check version:
pip show <PACKAGE_NAME>
NOTE: not all functionalities were included into REST API functionality. REST API returns only metrics and predicted value for inserted sample. Plots, hyperparameters and other stuff required in the content of the task is implemented but to see and use that functionalities you need to uncomment drivers below code in every file of each model: ann_model.py, two_ml_models.py, simple_heuristic.py. After that just interpret and later compile every file separately.
Dataset is being stored as covtype.data file, already pre-processed, ready to work with.
Describe types of forest cover - divided into 7 categories. Beyond that there are also 54 columns
describing cartographic variables.
Exact description can be found in covtype.info file attached to project, can be
also found at source path.
Basically dataset was downloaded and unpacked from archive, then loaded as pandas dataframe.
Every model loads data separately from others. In some cases I cut the rows of dataset to reduce time
of compiling and be able to work more quickly and efficiently - dataset contains huge numbers of indexes,
more than 500k (Hardware limitations).
The implementation is located in the file simple_heuristic_algorithm.py. According to definition, a heuristic algorithm is an algorithm that does not guarantee finding the optimal solution. It is used in problems where we want to find an approximation of the solution or the computational complexity of such a problem is very high (NP-complexity). The algorithm was written based on trial and error method, empirical approach, and adjusting individual conditions to obtained results. The advantage of such an algorithm is its short execution time.
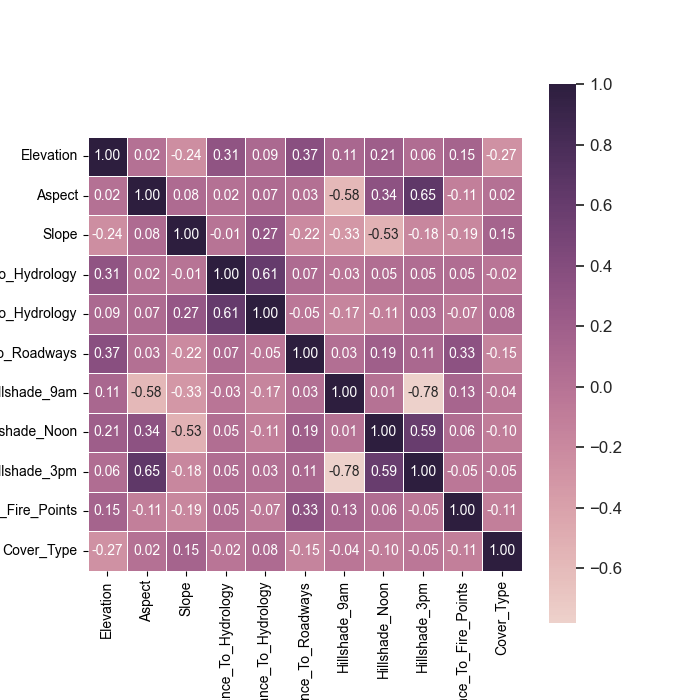
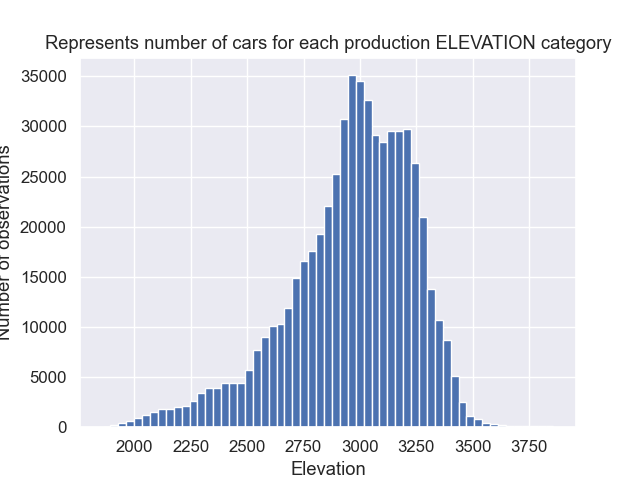
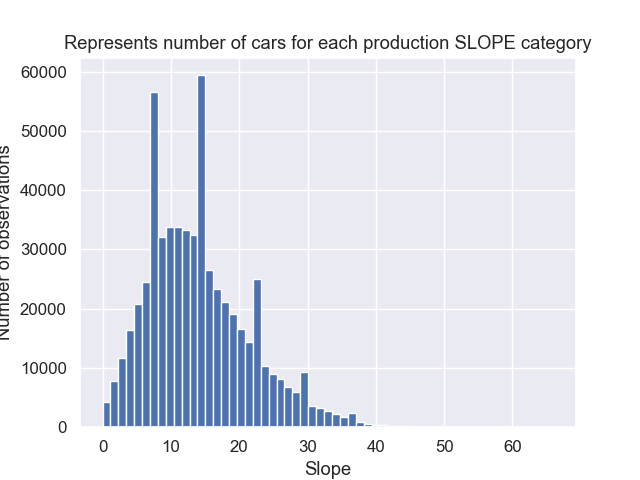
The logic within the if and elif statements compares the values of certain columns in the input row against predefined threshold values, and if the conditions are met, the method returns a corresponding integer prediction value. Logical expressions have been defined based on, among others, histograms and correlation matrices.
Correlation matrix of picked labels:
Example histograms made:
The obtained metric value of accuracy is 47%. And predicted value is 2 for sample:
sample_row = pd.Series({
    'Elevation': 2800,
    'Slope': 12,
    'Aspect': 220,
    'Hillshade_Noon': 220,
    'Wilderness_Area_3': 1,
    'Horizontal_Distance_To_Hydrology': 120,
    'Hillshade_9am': 160
})
In this task, I chose two machine learning algorithms used for data classification, namely logistic regression and random forest, both of which are located in the file two_ml_models.py. I have previously tested other algorithms such as Naive-Bayes or SVM, however, LR and RF proved to be better. The data has been scaled to standardize the feature values, thereby avoiding the influence of different measurement units on the analysis results. I used StandardScaler:
self.scaler = StandardScaler()
self.scaler.fit(self.X_train)
self.X_train = self.scaler.transform(self.X_train)
self.X_test = self.scaler.transform(self.X_test)
Which works as follows:
- Computes the mean and standard deviation for each column of the input data.
- For each value in each column, it calculates the value (value-mean)/standard deviation.
- Returns the normalized data.
I've also used sample:
sample_pred = [
    2596, 51, 3, 258, 0, 510, 221, 232, 148, 6279,
    1, 0, 0, 0, 0, 0, 0, 0, 0, 0, 0, 0, 0, 0, 0,
    0, 0, 0, 0, 0, 0, 0, 0, 0, 0, 0, 0, 0, 0, 0,
    0, 0, 1, 0, 0, 0, 0, 0, 0, 0, 0, 0, 0, 0
]
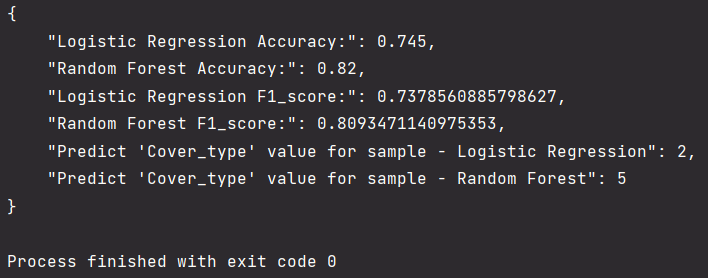
Which predicted value with accuracy and f1_score:
FIXED: pickling and reloading models - https://neptune.ai/blog/saving-trained-model-in-python The neural network architecture consists of three layers:
- Dense layer with hidden_layer_size units and the specified activation function. It takes an input shape of self.X_train.shape[1] which corresponds to the number of features in the training data.
- Dropout layer that randomly drops out a specified dropout_rate fraction of the input units during training to reduce overfitting.
- Another dense layer with 7 units and a softmax activation function. This layer outputs the probability distribution over the 7 output classes.
In addition to scaling, as before, I performed outlier detection using the z-score or IQR method. Z-score method is used to identify and remove any outliers from the dataset. The z-score is calculated by subtracting the mean of the data from each data point, and then dividing by the standard deviation. This gives a measure of how many standard deviations a data point is from the mean of the dataset. Next, a threshold value is set. In this case, it is set to 3, which means that any data point whose z-score is greater than 3 will be considered an outlier and be removed right after.
And IQR method also is could be used to remove outliers. Firstly I calculate the first quartile (Q1) and the third quartile (Q3) of the data. Secondly I conduct calculation of the IQR as the difference between Q3 and Q1, that is, IQR = Q3 - Q1. Next I choose the lower cut-off threshold as Q1 - 1.5 * IQR and the upper cut-off threshold as Q3 + 1.5 * IQR. Finally I remove values from the data that are less than the lower cut-off threshold or greater than the upper cut-off threshold.
def outliers(self):
    # # Interquartile Range (IQR)
    # Q1 = self.data.quantile(0.25)
    # Q3 = self.data.quantile(0.75)
    # IQR = Q3 - Q1
    # data = self.data[~((self.data < (Q1 - 1.5 * IQR)) | (self.data > (Q3 + 1.5 * IQR))).any(axis=1)]

    # Calculate the z-scores of each column - measure that represents the number of standard deviations a data point is from the mean of the dataset
    z_scores = (self.data - self.data.mean()) / self.data.std()
    # Set the threshold for the z-score
    threshold = 3
    # Remove any rows where the z-score is greater than the threshold
    self.data = self.data[(np.abs(z_scores) < threshold).all(axis=1)]
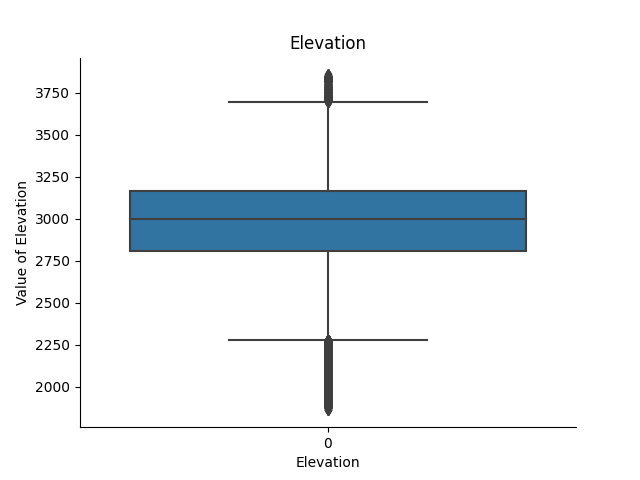
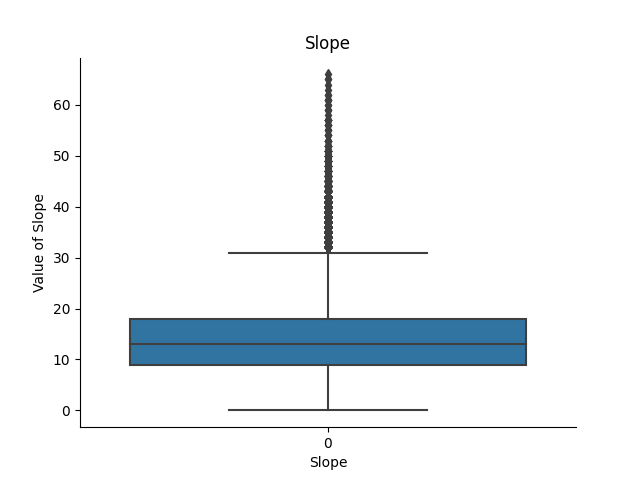
Example boxplots made:
At the end I have implemented function which performs hyperparameter tuning for NN model using random search cross-validation - get_hyperparameters(). So I have declared a dictionary param_grid to specify the hyperparameters to be tuned and their possible values:
param_grid = {
    'hidden_layer_size': [64, 128, 256],
    'activation': ['relu', 'sigmoid'],
    'optimizer': ['adam', 'sgd'],
    'dropout_rate': [0.1, 0.2, 0.3],
    'batch_size': [32, 64, 128],
    'epochs': [5, 10, 20]
 }
At the end the RandomizedSearchCV function performs a randomized search over the dictionary param_grid to find the best combination of hyperparameters for the neural network model.
Results for the best hyperparameters:

Plots training curves for the best hyperparameters:
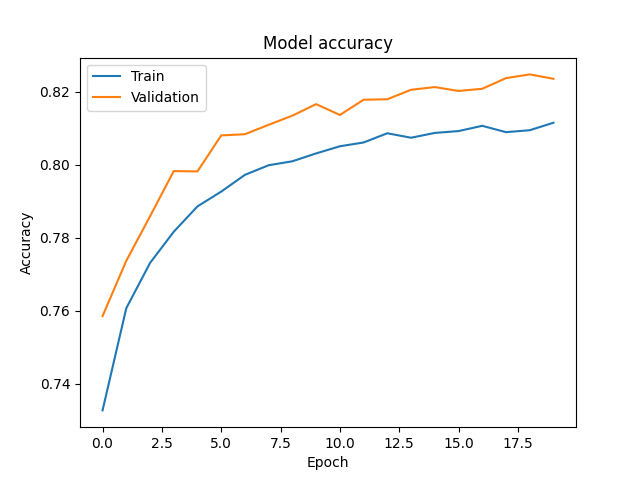
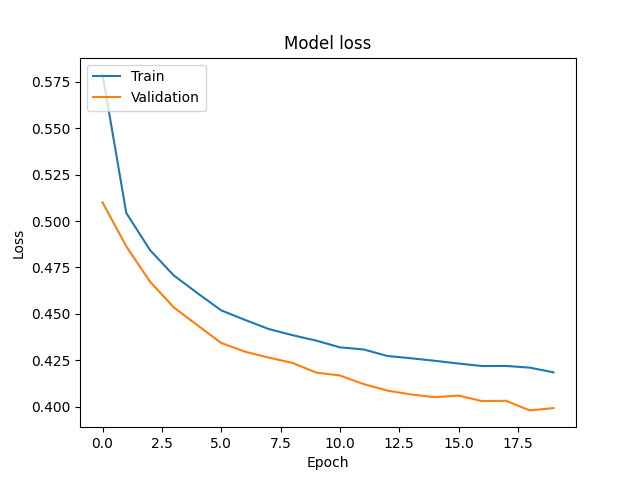
Very good outcomes. The higher the value of accuracy the lower the loss.
Overall model should work fine.
In each section I have described what evaluation I have used, mainly accuracy and f1_score in case of NN, LR and RF. Short description:
- Accuracy is the ratio of the number of correctly predicted instances to the total number of instances.
It is a simple and relatively intuitive metric.
https://en.wikipedia.org/wiki/Accuracy_and_precision - F1 score is a weighted average of precision and recall.
It is a harmonic mean of precision and recall, and it is a better metric when we have an imbalanced dataset.
https://en.wikipedia.org/wiki/Harmonic_mean
https://en.wikipedia.org/wiki/F-score - The main difference between accuracy and F1 score is that accuracy takes into account both true positives and true negatives, while F1 score takes into account both precision and recall.
Rest API is using Flask, I have made simple api_driver.py file to handle api requestes which are being served by
request_driver.py. It could also be send for instance from Postman.
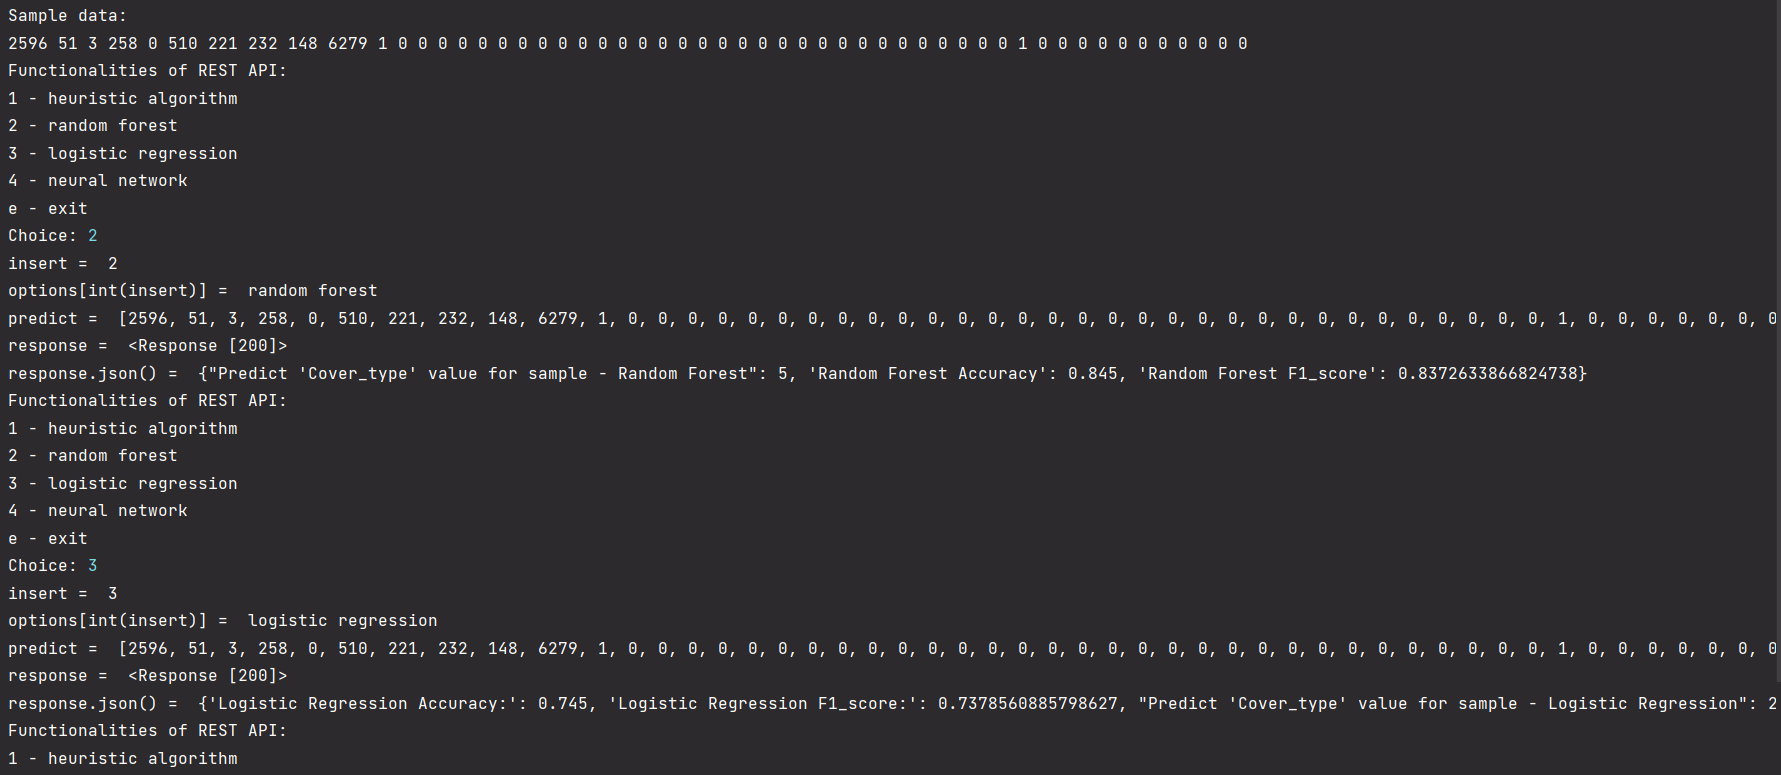
But i have created mentioned script to send requests to REST API, defined in request_driver.py.
Example use case:
Before I could make image based on python:3.10.6-slim and my REST API I have to serialize models. I could not attach them because of GitHub regulations:
emote: error: File serialized_files/model_heuristic.pkl is 487.61 MB; this exceeds GitHub's file size limit of 100.00 MB
remote: error: File serialized_files/model_NN.pkl is 243.80 MB; this exceeds GitHub's file size limit of 100.00 MB
But they can be immediately made just by running serializer.py file. They will appear in serialized_files directory. After that the Dockerfile can be created:
FROM python:3.10.6-slim

WORKDIR /ml-rest-api

COPY requirements.txt .
RUN pip install --no-cache-dir -r requirements.txt

COPY api_driver.py .
COPY serialized_files/model_heuristic.pkl.pkl .
COPY serialized_files/model_RFLR.pkl.pkl .
COPY serialized_files/model_NN.pkl .

CMD ["python", "api_driver.py"]
In short: Setting directory inside container build as instance of this image to /ml-rest-api. Than coping requirements.txt to current directory. Next we install libs defined in text file. Later I'm coping api_driver.py and serialized models to the container. Finally, the "CMD" instruction sets the default command to execute when the container starts. In this case, it runs the api_driver.py file with the Python interpreter.
Next we need to build dockerfile:
docker image build -t <image-name> <path-to-dockerfile>
After that we need to run our container in detached mode and map ports 8000 of container to host port at also 8000. So it runs at http://localhost:8000:
docker container run -d -p 8000:8000 --name=<my-container> <my-image-name>
Finally we can send request using Postman or curl which should look something like this:
curl -X POST -H "Content-Type: application/json" -d '{"option": "'"$option"'", "pred_input": "'"$pred_input"'"}' http://localhost:8000
Szymon Rogowski
Industrial Computer Science / Computational Engineering 3rd year student
AGH University of Science and Technology, Kraków, Poland
