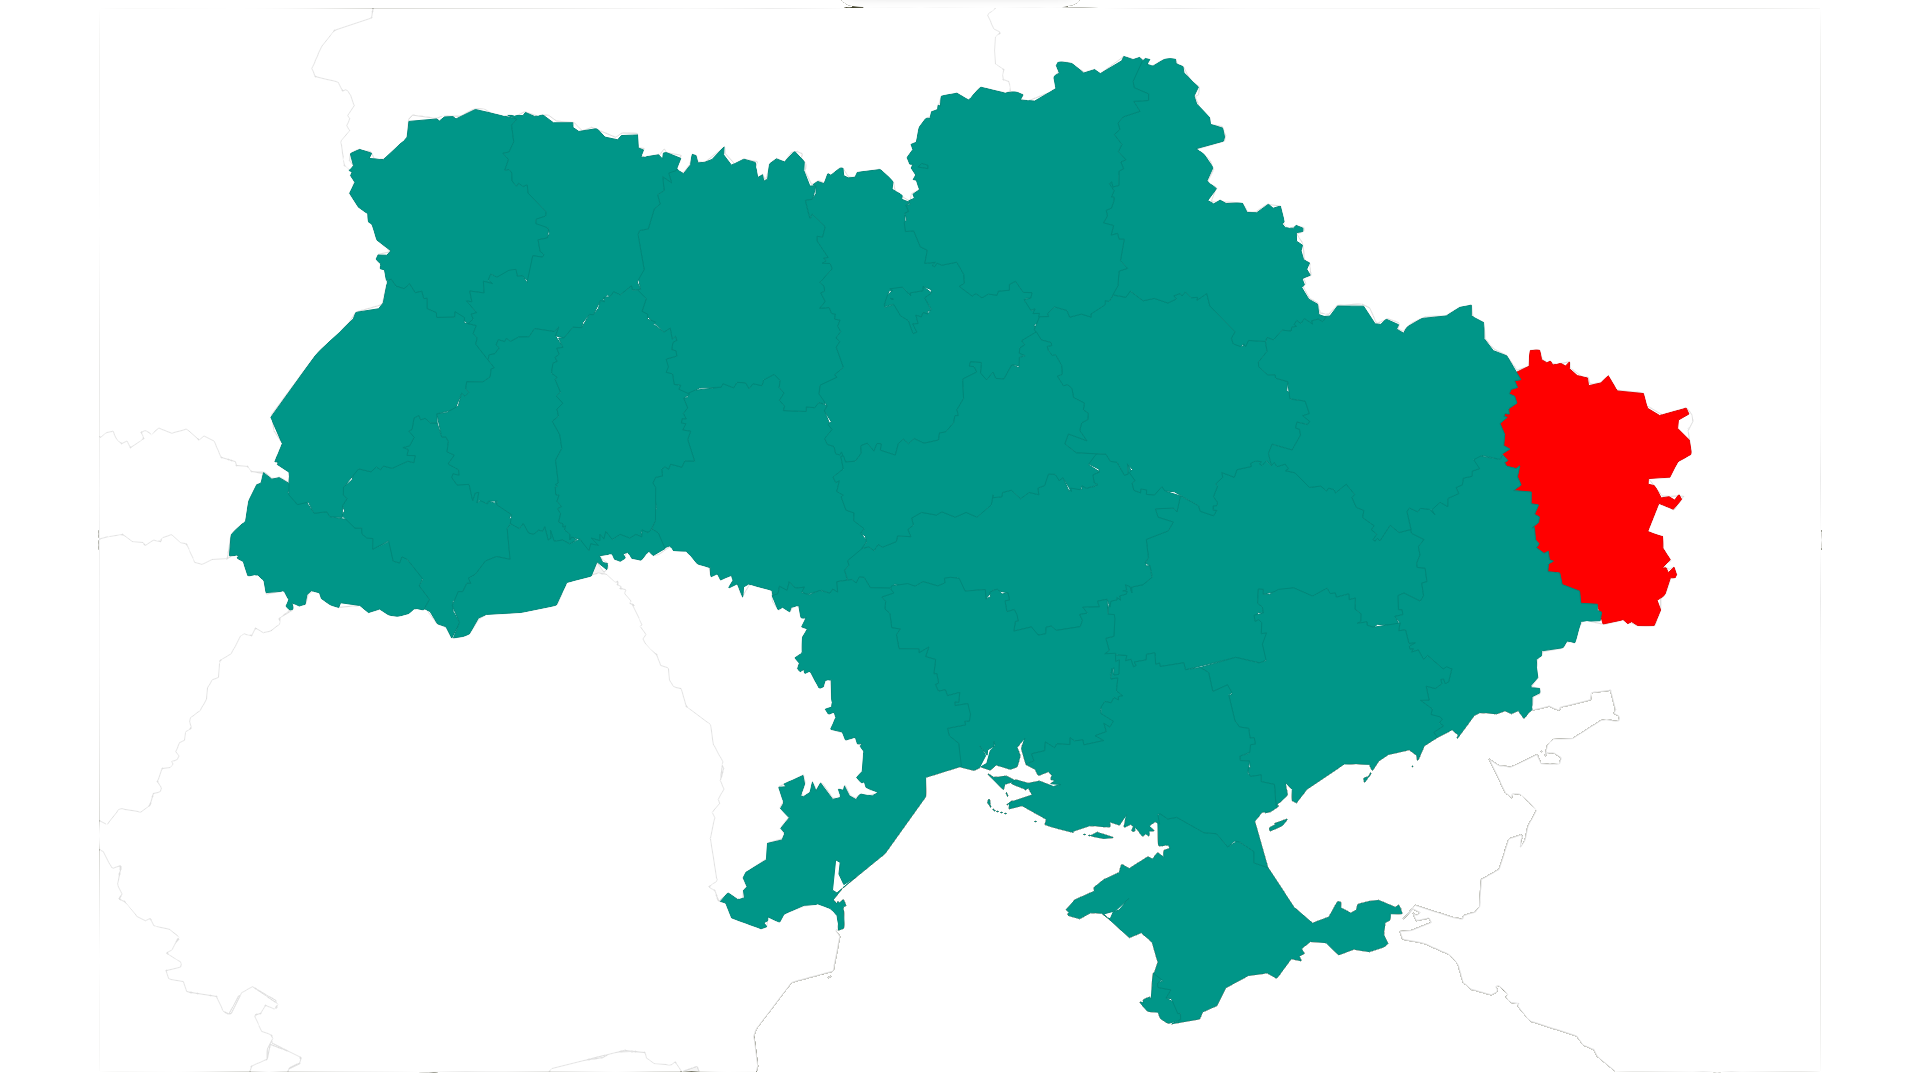
- Simlest air raid map, built with Google Charts API and API єМапа. Contains discard time for every district.
- You can try this out HERE
- Consider donating if you've found this helpful
Data comes from єМапа by @Vadimkin (their repo with Telegram data crawler)
See code here
Simple HTML template for this project:
<html>
  <head>
    <script type="text/javascript" src="https://www.gstatic.com/charts/loader.js"></script>
    <script type="text/javascript">
        ...
    </script>
  </head>
  <body>
      <div id="regions_div"></div>
    </div>
    ...
  </body>
</html>Loading package:
      google.charts.load('current', {
        'packages':['geochart'],
      });
      google.charts.setOnLoadCallback(drawRegionsMap);
      ...
Simpple JSON parser:
      function alertsToData(json){
        const obj = JSON.parse(json);
        return obj;
      }
      ...
Making tooltips with enable/disable air raid siren time:
      function ifNull(string){if( string ) {return string.replace('T', ", ").replace('+00:00', "");}else{return "";}}
      function alertToText(status){if(status){return "Тривога з: ";}else{return "Відбій з: ";}}
      function constructTooltip(state, statuses){
        return alertToText(statuses.states[state].enabled) + ifNull(statuses.states[state].disabled_at) + ifNull(statuses.states[state].enabled_at);
      }
      ...
Getting latest air raid statuses and drawing the map
      function drawRegionsMap() {
        var statusesRaw = alertsToData('<?php echo file_get_contents("https://emapa.fra1.cdn.digitaloceanspaces.com/statuses.json");?>');
        var statusesArray = dataToArray(statusesRaw);
        var data = google.visualization.arrayToDataTable(statusesArray);
        ...
These parameters define how will this map look like - reference:
        var options = {
            resolution: 'provinces',
            region: 'UA',
            displayMode: 'regions',
            datalessRegionColor:'white',
            colorAxis: {colors: ['009688', 'red']},
            domain:'UA',
        };
        ...
Defining chart frame and drawing into it:
        var chart = new google.visualization.GeoChart(document.getElementById('regions_div'));

        chart.draw(data, options);
      }
Also we can remove annoying an unnecessary map legend by adding this into
<body>:
    <style>
      #regions_div > div > div:nth-child(1) > div > svg > g > g:nth-child(3){
        visibility: hidden;
      }
    </style>