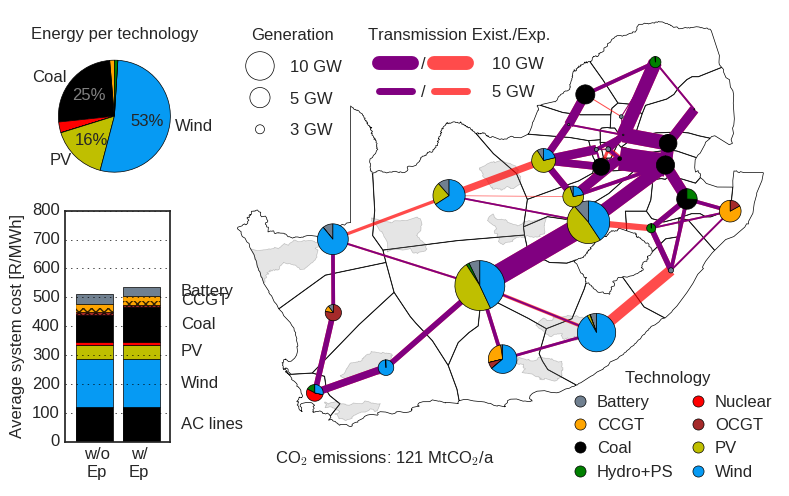
PyPSA model of the South African electricity system at the level of ESKOM's supply regions.
The model is described and evaluated in the paper PyPSA-ZA: Investment and operation co-optimization of integrating wind and solar in South Africa at high spatial and temporal detail, 2017, arXiv:1710.11199.
This repository contains the scripts to automatically reproduce the analysis.
To build and solve the model, a computer with about 20GB of memory with a strong interior-point solver supported by the modelling library PYOMO like Gurobi or CPLEX are required.
We recommend as preparatory steps (the path before the % sign denotes the
directory in which the commands following the % should be entered):
-
cloning the repository using
git(to a directory without any spaces in the path)/some/other/path % cd /some/path/without/spaces /some/path/without/spaces % git clone https://github.com/FRESNA/pypsa-za.git -
installing the necessary python dependencies using conda (from within the
pypsa-zadirectory).../pypsa-za % conda env create -f environment.yaml .../pypsa-za % source activate pypsa-za # or conda activate pypsa-za on windows
-
getting the separate data bundle (see also [Data dependencies] below) and unpacking it in
data.../data % wget "https://vfs.fias.science/d/f204668ef2/files/?dl=1&p=/pypsa-za-bundle.7z" .../data % 7z x pypsa-za-bundle.7z
All results and scenario comparisons are reproduced using the workflow
management system snakemake
.../pypsa-za % snakemake
[... will take about a week on a recent computer with all scenarios ...]
snakemake will first compute several intermediate data files in the directory
resources, then prepare unsolved networks in networks, solve them and save
the resulting networks in results/version-0.x/networks and finally render the
main plots into results/version-0.5/plots.
Instead of computing all scenarios (defined by the product of all wildcards in
the scenario config section), snakemake also allows to compute only a
specific scenario like csir-aggressive_redz_E_LC:
.../pypsa-za % snakemake results/version-0.5/plots/network_csir-aggressive_redz_E_LC_p_nomFor ease of installation and reproduction we provide a bundle
pypsa-za-bundle.7z
with the necessary data files:
| File | Citation |
|---|---|
| South_Africa_100m_Population | WorldPop, South Africa 100m Population (2013). doi:10.5258/soton/wp00246 |
| Supply area normalised power feed-in for PV.xlsx | D. S. Bofinger, B. Zimmermann, A.-K. Gerlach, D. T. Bischof-Niemz, C. Mushwana, Wind and Solar PV Resource Aggregation Study for South Africa. (2016). |
| Supply area normalised power feed-in for Wind.xlsx | same as above |
| EIA_hydro_generation_2011_2014.csv | U.S. EIA, Hydroelectricity Net Generation ZA and MZ 2011-2014 (2017). |
| Existing Power Stations SA.xlsx | Compiled by CSIR from Eskom Holdings (Jan 2017) and RSA DOE, IRP2016 |
| Power_corridors | RSA DEA, REDZs Strategic Transmission Corridors (Apr 2017) |
| REDZ_DEA_Unpublished_Draft_2015 | RSA DEA, Wind and Solar PV Energy Strategic Environmental Assessment REDZ Database (Mar 2017) |
| SACAD_OR_2017_Q2 | RSA DEA, South Africa Conservation Areas Database (SACAD) (Jun 2017) |
| SAPAD_OR_2017_Q2 | RSA DEA, South Africa Protected Areas Database (SAPAD) (Jun 2017) |
| SystemEnergy2009_13.csv | Eskom, System Energy 2009-13 Hourly, available from Eskom on request |
| SALandCover_OriginalUTM35North_2013_GTI_72Classes | GEOTERRAIMAGE (South Africa), 2013-14 South African National Land-Cover Dataset (2017) |
