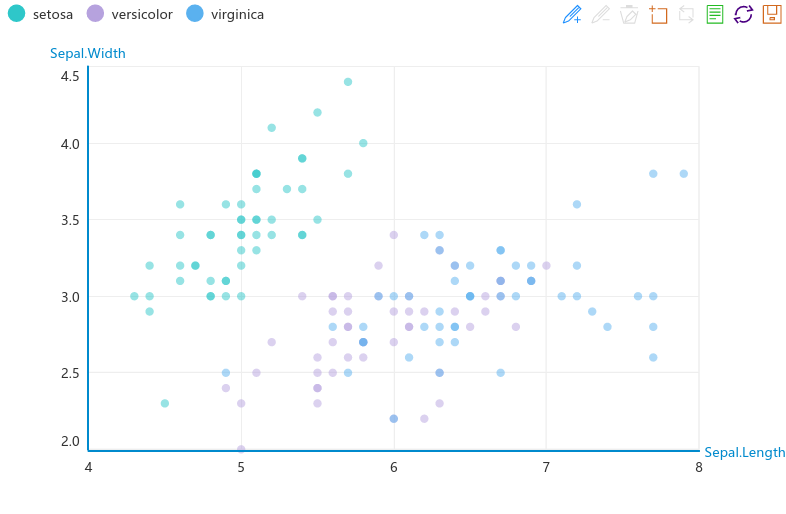
Echarts2 is an open source d3-js library developed by Baidu Inc. for interactive charts. Compared to other popular d3-js libraries, Echarts is more Chinese-friendly. The latest stable release of Echarts2 is 2.2.7. The most up-to-date version is Echarts 3.2.3.
This package is to facilitate R users to make use of Echarts2 library (Echarts3 is not supported yet). A hello world example is as below:
echartr(iris, Sepal.Length, Sepal.Width, Species) %>% setTheme('macarons')The initial
rechartspackage was developed by Yang Zhou and Taiyun Wei. The current branch was forked from Yihui Xie.
if (!require(devtools)) library(devtools)
devtools::install_github('madlogos/recharts')
As the package is under development, you may come across errors when requiring the package directly from Github. You can alternatively download the codes from Github and compile the codes using RStudio.
Rhelp system- Official help
The package was developed using RStudio under Ubuntu 16.
The Echarts object is an S3 list, comprising of the following elements:
(1) Timeline contained
- timeline
- options
    - series
        - list 1
        - ...
    - widgets (title, legend, toolbox, dataRange, dataZoom, roamController)
    - ...
(2) No timeline contained
- series
    - list 1
    - ...
- widgets (title, legend, toolbox, dataRange, dataZoom, roamController)
- ...
The basic design is to configure an S3 object widget by widget and concatenate them by pipe operator (%>%). It is inspired by ggplot2.
The core function is echartr, which accepts basic settings of data source, variables, chart types and then constructs the framework of the S3 object (options part of the Echarts DOM object).
Then echartr parses the data source and calls series processing functions (series_scatter, series_bar, series_line, ...) to build the series part of the options object.
Then you can add more objects (addMarkLine, addMarkPoint, addHeatmap, addNameMap, ...) to the echarts object.
Then you can configure other widgets in the echarts object created by echartr to create/modify the widgets. E.g, setTitle, setLegend, setToolbox, setDataZoom, setDataRange, setTimeline, setRoam, axes such as setAxis, setPolar and aesthetics such as setGrid, setSymbols, setTooltip, setTheme.
You can further tune the series configuration using series tuning functions (under development) with full APIs from Echarts.
Finally, you can use addMarkLine or addMarkPoint to modify the series object step further.
Current version is 0.0.5.
- Major part of core function
echartr - Major part of widget functions
setTitle,setLegend,setDataRange,setDataZoom,setToolbox,setTimeline,setRoam - Additional element functions
addMarkLine,addMarkPoint,addNameMap,addHeatmap,addGeoCoord - Major part of Axis/grid functions
setAxis,setPolar,setGrid - Major part of aesthetic function
relocWidget,setTheme,setSymbols,setTooltip - Series processing fuenctions
series_scatter,series_bar,series_line,series_k,series_pie,series_funnel,series_radar,series_map,series_force,series_chord,series_gauge,series_wordCloud,series_tree,series_treemap,series_venn,series_riverEvent,series_heatmap
- Mono-coordinate System
- Cartesian Coordinate System
- Scatter
- Bar
- Line
- K
- eventRiver
- Others
- Cartesian Coordinate System
- Multi-coordinate System
- Polar Coordinate System
- Pie
- Funnel
- Radar Chart
- Gauge Chart
- Others
- Polar Coordinate System
- Tool functions to configure series precisely
- Bug fix
- Optimize algorithms
Under the terms of MIT + file license.
