modelsummary and gtsummary are two excellent r packages to build
summary statistics. However, their syntax might not be fully intituitive
if you are comming from Stata. Here are a couple of examples using these
two packages.
First, let’s load the following packages and load our data:
library(tidyverse)
library(gtsummary)
library(modelsummary)
library(haven)

census <- read_dta("http://www.stata-press.com/data/r9/census.dta") %>%
  # Create dummy treatment
  mutate(
    rand = runif(n()),
    treatment = as.numeric(rand > 0.5)
  )
I’m using the census stata dta file for those who are familiar with this Stata dataset.
When it comes to model summary, we have two approaches: (1) a rapid data
summary, and (2) a more elaborated one. For the former, we use the
datasummary_skim() function as follows:
datasummary_skim(census)| Unique (#) | Missing (%) | Mean | SD | Min | Median | Max | |
|---|---|---|---|---|---|---|---|
| region | 4 | 0 | 2.7 | 1.1 | 1.0 | 3.0 | 4.0 |
| pop | 50 | 0 | 4518149.4 | 4715037.8 | 401851.0 | 3066433.0 | 23667902.0 |
| poplt5 | 50 | 0 | 326277.8 | 331585.1 | 35998.0 | 227467.5 | 1708400.0 |
| pop5_17 | 50 | 0 | 945951.6 | 959372.8 | 91796.0 | 629654.0 | 4680558.0 |
| pop18p | 50 | 0 | 3245920.1 | 3430531.3 | 271106.0 | 2175130.0 | 17278944.0 |
| pop65p | 50 | 0 | 509502.8 | 538932.4 | 11547.0 | 370495.0 | 2414250.0 |
| popurban | 50 | 0 | 3328253.2 | 4090177.9 | 172735.0 | 2156905.0 | 21607606.0 |
| medage | 37 | 0 | 29.5 | 1.7 | 24.2 | 29.8 | 34.7 |
| death | 50 | 0 | 39474.3 | 41742.3 | 1604.0 | 26176.5 | 186428.0 |
| marriage | 50 | 0 | 47701.4 | 45130.4 | 4437.0 | 36279.0 | 210864.0 |
| divorce | 50 | 0 | 23679.4 | 25094.0 | 2142.0 | 17112.5 | 133541.0 |
| rand | 50 | 0 | 0.5 | 0.3 | 0.0 | 0.5 | 1.0 |
| treatment | 2 | 0 | 0.5 | 0.5 | 0.0 | 0.0 | 1.0 |
If we want to select only a few variables, we could past a variables
vector to the select function or create a new object with only the
variables we need.
census %>%
  select(pop, death, marriage, divorce) %>%
datasummary_skim()| Unique (#) | Missing (%) | Mean | SD | Min | Median | Max | |
|---|---|---|---|---|---|---|---|
| pop | 50 | 0 | 4518149.4 | 4715037.8 | 401851.0 | 3066433.0 | 23667902.0 |
| death | 50 | 0 | 39474.3 | 41742.3 | 1604.0 | 26176.5 | 186428.0 |
| marriage | 50 | 0 | 47701.4 | 45130.4 | 4437.0 | 36279.0 | 210864.0 |
| divorce | 50 | 0 | 23679.4 | 25094.0 | 2142.0 | 17112.5 | 133541.0 |
In addition, we can let the function knows if we would like to have only summary statistics for those variables that are either numeric or categorical, for example:
datasummary_skim(census, type = "numeric")If we would like to have only the mean, sd, min, max instead of all the
statistics that are presented using datasummary_skim we can use a
2-sided formula.
build <- pop + death + marriage + divorce ~ N + Mean + SD + Median + Min + Max

## Without labels

datasummary(
  build,
  data = census
) | N | Mean | SD | Median | Min | Max | |
|---|---|---|---|---|---|---|
| pop | 50 | 4518149.44 | 4715037.75 | 3066433.00 | 401851.00 | 23667902.00 |
| death | 50 | 39474.26 | 41742.35 | 26176.50 | 1604.00 | 186428.00 |
| marriage | 50 | 47701.40 | 45130.42 | 36279.00 | 4437.00 | 210864.00 |
| divorce | 50 | 23679.44 | 25094.01 | 17112.50 | 2142.00 | 133541.00 |
In the case of variables labels, we will need to modify those variables names.
## With labels

build <- `Population` + `Number of deaths` + `Number of marriages` + `Number of divorces` ~ N + Mean + SD + Median + Min + Max

datasummary(
  build,
  data = census %>%
    rename(`Population` = pop, `Number of deaths` = death, `Number of marriages` = marriage, `Number of divorces` = divorce)
) | N | Mean | SD | Median | Min | Max | |
|---|---|---|---|---|---|---|
| Population | 50 | 4518149.44 | 4715037.75 | 3066433.00 | 401851.00 | 23667902.00 |
| Number of deaths | 50 | 39474.26 | 41742.35 | 26176.50 | 1604.00 | 186428.00 |
| Number of marriages | 50 | 47701.40 | 45130.42 | 36279.00 | 4437.00 | 210864.00 |
| Number of divorces | 50 | 23679.44 | 25094.01 | 17112.50 | 2142.00 | 133541.00 |
Finally, we can use the output argument to export our table to a
several file formats.
build <- pop + death + marriage + divorce ~ N + Mean + SD + Median + Min + Max

datasummary(
  build,
  data = census,
  output = "latex"
)
In the case of latex, your output would like this and you can use the
\input command in your latex document to add your table to your
reports or working papers:
\begin{table}
\centering
\begin{tabular}[t]{lrrrrrr}
\toprule
  & N & Mean & SD & Median & Min & Max\\
\midrule
pop & 50 & \num{4518149.44} & \num{4715037.75} & \num{3066433.00} & \num{401851.00} & \num{23667902.00}\\
death & 50 & \num{39474.26} & \num{41742.35} & \num{26176.50} & \num{1604.00} & \num{186428.00}\\
marriage & 50 & \num{47701.40} & \num{45130.42} & \num{36279.00} & \num{4437.00} & \num{210864.00}\\
divorce & 50 & \num{23679.44} & \num{25094.01} & \num{17112.50} & \num{2142.00} & \num{133541.00}\\
\bottomrule
\end{tabular}
\end{table}
Check the official official vignette for more examples.
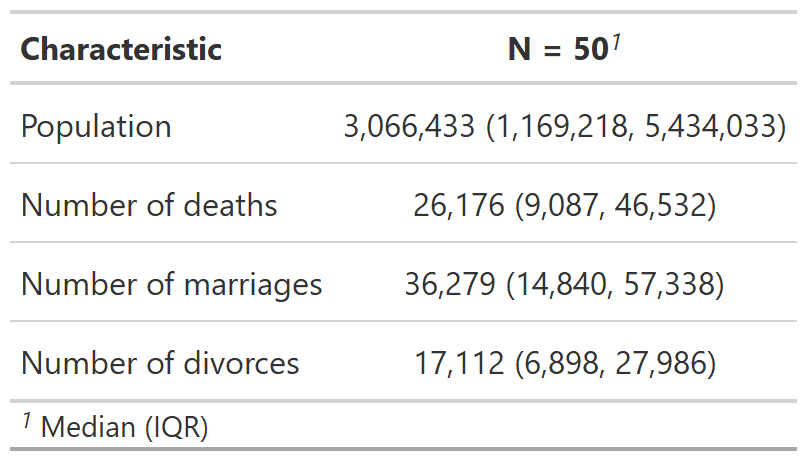
gtsummary is another package that can be used for basic and complex
summary statistics. Its syntax follows the gt family. For a basic
summary statistics table, we can use the tbl_summary() function as
follows:
vars <- c("pop", "death", "marriage", "divorce")

tab1 <- census %>%
  select(all_of(vars)) %>%
  tbl_summary()
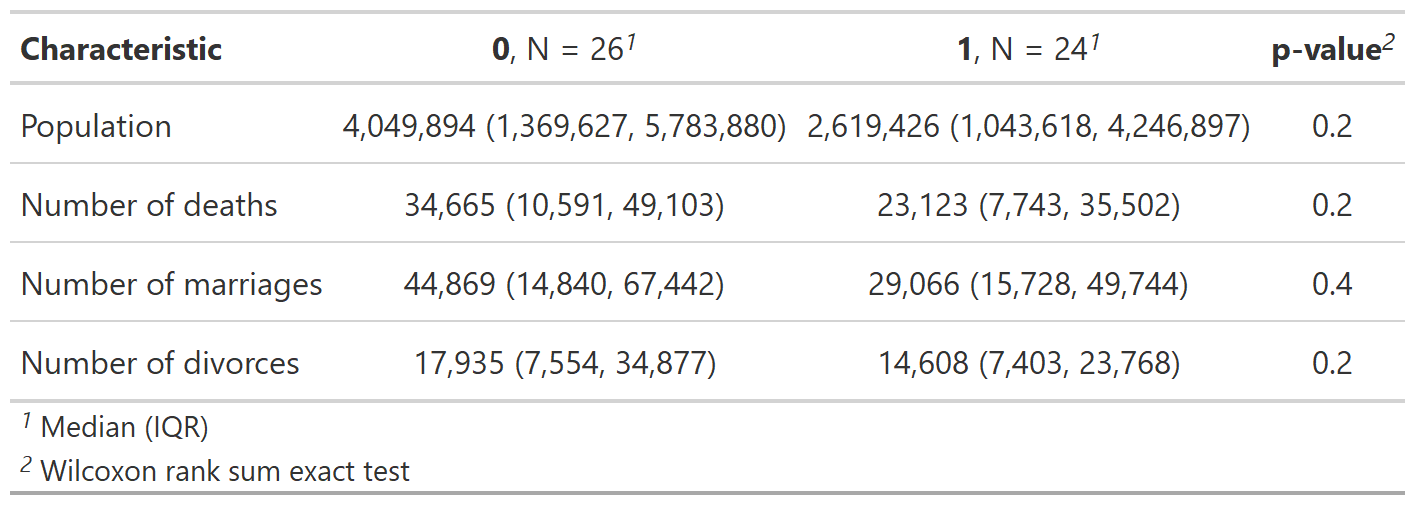
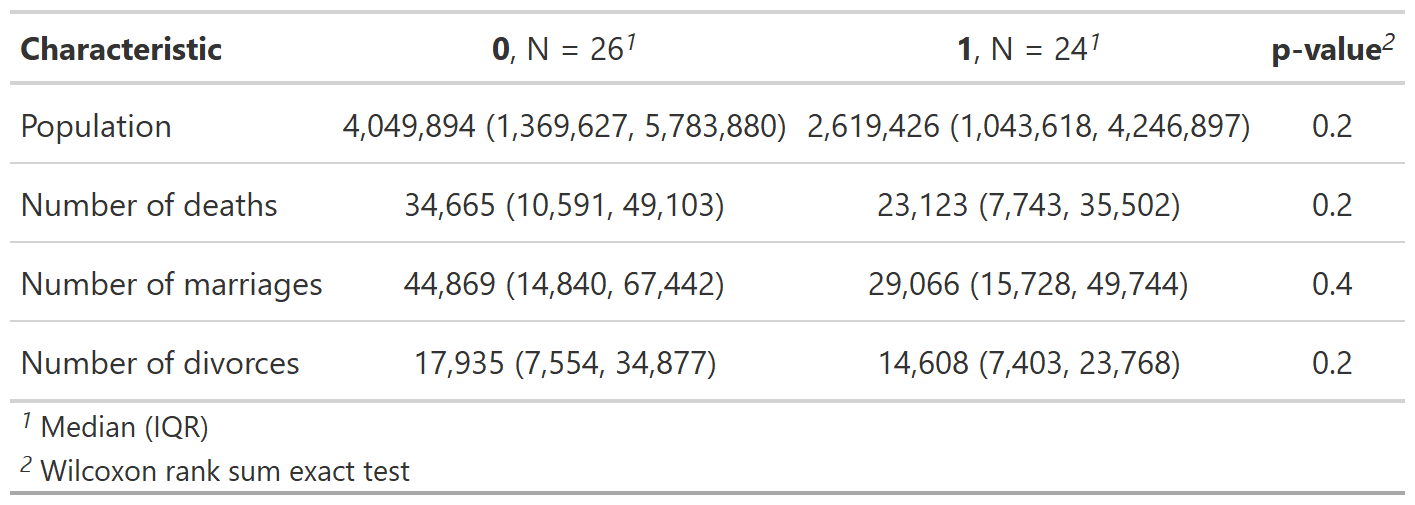
By treatment variable:
tab2 <- census %>%
  select(all_of(vars), treatment) %>%
  tbl_summary(by = treatment) %>%
  add_p()
Given that we would like to have a more econ-paper type of descriptive statistics, we can pass the columns we would like to have in a vectorized way.
cols <- c(N = "{N_nonmiss}", Mean = "{mean} ({sd})", Median = "{median}", Min = "{min}", Max = "{max}")
tab3 <- cols %>%
  # we would go through each of these columns
  imap(
    ~ census %>%
      # and select the variables we need in our table
      select(all_of(vars)) %>%
      tbl_summary(
        statistic = all_continuous() ~ .x
      ) %>%
      # We will modify the title of cols headers
      modify_header(stat_0 ~ str_glue("{.y}"), label ~ "Variables")
  ) %>%
  # and merge every single of the columns into one single table
  tbl_merge() %>%
  # remove spanning headers and footnote
  modify_spanning_header(everything() ~ NA) %>%
  modify_footnote(everything() ~ NA)
And, finally, we can use the as_kable_extra function to export our
table to latex. The full example is here below:
tab3 %>%
  as_kable_extra(
    format = "latex",
    booktabs = TRUE,
    linesep = ""
  )
That gives you the following latex code:
\begin{tabular}{lccccc}
\toprule
Variables & N & Mean & Median & Min & Max\\
\midrule
Population & 50 & 4,518,149 (4,715,038) & 3,066,433 & 401,851 & 23,667,902\\
Number of deaths & 50 & 39,474 (41,742) & 26,176 & 1,604 & 186,428\\
Number of marriages & 50 & 47,701 (45,130) & 36,279 & 4,437 & 210,864\\
Number of divorces & 50 & 23,679 (25,094) & 17,112 & 2,142 & 133,541\\
\bottomrule
\end{tabular}
Check the official official vignette for more examples.
A compiled PDF example of some of the tables that were created here can be found here


