JUnit Insights
JUnit Insights is an extension for JUnit 5 (optionally in combination with the Spring framework), which
- measures the time for setup, execution and teardown for each test method in each test class
- (optional) measures how often Spring contexts were created and how long this takes
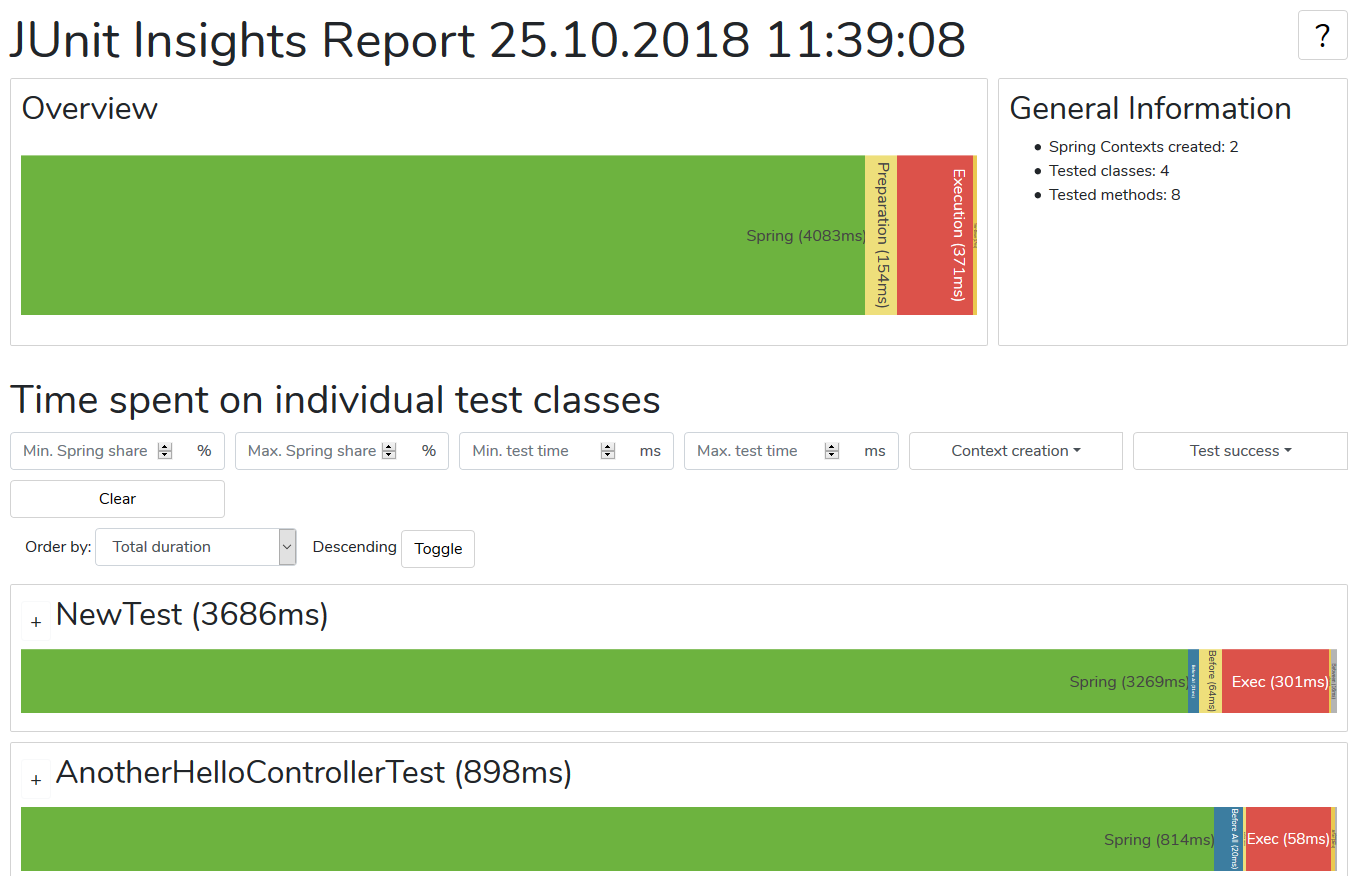
- creates a nice looking report that visualizes the data (see screenshot below)
Background: When building integration tests with Spring (e.g. with @SpringBootTest), sometimes a Spring application context has to be started and sometimes it doesn't. For the user of the test classes, it looks like some tests take a long time to execute, although the actual test runs fairly quickly. To make this behavior transparent, a report is created.
If you want to learn more about when a new Application Context is created, have a look at this article explaining the topic.
Usage
Activating the extension
First of all, you need to tell JUnit Insights that it should be activated via a system property.
Gradle:
test {
    systemProperty 'de.adesso.junitinsights.enabled', 'true'
}
Maven:
<plugins>
...
    <plugin>
        <artifactId>maven-surefire-plugin</artifactId>
        <version>2.22.0</version>
        <configuration>
            <systemPropertyVariables>
                <de.adesso.junitinsights.enabled>true</de.adesso.junitinsights.enabled>
            </systemPropertyVariables>
        </configuration>
    </plugin>
...
</plugins>
Adding individual classes to the benchmark
Add @JUnitInsights to the test classes you want to benchmark.
If you want to exclude methods from the benchmark, add @NoJUnitInsights to those.
Be aware that ExtendsWith(SpringExtension::class) needs to be used as Runner-class.
Including all test classes
Alternatively, if you want to add the extension to all your test classes, you have to activate autodetection for JUnit 5 in your build file and activate JUnit Insights:
Gradle:
test {
    systemProperty 'junit.jupiter.extensions.autodetection.enabled', 'true'
}
Maven:
<plugins>
...
    <plugin>
        <artifactId>maven-surefire-plugin</artifactId>
        <version>2.22.0</version>
        <configuration>
            <systemPropertyVariables>
                <de.adesso.junitinsights.enabled>true</de.adesso.junitinsights.enabled>
                <junit.jupiter.extensions.autodetection.enabled>true</junit.jupiter.extensions.autodetection.enabled>
            </systemPropertyVariables>
        </configuration>
    </plugin>
...
</plugins>
Further information can be found here
Changing the destination path for the reports
By default, created reports are stored in the build/reports directory. You can change this, by changing the following system property.
Gradle:
test {
    systemProperty 'de.adesso.junitinsights.reportpath', 'custom/report/directory/'
}
Maven:
<plugins>
...
    <plugin>
        <artifactId>maven-surefire-plugin</artifactId>
        <version>2.22.0</version>
        <configuration>
            <systemPropertyVariables>
                <de.adesso.junitinsights.enabled>true</de.adesso.junitinsights.enabled>
                <junit.jupiter.extensions.autodetection.enabled>true</junit.jupiter.extensions.autodetection.enabled>
                <de.adesso.junitinsights.reportpath>reports/</de.adesso.junitinsights.reportpath>
            </systemPropertyVariables>
        </configuration>
    </plugin>
...
</plugins>
Dependency
For your convenience, JUnit Insights is available as a SNAPSHOT version from oss.jfrog.org. Just add the necessary repository and the dependency to your build file.
Gradle:
repositories {
    maven {
        url  "https://oss.jfrog.org/artifactory/oss-snapshot-local"
    }
}

dependencies {
    testCompile ('de.adesso:junit-insights:1.1.0-SNAPSHOT')
}
Maven:
<repositories>
    <repository>
        <id>oss-snapshot-local</id>
        <url>https://oss.jfrog.org/artifactory/oss-snapshot-local</url>
    </repository>
</repositories>

<dependencies>
    <dependency>
        <groupId>de.adesso</groupId>
        <artifactId>junit-insights</artifactId>
        <version>1.1.0-SNAPSHOT</version>
    </dependency>
</dependencies>
For local development
If you want to test a local version of this project in a different project than the tester/, build the jar and include it in your project like so:
Gradle:
dependencies {
    testCompile files('../junit-insights/library/build/libs/junit-insights-1.1.0.jar')
}
Maven:
<dependency>
    <groupId>de.adesso</groupId>
    <artifactId>junit-insights</artifactId>
    <version>1.1.0</version>
    <scope>system</scope>
    <systemPath>${basedir}/../junit-insights/library/build/libs/junit-insights-1.1.0.jar</systemPath>
</dependency>
How time is measured
The extension captures certain events in during the test plan execution to measure the time for each phase. Specifically the timestamps provided by the JUnit Jupiter extension API as well as the Spring ContextRefreshedEvent are captured. The following diagram gives an overview of the order of the events on the left and the time intervals that are captured on the right.
To further explain the meaning of the timestamps, following is an extract from the help dialog on the top right of the report site.
The Overview chart breaks down the total test time into the following components:
Spring: startup time for all Spring application contexts
Preparation: sum of all time that passed before the BeforeAll and BeforeEach callbacks
Execution: sum of all time that passed between the BeforeEach and AfterEach callbacks
Tear-Down: like preparation but after the execution
The list down below shows an overview of the individual tested classes and the time spent on different tasks:
Spring: startup time of the possibly created Spring application context
Before All: tasks executed before any of the test methods are executed
Before: sum of the time used before each individual test method
Exec: sum of the execution time of all test methods
After: like before but after the execution
After All: like before all but after the execution
You can also expand the test classes and get the information about Before,
Execution and
After for the individual test methods.
Troubleshooting
If you get an error complaining about a missing JUnit platform launcher, for example
java.lang.ClassNotFoundException: org.junit.platform.launcher.TestExecutionListener
you need to add the dependency for the appropriate package.
If you have any other issues, feel free to open an issue in our issue tracker.

