A Simple Mathematical Tool for Plotting Simple Equations Using Python and PyQt5 GUI Components
Inside the Project Folder Run
(both)        $ python -m venv venv
(powershell)  $ .\venv\Scripts\Activate.ps1
(shell|zsh)   $ source venv/bin/activate
(both)        $ python -m pip install --upgrade pip
(both) $ pip install -r requirements.txtInside the src folder type
python -m unittestThe Program Supports the Following Operations
addition(+), subtraction(-), multiplication(*), division(/), power(^)
Examples for Valid Inputs:
- 3x^2-5x+3
- 4 X + 5
- (x+2)^2 / (3*x-10)^3
Examples for Invalid Inputs:
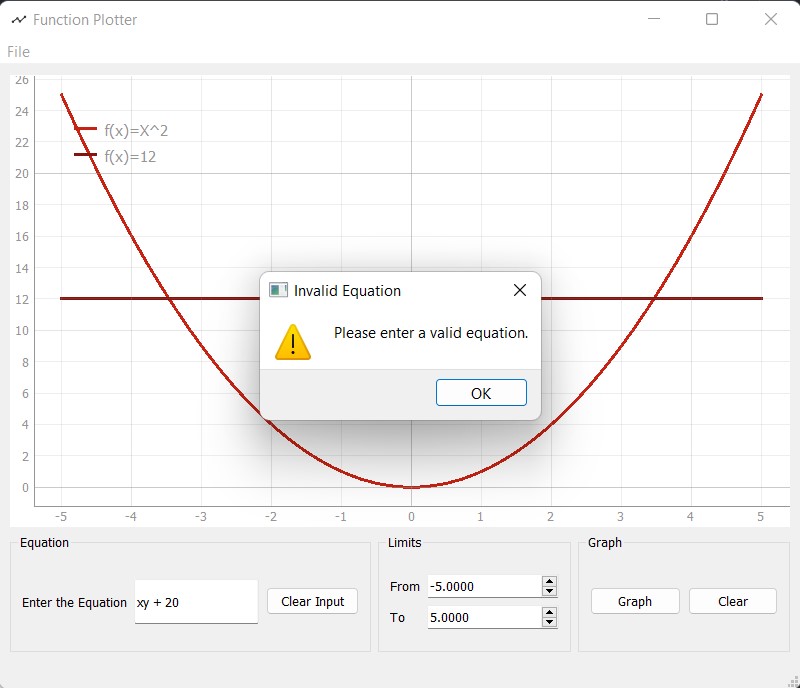
- 3xy-10 (only the letter x is supported)
- sin(x)^2 (only +, -, *, /, and ^ are supported)
- xx (invalid equation)
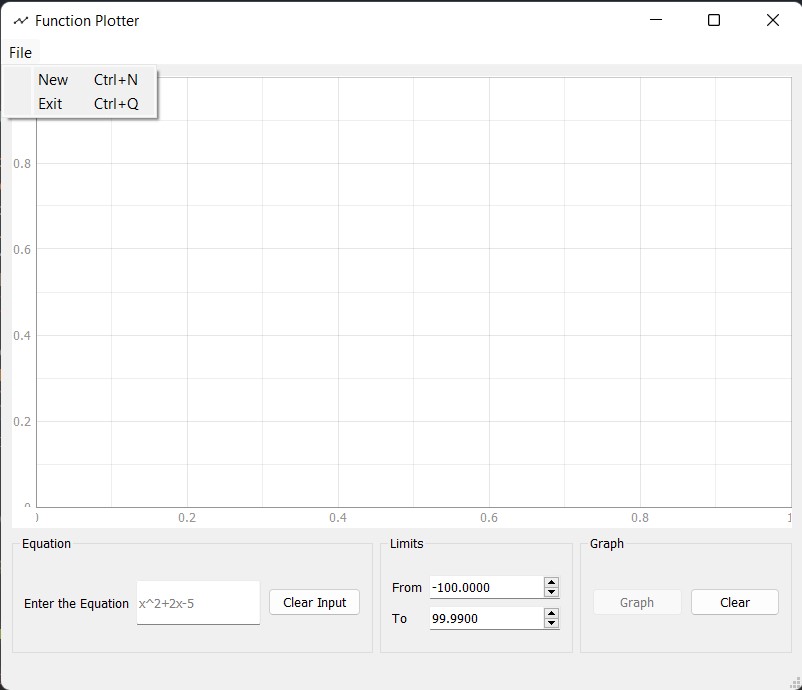
The Main UI Contains
- New Child Window
- Exit Current Window
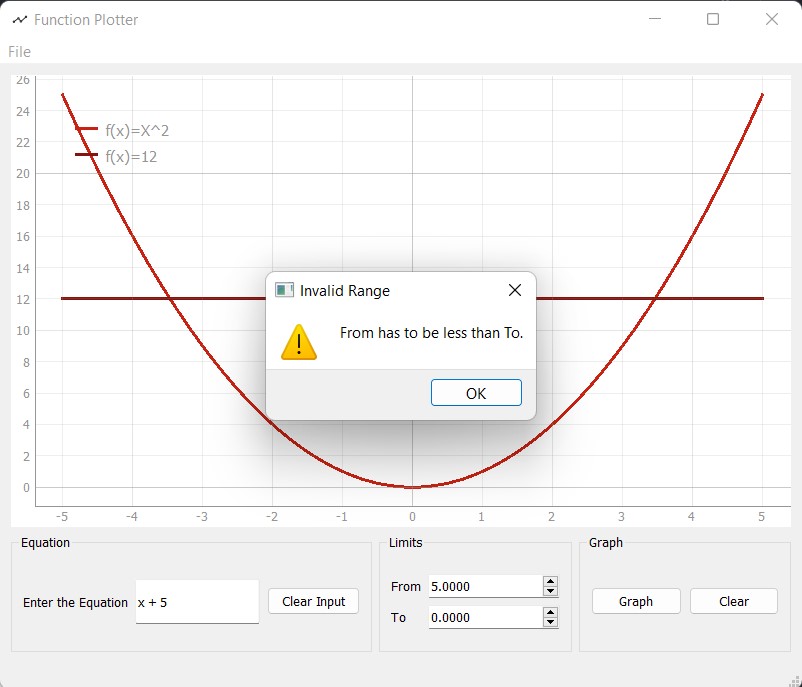
- Enter and Clear the Equation (Enter the equation is triggerd by pressing Enter)
- Enter Limits (from, to, and step)
- Graph and Clear Buttons (Disabled Until write Equation)
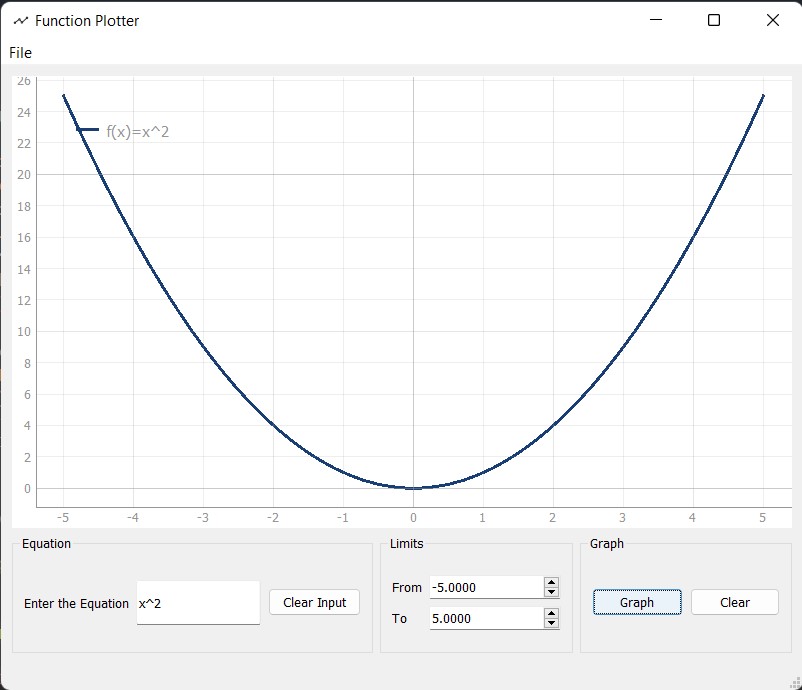
After Drawing a Simple Graph it Shows with a Random Color and Legend With the Function Definition
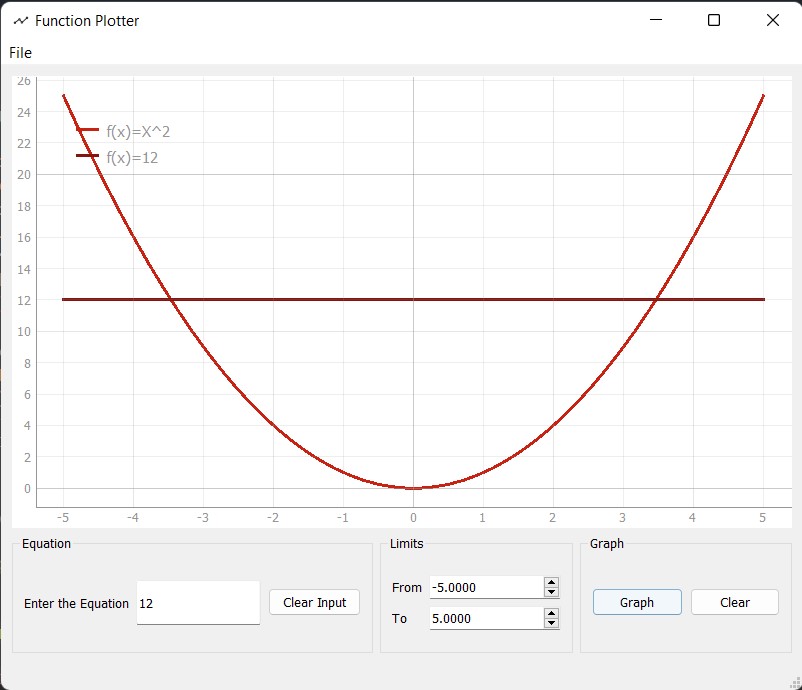
Can Insert Multiple Graphs at the Same Screen
Invalid Equations Popup Window
Invalid Range Because of From being greater than to
