layer2_exporter
Layer2_exporter is a Prometheus exporter with layer2 network scanning. This a not your regular network inventory, it detects devices that are silent and do not respond to pings or scans. It's written in go, and works on Linux/MacOS.
Buy me a coffee
If you feel so inclined as to support my projects. Here's your chance! Thanks
Installation
Use go to install to your gopath.
go get -u github.com/RamboRogers/layer2_exporter Alpine Server Install Instructions: INSTALL_ALPINE.md
Usage
Compile using go, and execute with a CIDR block to begin scanning. Scanning a /24 takes about 10-15 minutes. Scans will continue on a cycle forever.
The default metrics port is TCP/HTTP 9095. If running locally 127.0.0.1:9095/metrics
#BUILDING
cd ~/go/src/RamboRogers/layer2_exporter
go build

#RUNNING
./layer2_exporter 192.168.1.0/24

#RUN ON CUSTOM PORT
./layer2_exporter 192.168.1.0/24 :9999

#RUN ON LOCAL INTERFACE
./layer2_exporter 192.168.1.0/24 127.0.0.1:9999
Prometheus Setup
Setting up in your Prometheus is easy. Just use this example, append to your existing Prometheus config and adjust the target to match where your exporter is running.
- job_name: layer2scan
  scrape_interval: 60s
  metrics_path: /metrics
  static_configs:
    - targets:
       - 192.168.1.240:9095
Grafana Dashboard
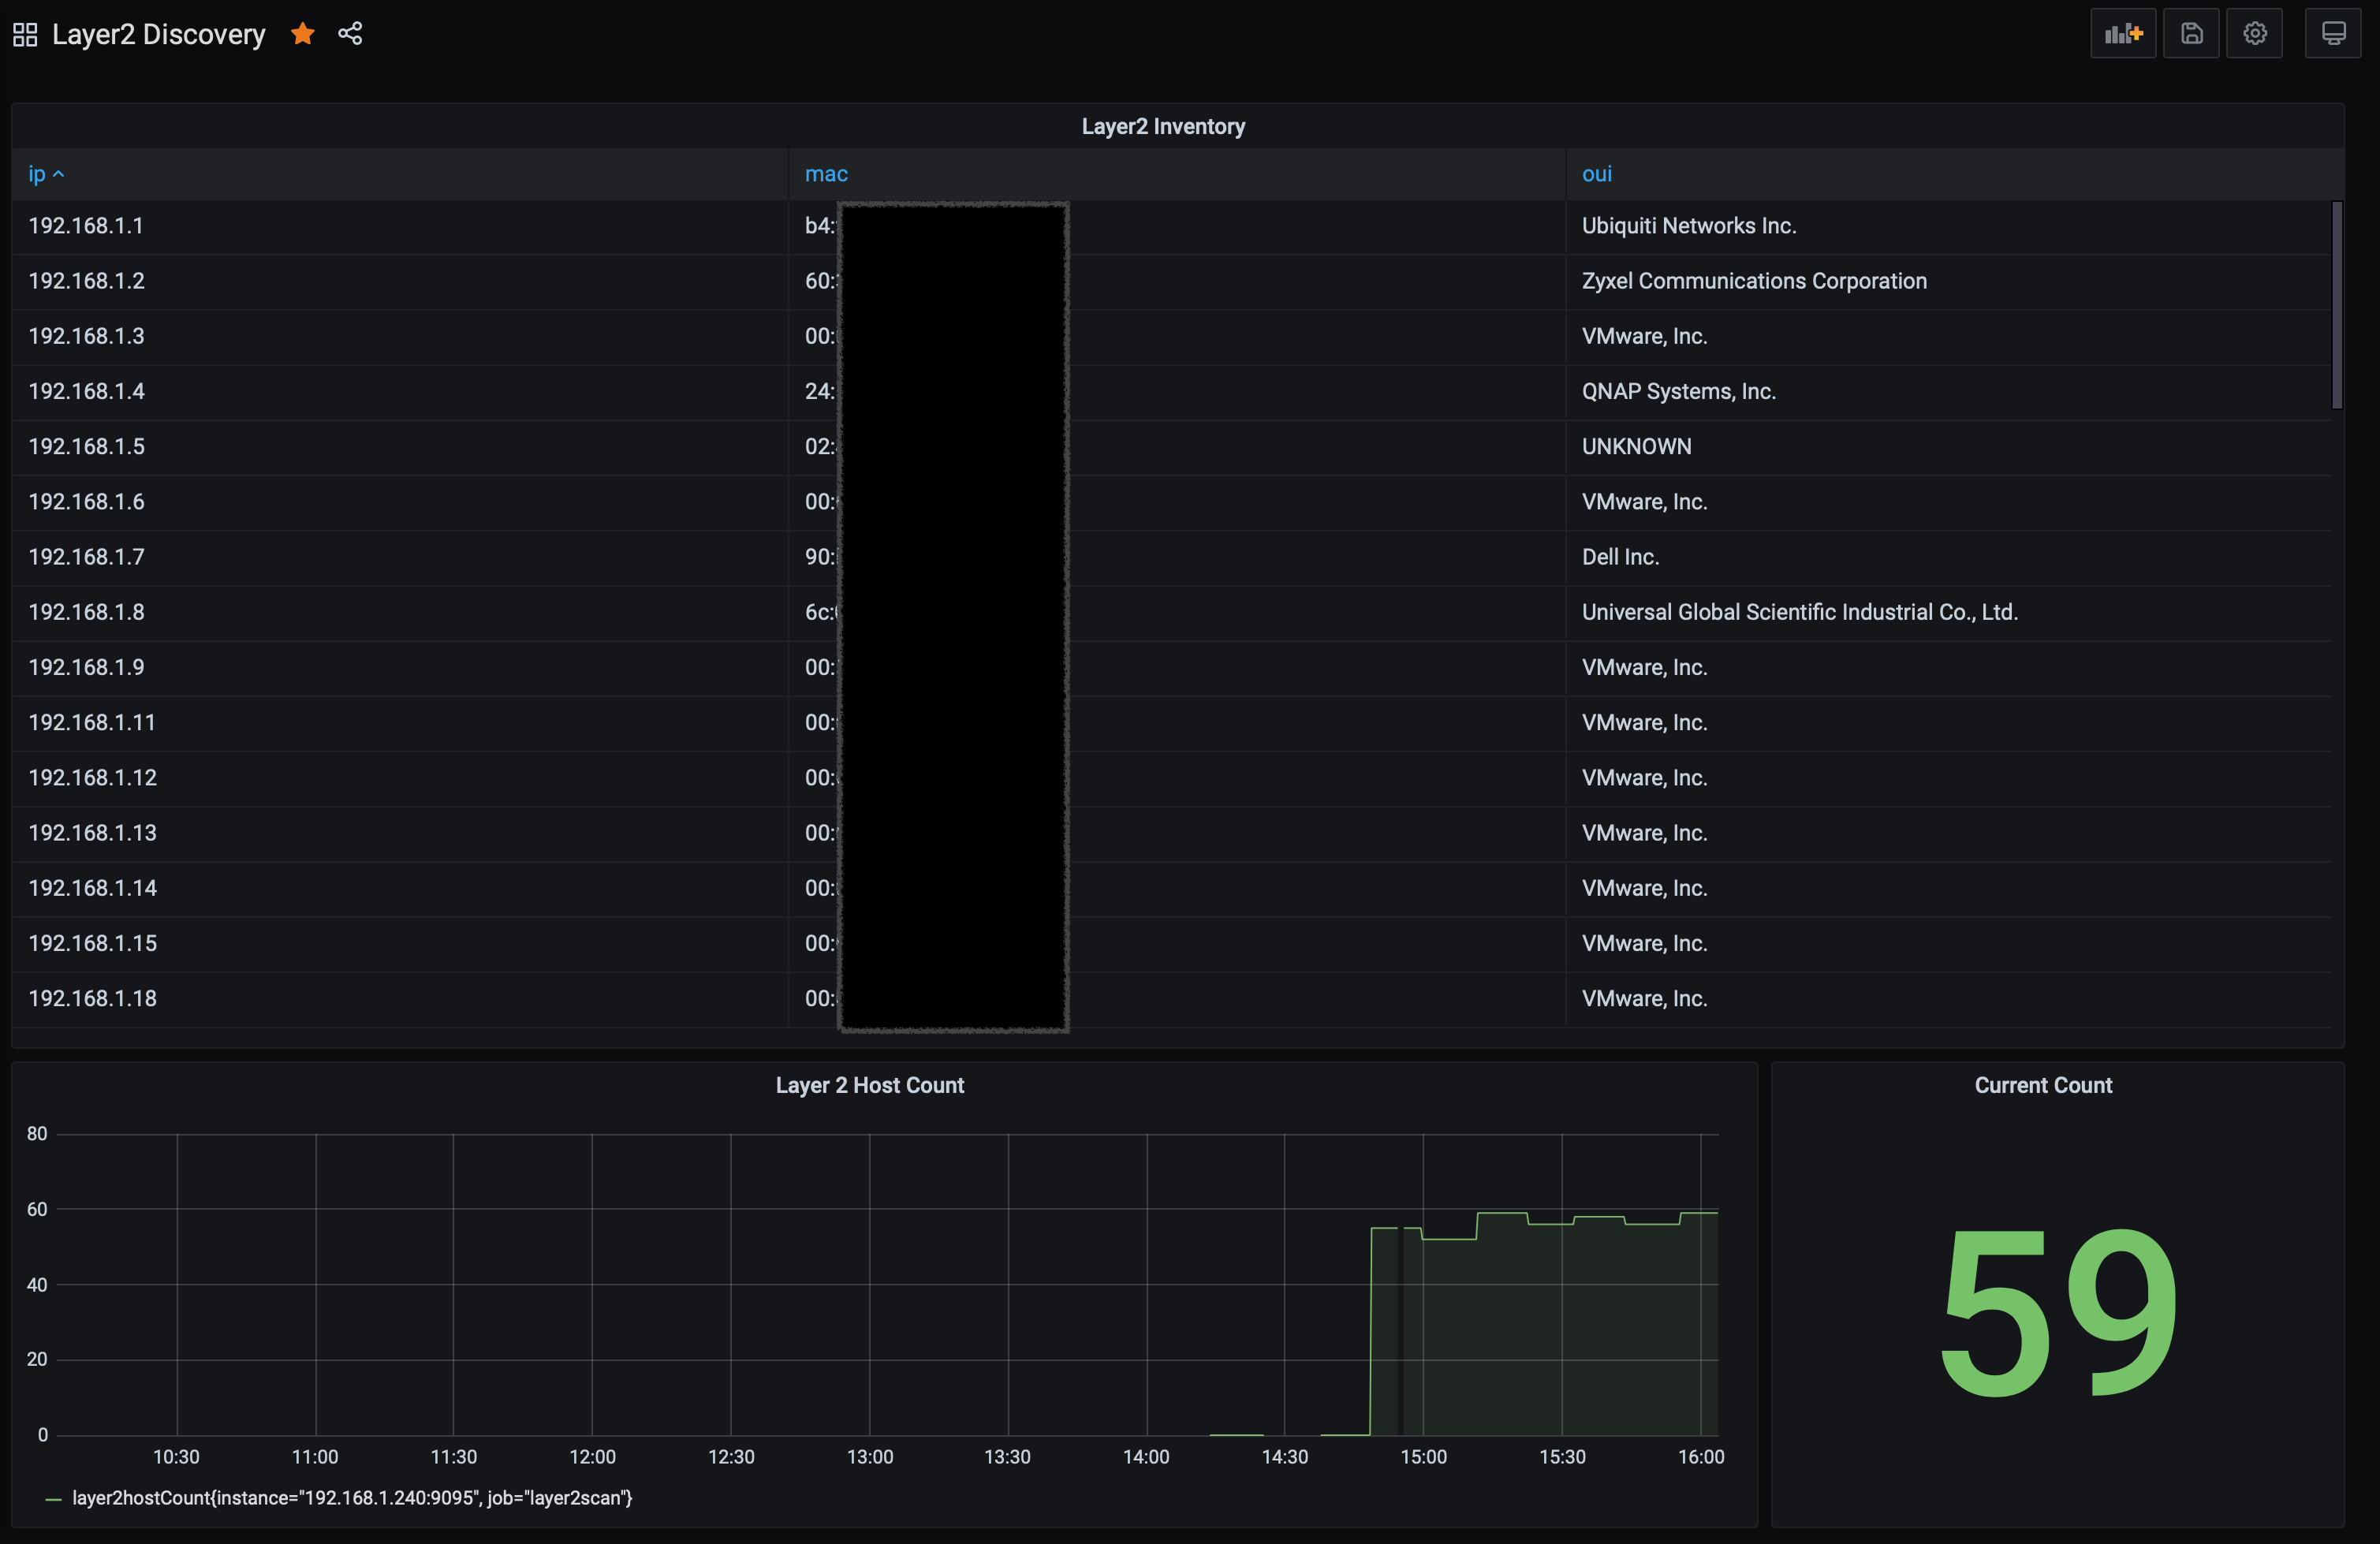
Here is an example dashboard. You can import to your Grafana. This was made on Grafana version 7.
Contributing
Pull requests are welcome. For major changes, please open an issue first to discuss what you would like to change.
Homepage / Contact
My homepage and contact info.
| Type | Data |
|---|---|
| Homepage | https://matthewrogers.org |
| XMPP | RamboRogers@trashserver.net |

