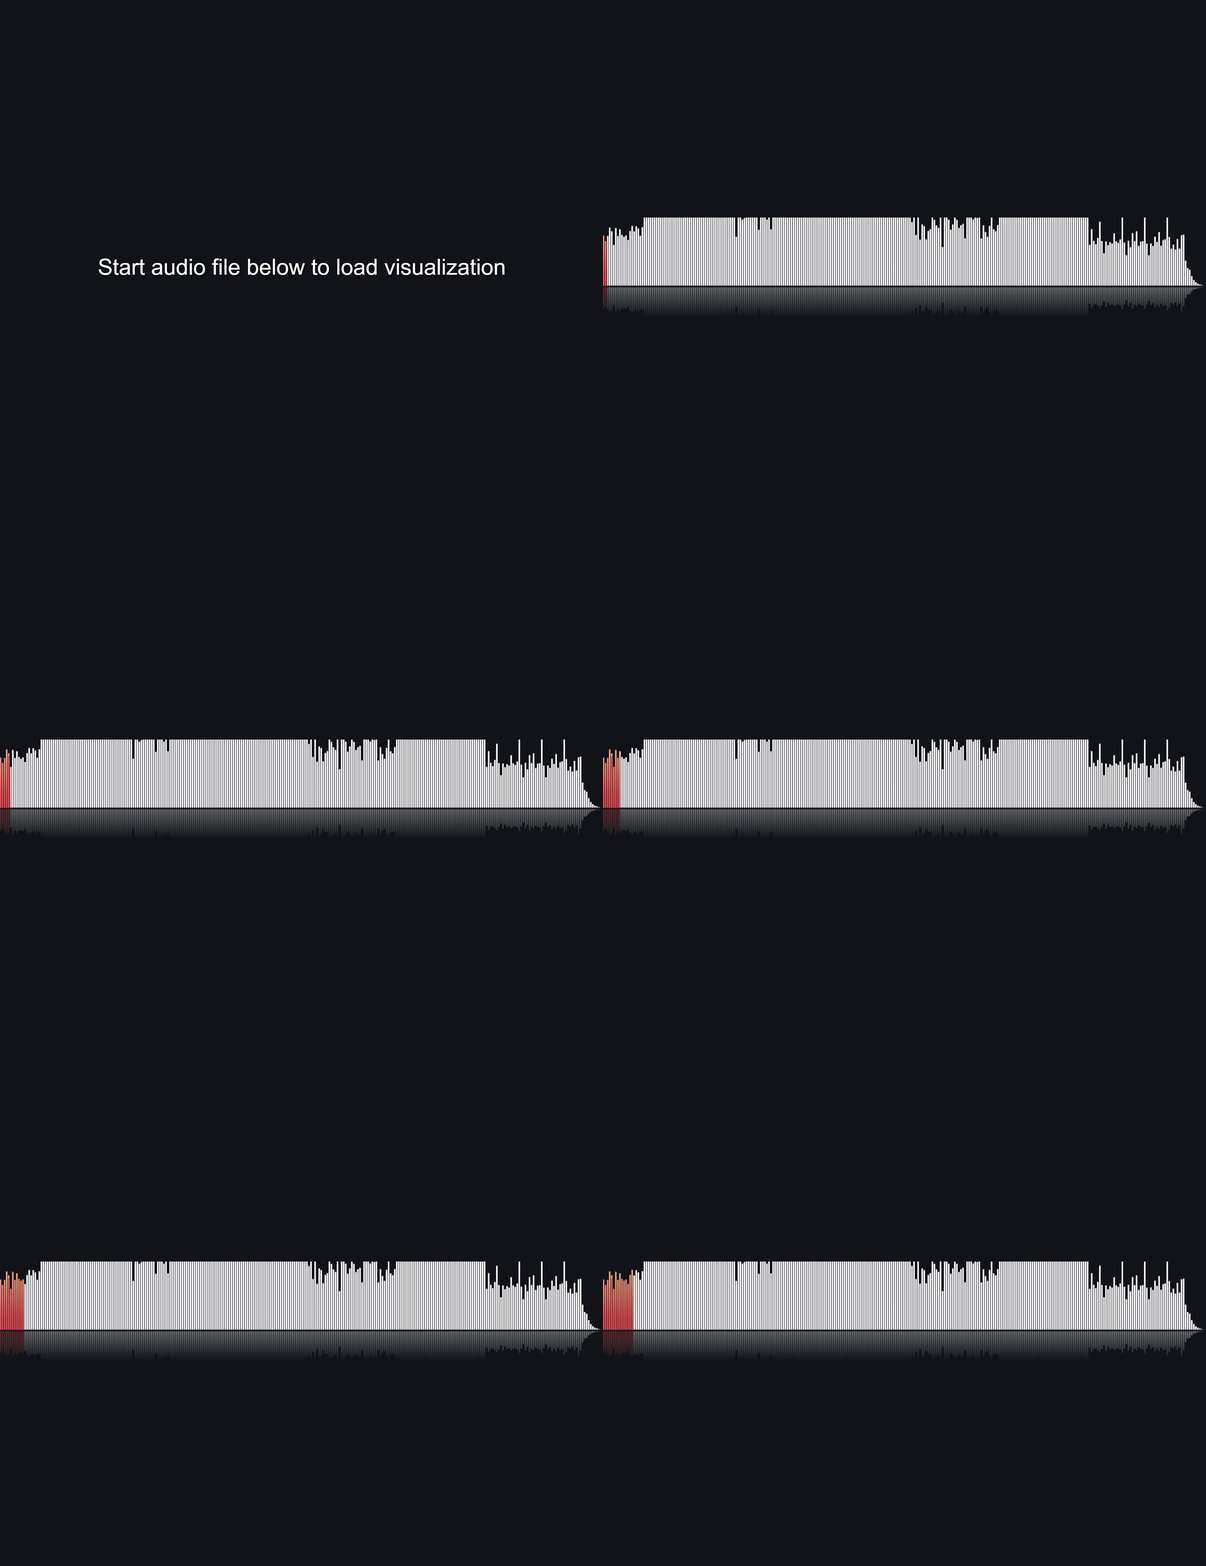
I made a few improvements over my previous attempt here, making it more efficient and animating it. Even still, most of the cost here is the time needed to load the file data--not the computation. We can't use the data from the audio element for this b/c it can only give us data about realtime playback (via the Analyser Node) and here we're wanting to display the waveform for the entire song.
This time I was going for the same look that Soundcloud has. I opted for drawing the gradients directly via canvas, which works out fairly well if you take advantage of masking. I pre-calculate the gradients, but I should probably also pre-calculate the paths/masks to bring the per-frame drawing time even lower.
Another improvement I could make would be to recalculate the shapes on window resize rather than resizing the canvas based on a predefined number of bars to display. I think Soundcloud does this on resize too (though they probably don't calculate the waveform samples in the browser like I'm doing here).
For my next iteration I think I'll try to make my own style of visualization that incorporates both the whole-song waveform and the realtime frequency visualizer in the same UI.
- clone repo
- navigate to project root folder
- install all dependencies with yarn or npm i
- run with yarn start or npm
$ git clone https://github.com/RandolphG/audio-visualizer.git
$ cd project folder
$ yarn or npm i
$ yarn start or npm start
Application is split mainly in one part.
- Visualizer Component
