- NCAA student-athlete academic performance APR.
- This page has links to data and documentation for the NCAA Academic Progress Rates (APRs) of student-athletes.
- As of January 2023, the CSV for 2004-2019 was last updated in May 2020.
- Each questions is worth 2.5 points.
- Recommendations:
- It's easiest to solve the entire assignment after first organizing the data into a long form (tidy) data structure as described in the Seaborn documentation.
- Consider using the pandas.melt() method
- You can answer Questions 1-3 by visualizing distributions with boxplots.
- You can answer Questions 1 & 2 with one call (each) to seaborn. Question 3 may require 2.
- Each questions is worth 2.5 points.
- Although boxplots will serve the purpose of the assignment, you may find that another visualization tells the story particularly well. Feel free to use another approach if you like, just make sure to justify your choice. This is a rich dataset. Extra credit for creative EDA that extends beyond the requirements of the assignment.
- Use git-intro as guidance for organizing your repo
Implement the DRY principle by putting all your preprocessing into one or more functions that get used by each question below. Each question can be answered with one call to seaborn (except for the the last question, which can involve 2 calls). Each question should be answered with one file.
Git clone "this repo" to your local file system, and open your terminal, run:
make answer
This command would run the main.py python file including Question1.py, Question.py, Question3.py all together.
And the generated figures would be saved in the 'figs' directory.
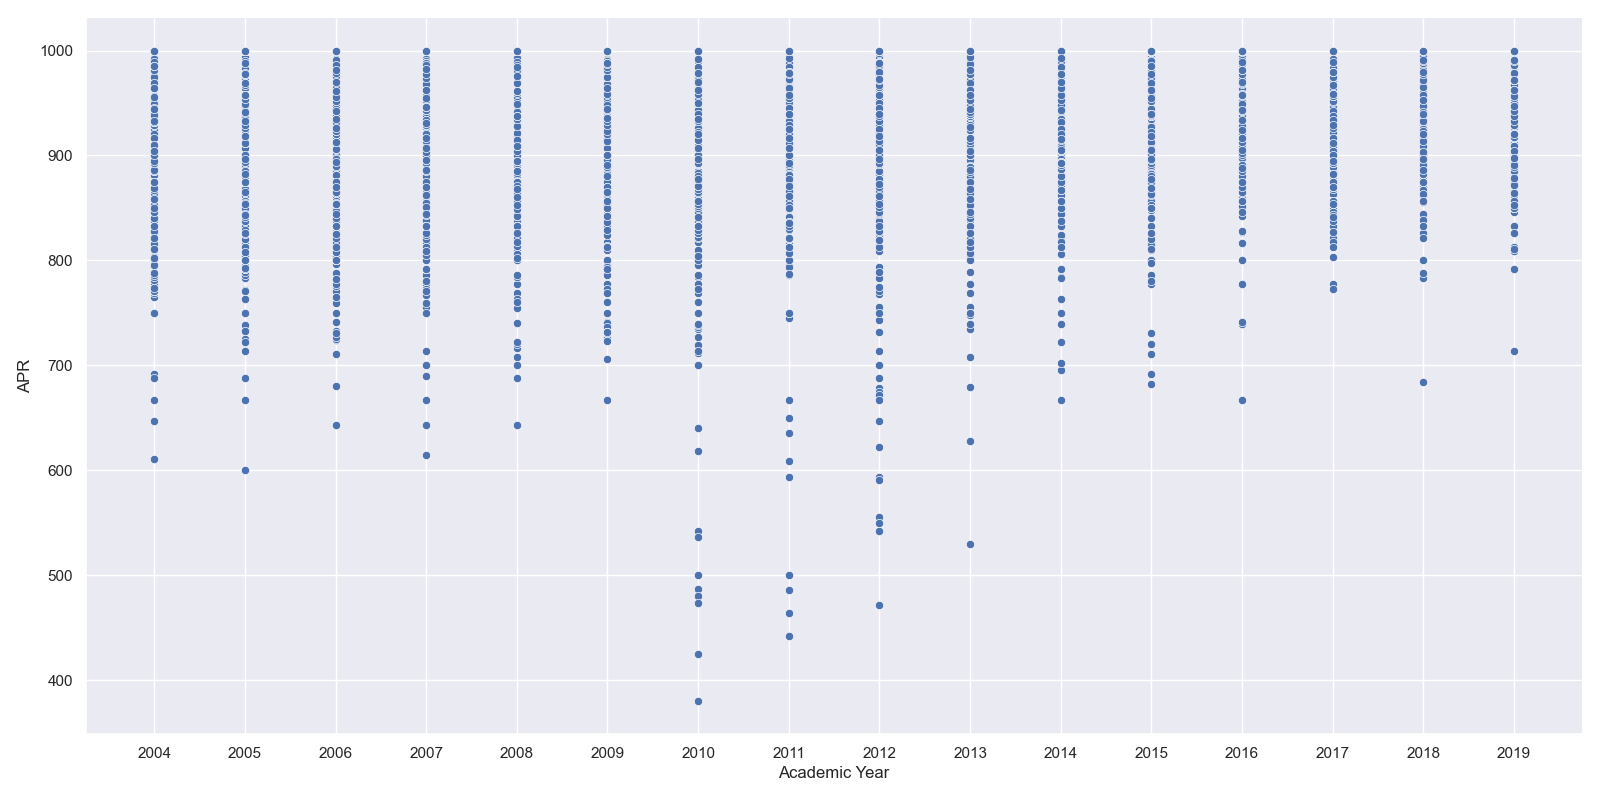
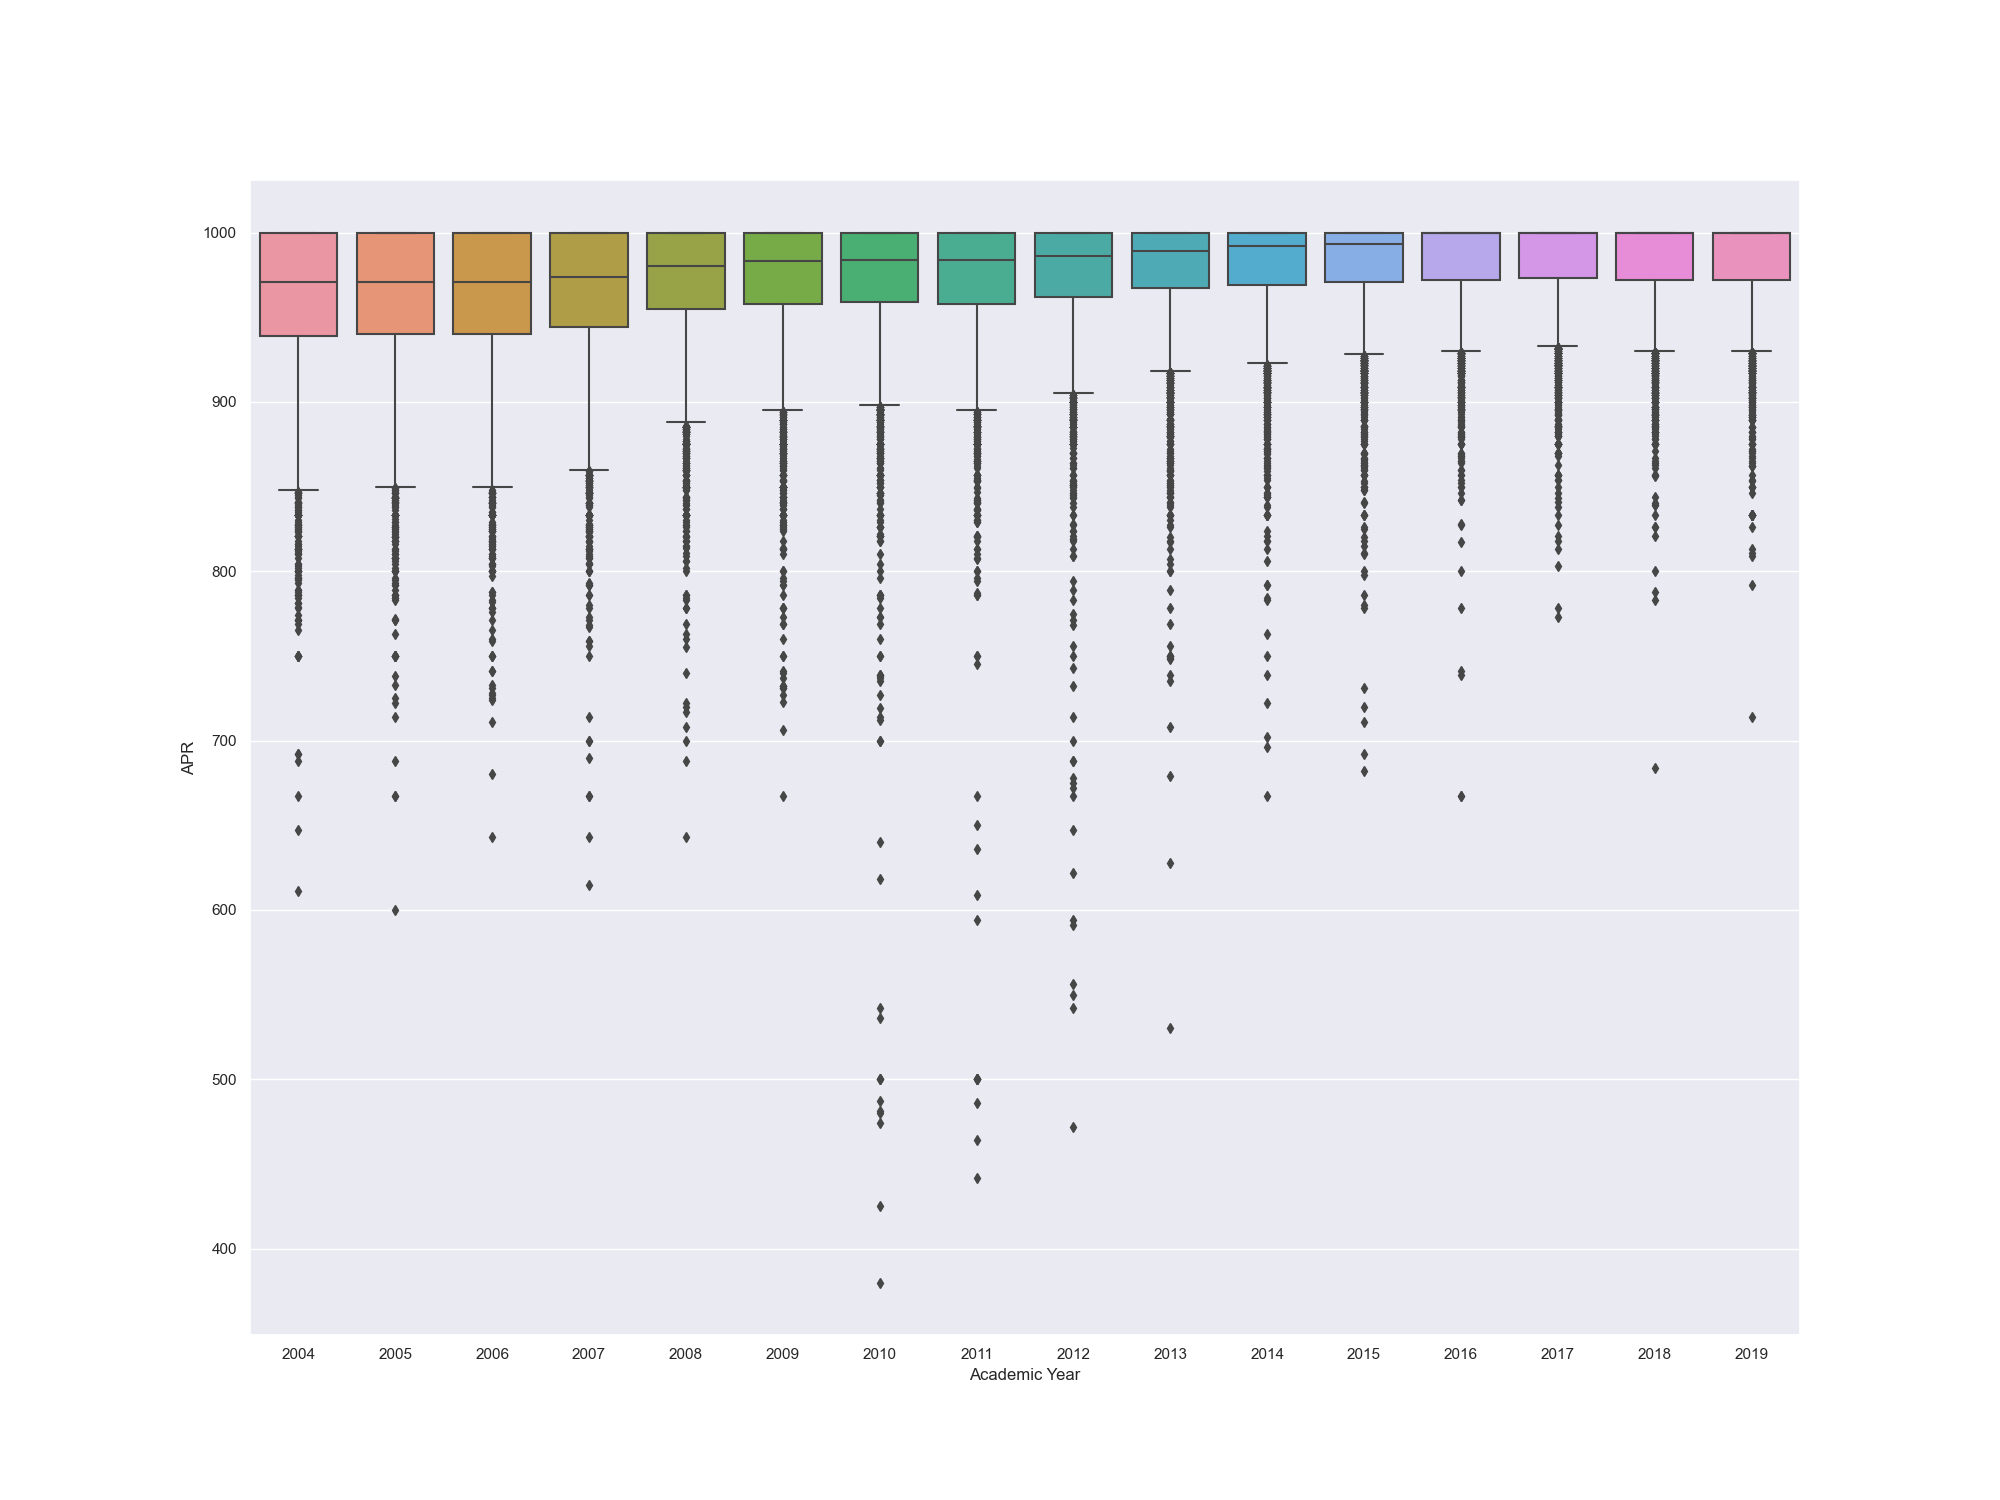
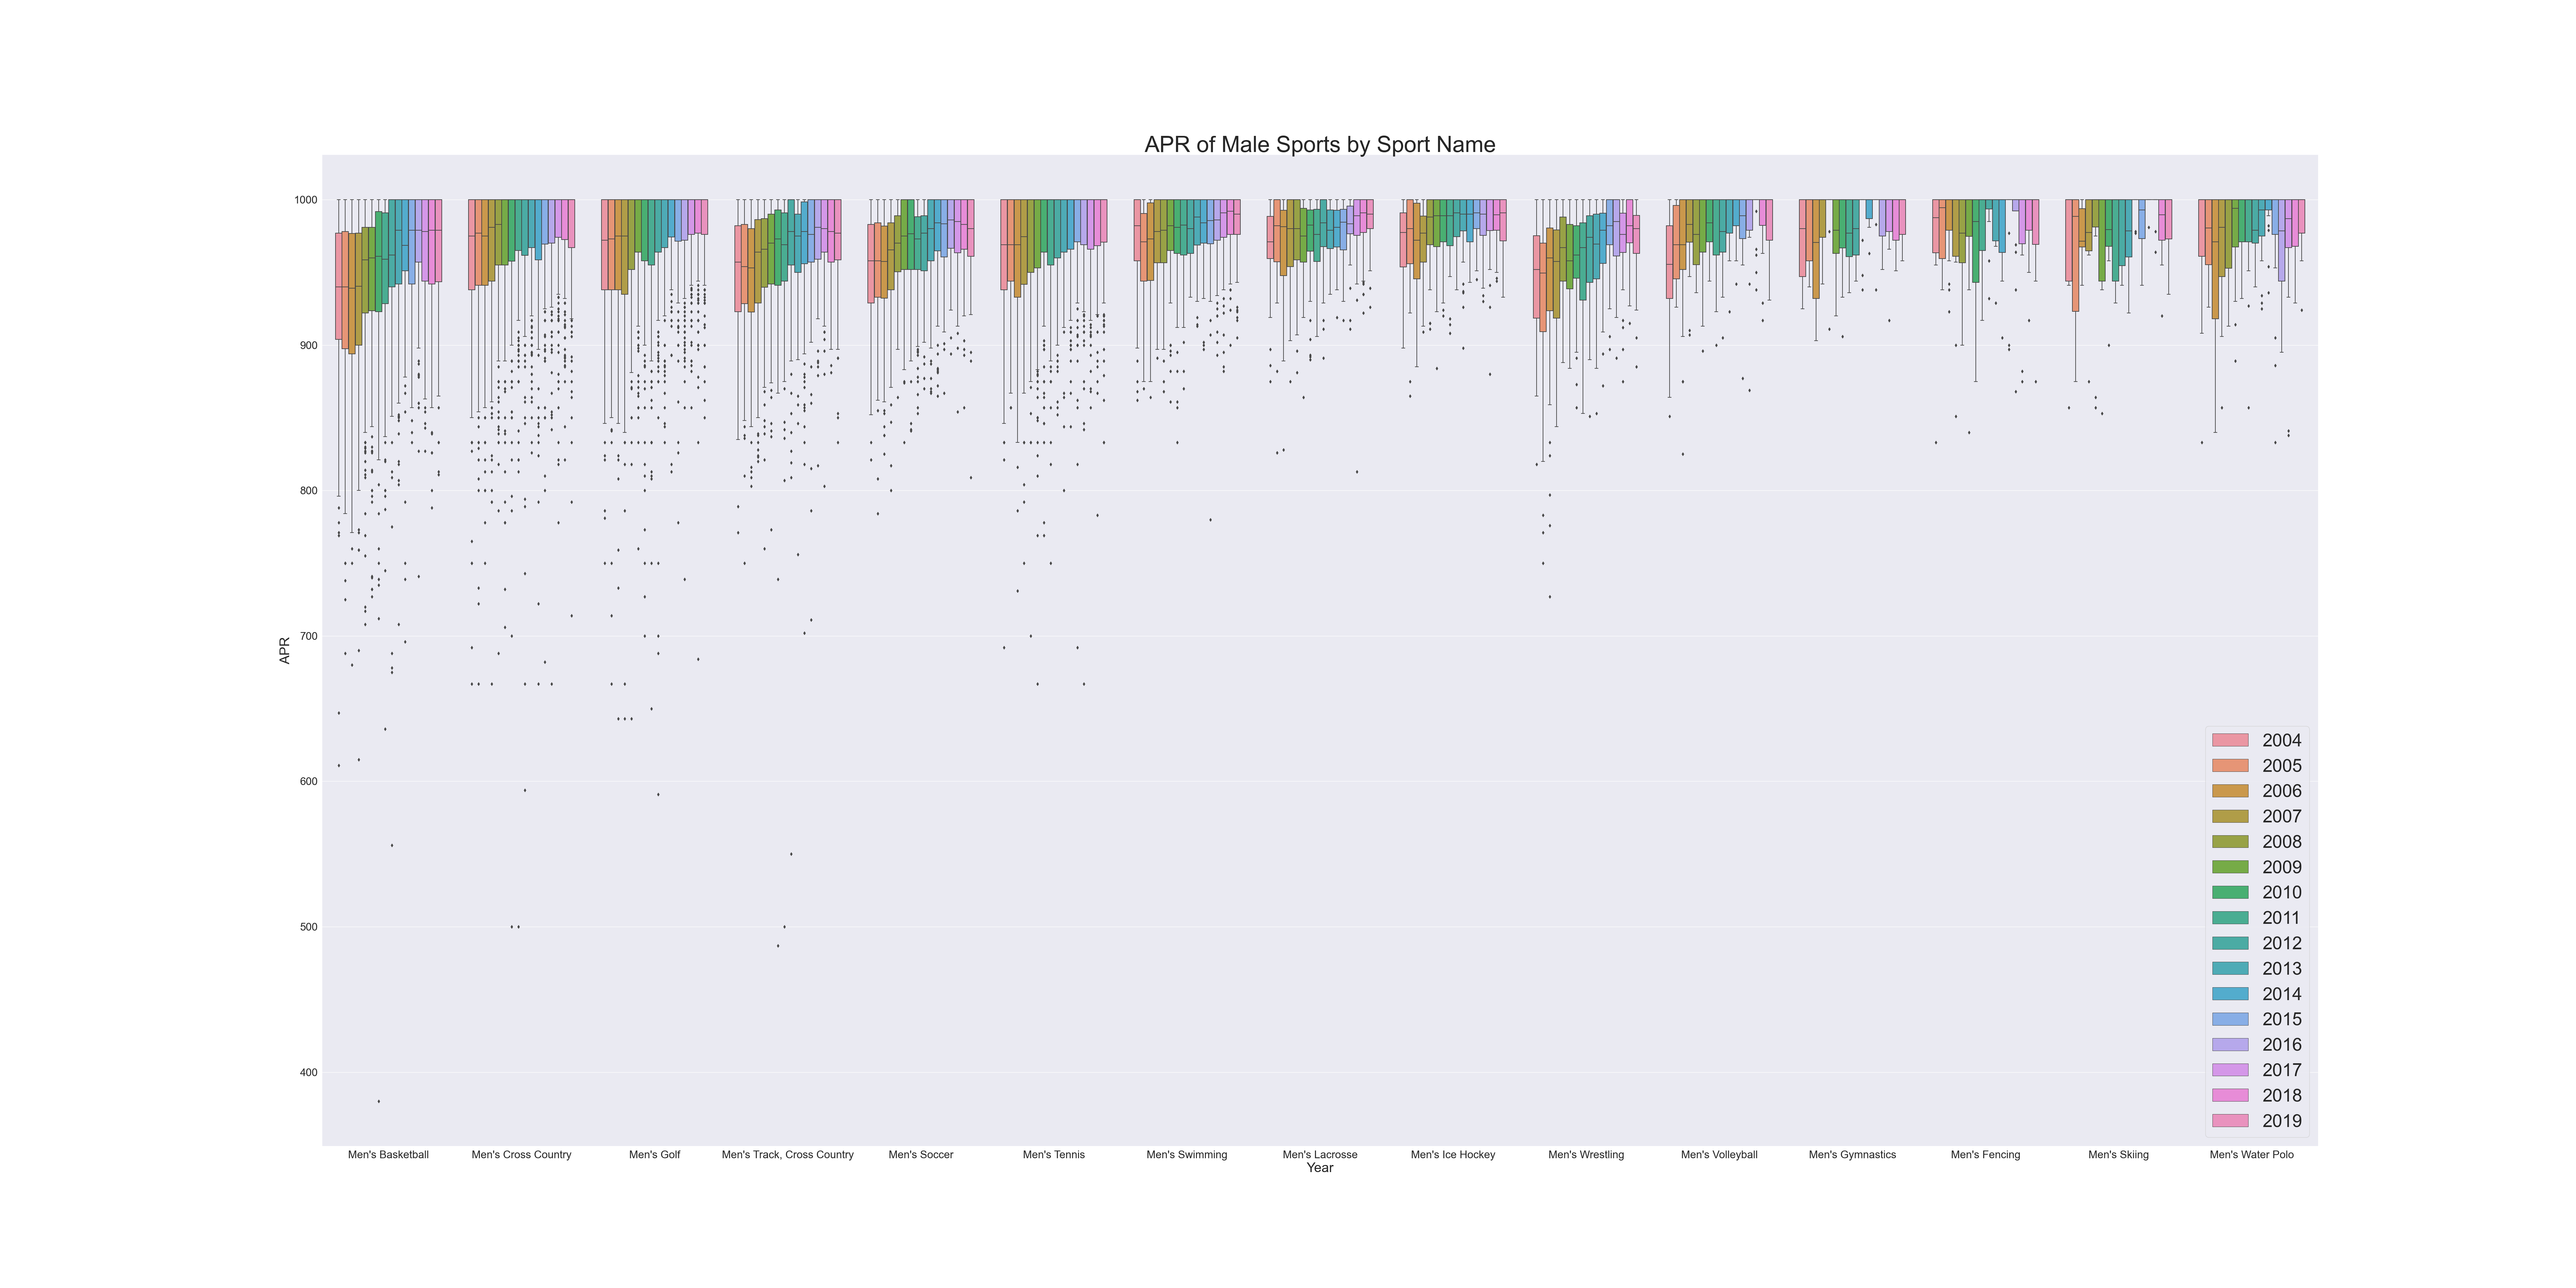
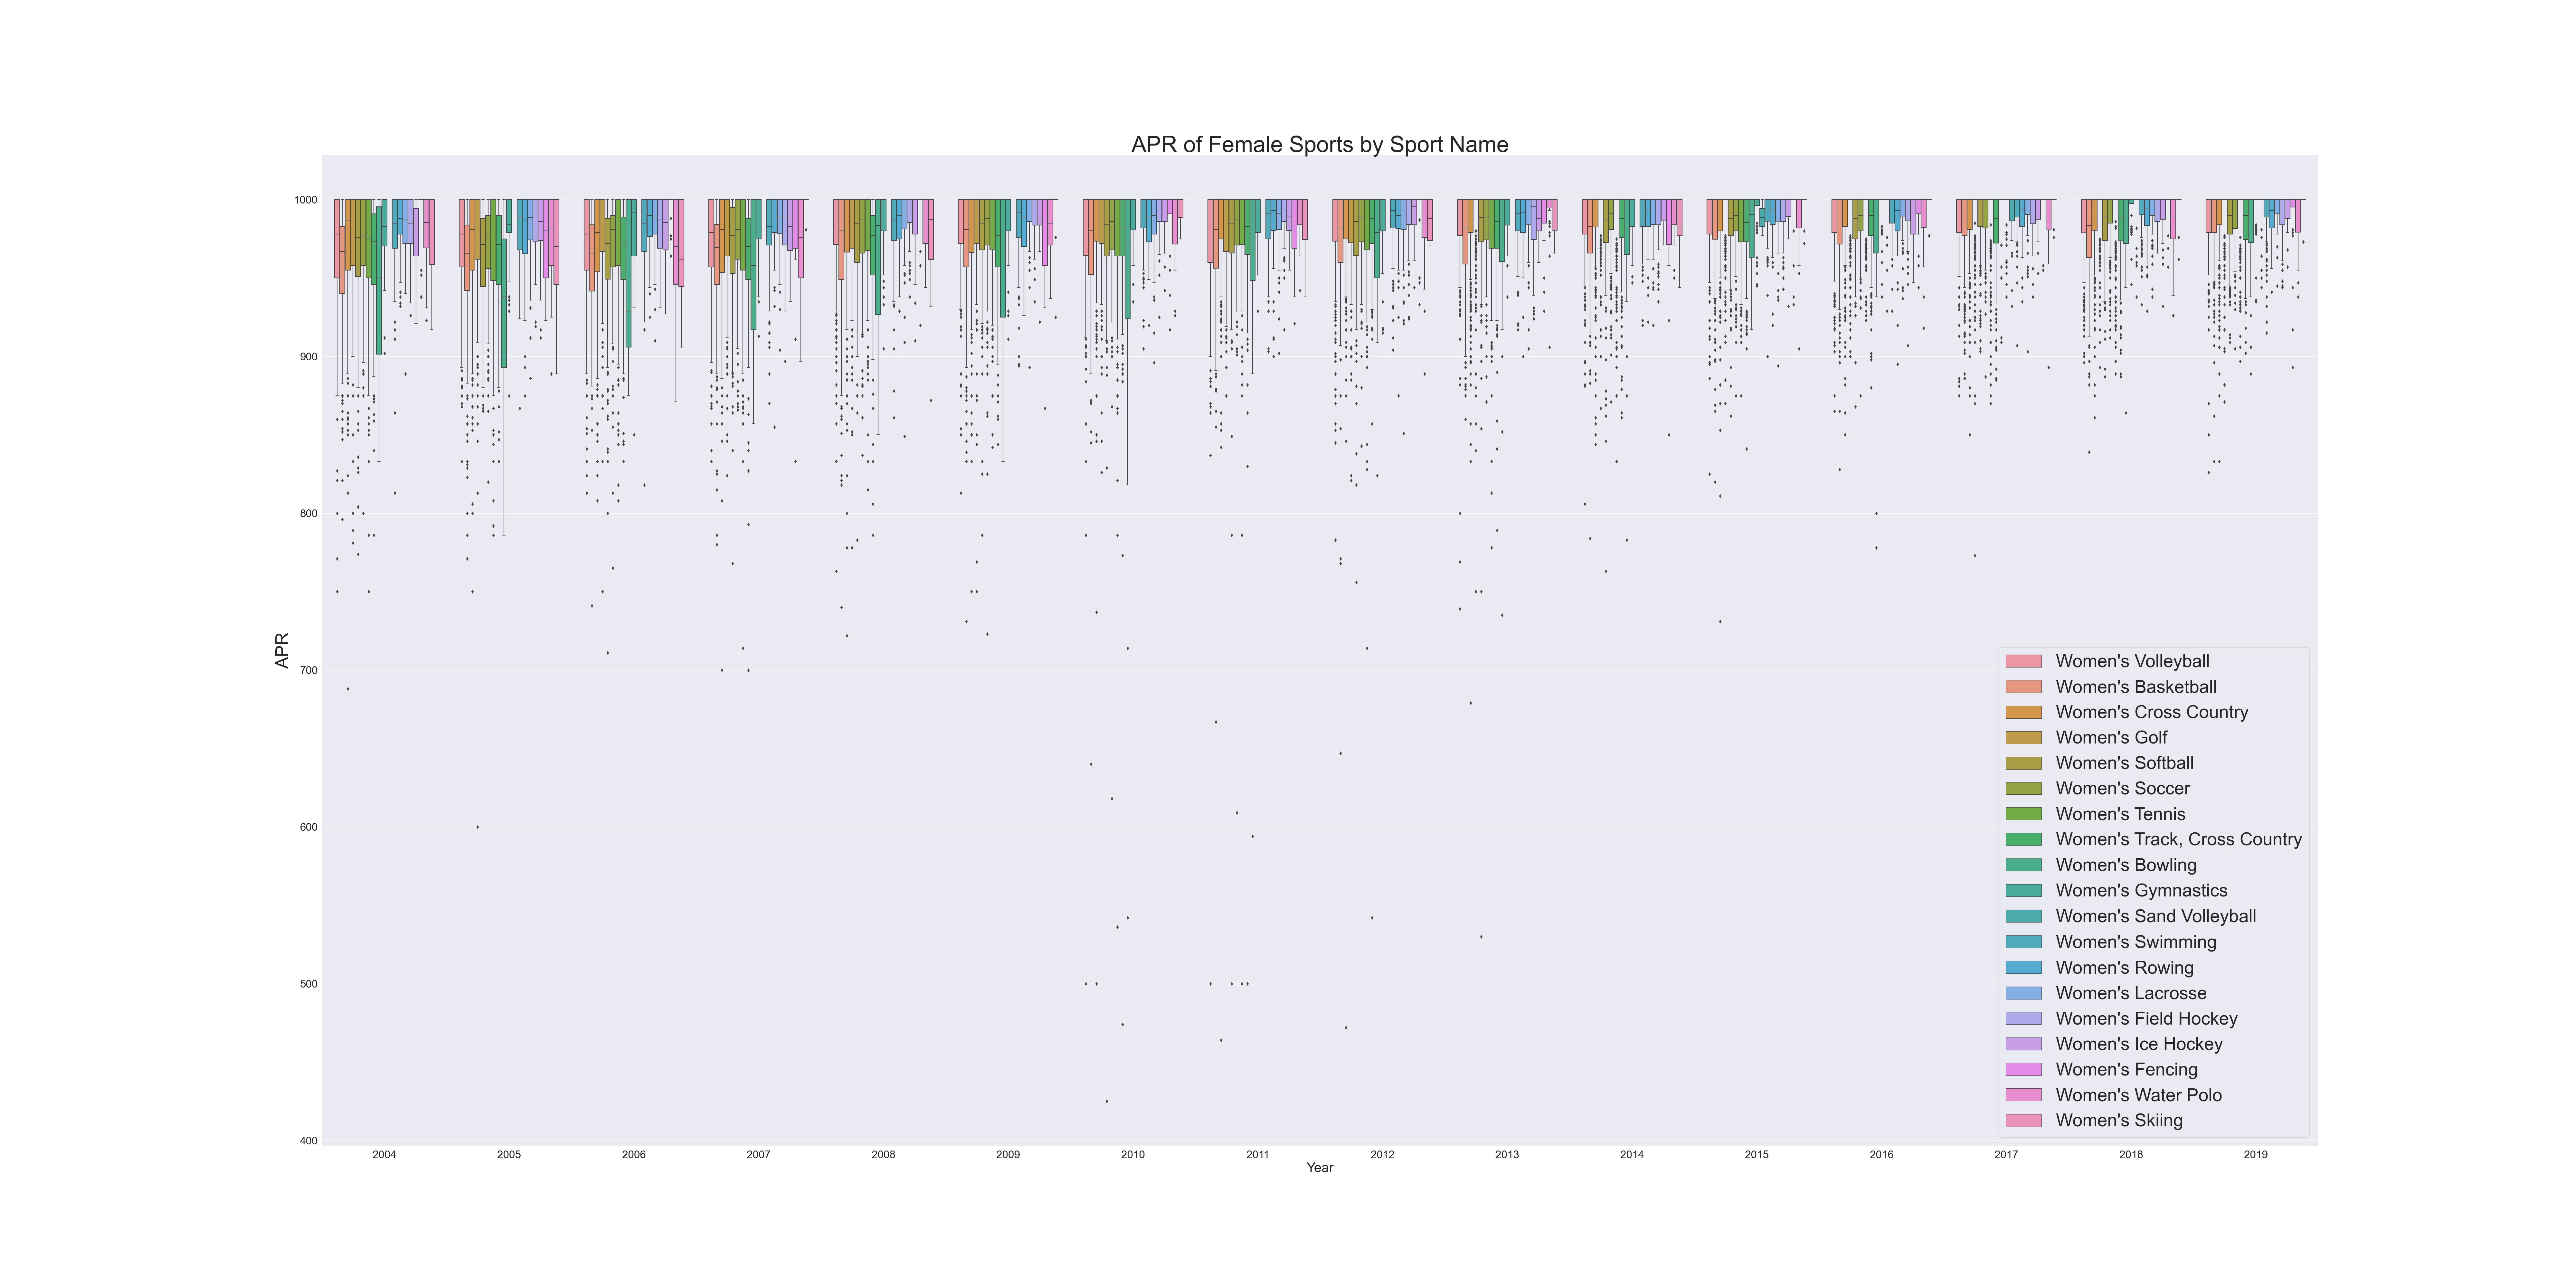
After run the main.py on VSCode, you can see there are 4 png files in the current folder : Relplot_Question1.png(Visualization for question1),Boxplot_Question1.png(Visualization for question1),Boxplotplot_Questino2.png(Visualization for question2), boxplot_Questino3_female.png(Visualization for question3), boxplot_Question3_male(Visualization for question3)
For the sake of DRY principle, the generation of plots for each questions are in Question1.py, Question2.py, Question3.py, respectively.
As for question 1, I genarated 2 plots to analyze our data(boxlot and relplot)
From the boxplot and relplot that we generated, we can see that the most outliers happenned from 2010 to 2012. This may be attributed to the Changes in the student-athlete population: The student-athlete population may have changed during this time period, for example, the institution may have started recruiting more student-athletes from underprivileged backgrounds or from less academically-prepared high schools. And the APRs from a wide range of institutions have gone up and only a few outliers were generated since 2012. To some extent, Improved compliance with NCAA policies(The NCAA may have increased its enforcement of APR regulations since 2012, which could have led to more teams achieving higher APR scores and fewer outliers on the boxplot) may be the cause of it. Also, we can note that the median of APR is gradually increasing over time. Here is a possible explanation: More resources for academic support: Many schools are providing more resources for academic support for student-athletes, suh as tutoring, study halls, and academic advisors. This increased support could be contributing to higher median APR scores.
I used boxplot() to analyze question 2, which seems more straightforward.
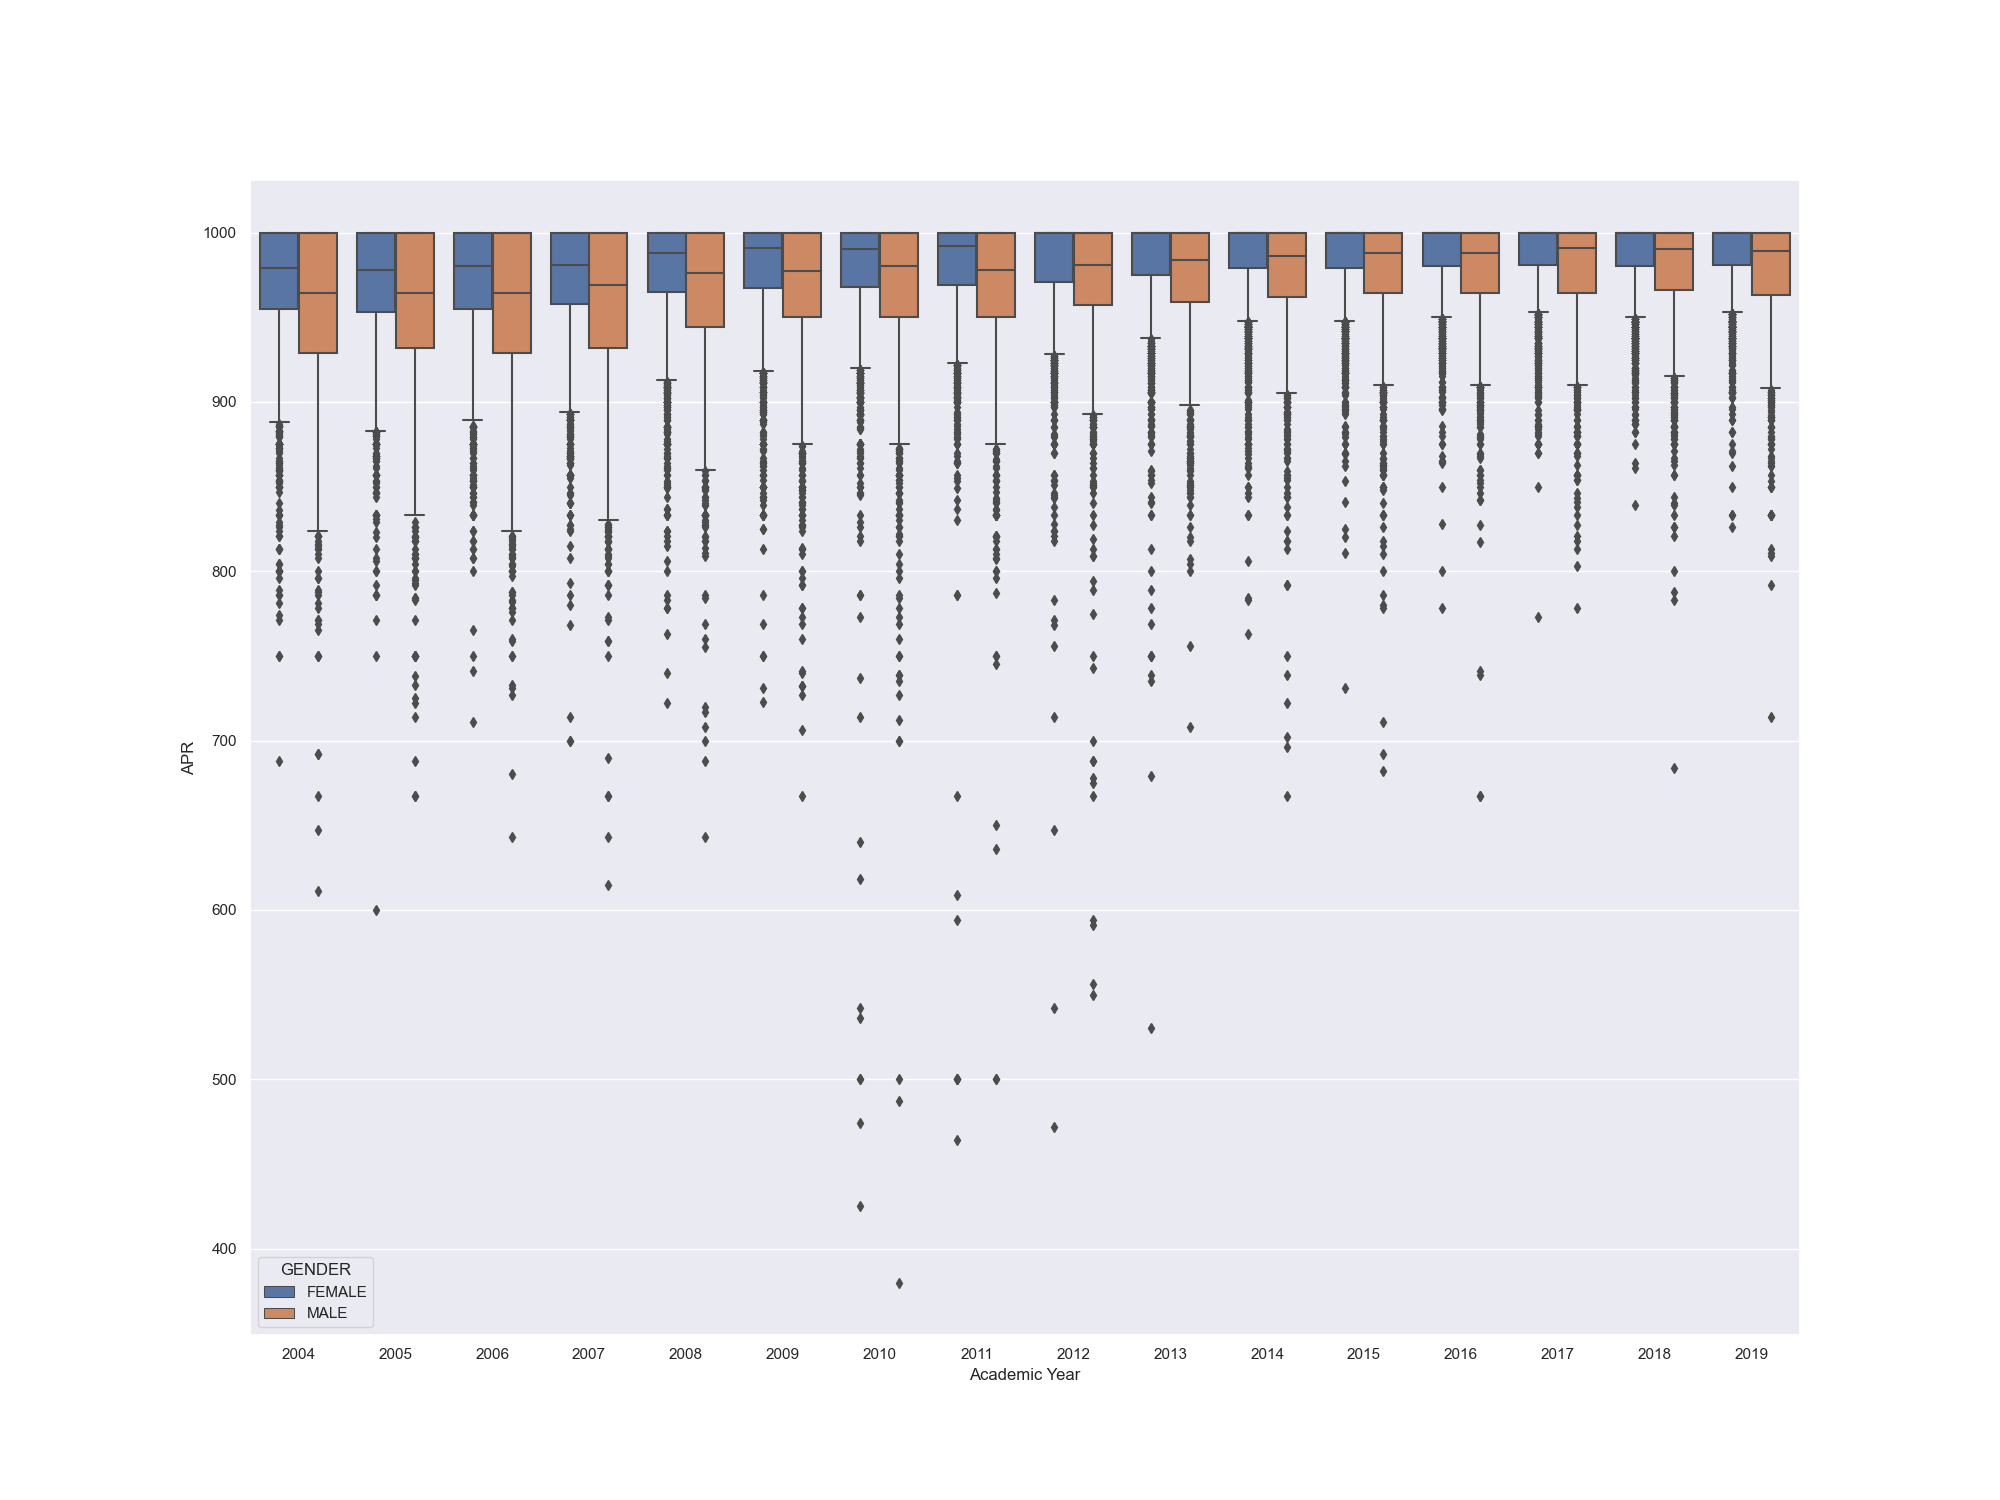
From the boxplot, we can safely reach the conclusion that APRs of all genders are gradually increasing. From my point of view, One possible reason for the gradual increase in APRs in NCAA sports of all genders from 2004 to 2019 could be the increased emphasis and focus on academic performance and accountability within college sports programs. The NCAA introduced the APR in 2004 as a way to measure the academic progress and success of student-athletes, and since then, many schools and programs have implemented stricter academic policies and initiatives to improve their APR scores. Additionally, the NCAA has implemented penalties for teams with low APR scores, which may have also motivated schools to prioritize academics more. Another possible reason could be the increased focus on student-athlete welfare and well-being, which includes academic success as a key component.
In addition, the median of famale's APRs is always higher than that of Male's, which indicate the differences in sport distribution: The distribution of sports between male and female student-athletes is not equal, and some sports may be more academically demanding than others. For example, female student-athletes may be more likely to participate in sports that have a greater emphasis on academic performance, such as gymnastics, while male student-athletes may be more likely to participate in sports that are more physically demanding, such as football or basketball.
I used boxplot() to analyze question 3, which seems more straightforward.
- Male:
- Female:
