The purpose of this project was to cluster different types of cryptocurrencies using unsupervised machine learning. In order to do so, a CSV file was sourced from CryptoCompare and its data was cleaned up.
First, the data was pre-processed for PCA. The data dimensions were then reduced using PCA before the cryptocurrencies were finally clustered using K-means.
After using PCA and deciding on 3 principal components, the following 3D scatter plot was produced using Plotly:
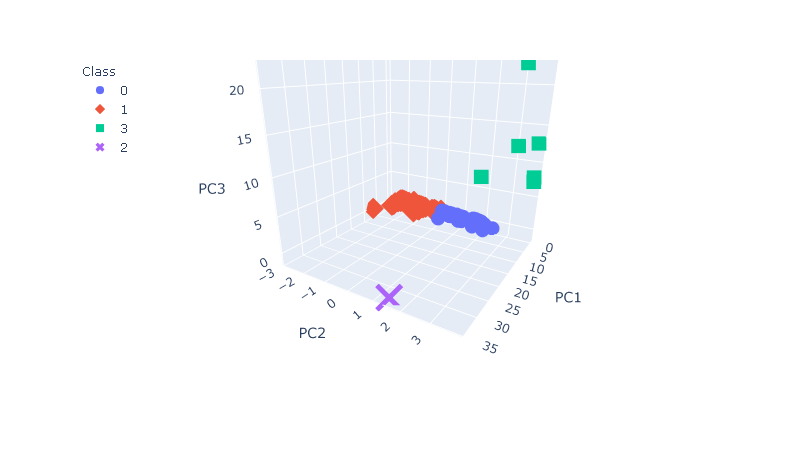
The interactive scatter plot is available in the jupyter notebook.
A table was created using hvplot. It includes all the tradable cryptocurrencies and their data.

The full table is accessible in the jupyter notebook as well.
Lastly, hvplot was used to produce a scatter plot showing the cryptocurrencies clusters distributed by mined coins and total supply.
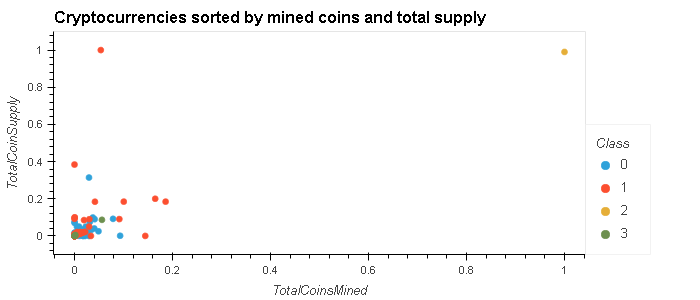
This plot also has an interactive version of it in the jupyter notebook.