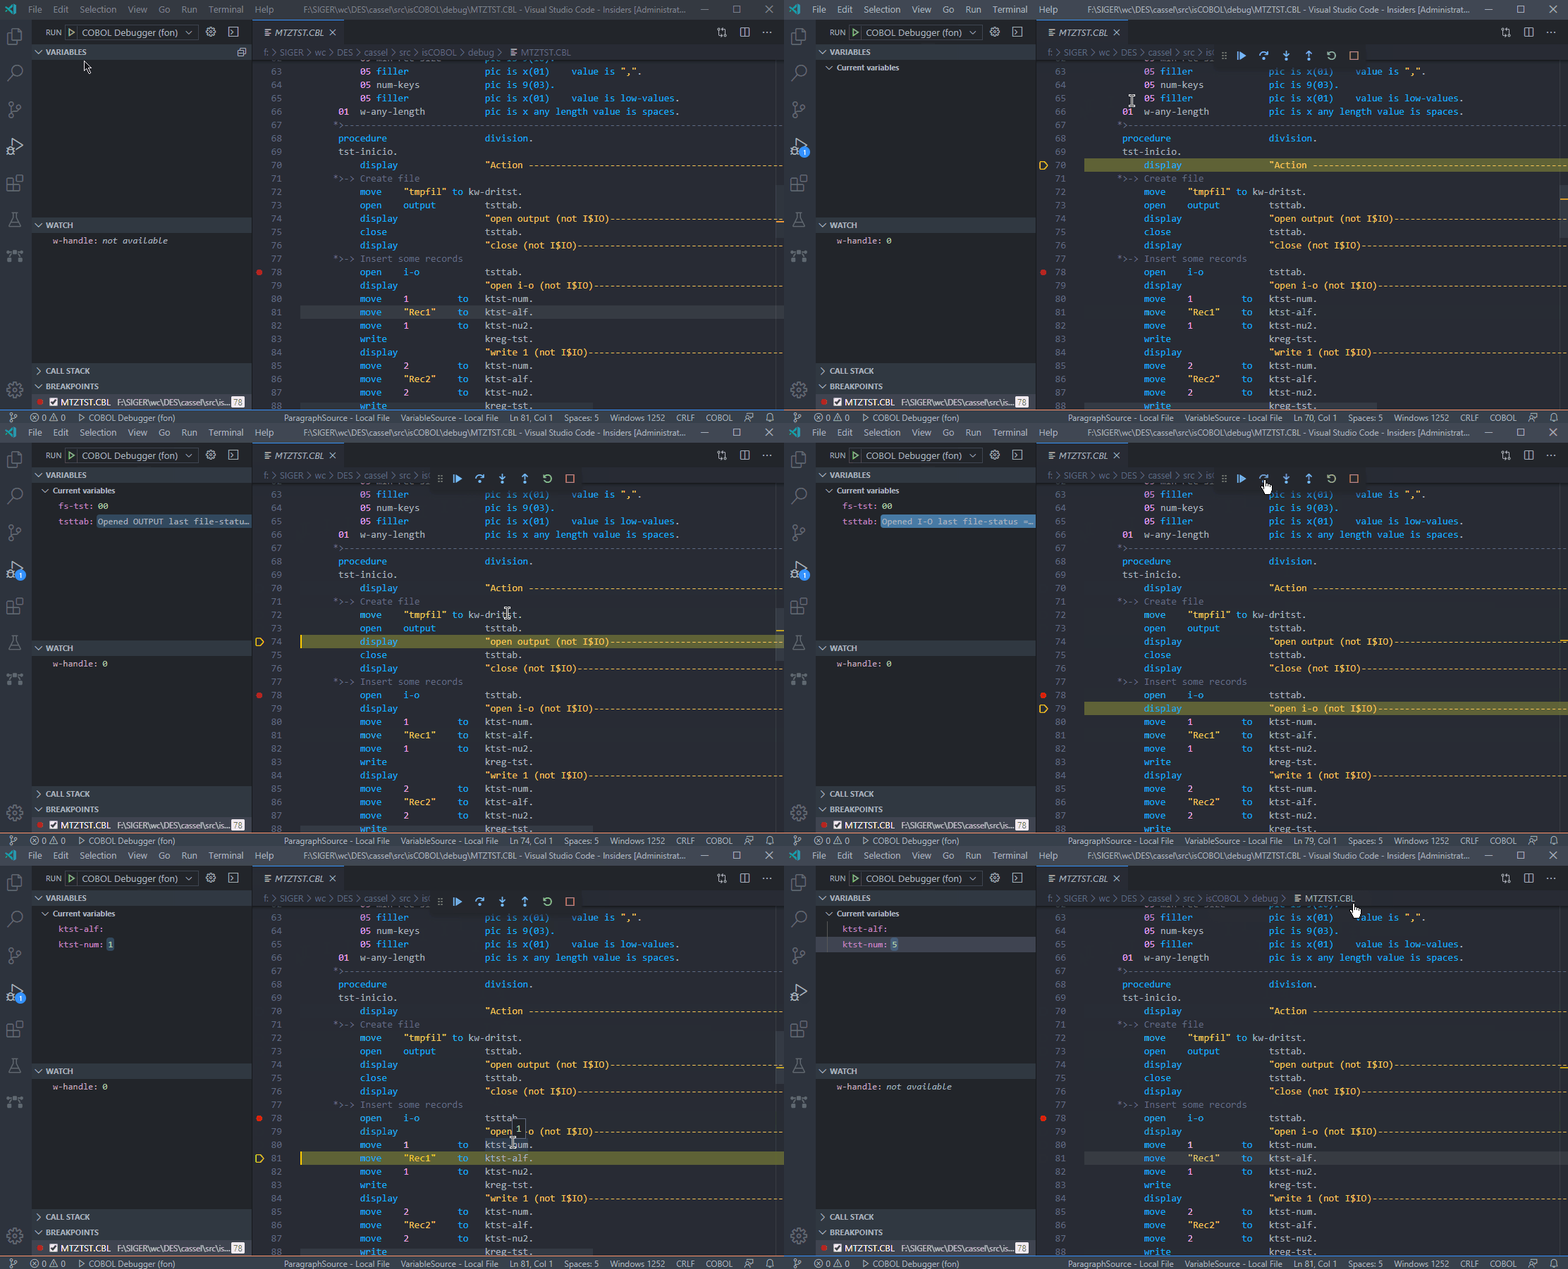
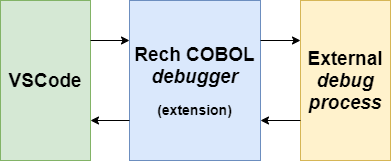
This extension allows debugging COBOL files through VSCode along with an external command-line debugging process, mapping UI actions to commands on the external process. The output of each command is captured from debugging process and shown on VSCode UI in many ways, like in Variable Watch or Hover.
The overall architecture is shown below:
The goal of this extension is to provide a general-purpose debug adapter for any COBOL compiler.
By default, the extension responds to isCOBOL command-line debugger (ISDBG). You can specify your own configuration file with custom command names and regular expressions so this extension works with different COBOL compilers.
For example: suppose that, on COBOL 'A' the command step is used to run the current statement and go to the next line, while on COBOL 'B' the command execute is used to do the exact same thing. The table below shows an example of different COBOL command line debuggers, requiring different command names and providing different outputs, but doing the same thing: running the current statement and going to the next line.
| COMMAND | OUTPUT | ||
|---|---|---|---|
| COBOL 'A' | step | Current statement: line:10 -> C:\fonts\MySource.cbl | |
| COBOL 'B' | execute | Stopped at line 10 and file C:\fonts\MySource.cbl |
Here is an example of configuration for COBOL 'A':
	"executeCurrentStatement": {
		"name": "step",
		"successRegularExpression": "\\s+Current\\s+statement:\\s+line:(?<linenumber>\\d+)\\s+->\\s+(?<path>[\\w\\.:\\\/ \\-]+)"
	},
Here is an example of configuration for COBOL 'B':
	"executeCurrentStatement": {
		"name": "execute",
		"successRegularExpression": "\\s+Stopped\s+at\s+line\s+(?<linenumber>\d+)\s+and\s+file\s+(?<path>[\\w\\.:\\\/ \\-]+)"
	},
IMPORTANT: remember that, on JSON files, you need to escape backslash with another backslash, so this is why '\\s+' appears with double backslash. Also notice that some commands, like the one shown above, requires regular expression with named groups: group 'linenumber' is related to line number and group 'path' is related to file path. If you specify a custom regular expression, please keep the groups with these names, although they don't need to be in any specific order.
The default configuration file is defaultDebugConfigs.json located on project root. To provide custom commands, copy this file to any folder on your computer, rename the way you prefer and define the path to this file at rech.cobol.debug.externalDebugConfigs setting.
If you use a different COBOL compiler, please help us improve this extension! Tell us whether or not your command-line debugger is already supported. We are open to Pull Requests too!
The path to command-line debugger executable needs to be defined at rech.cobol.debug.commandLine setting, as follows:
"rech.cobol.debug.commandline": "C:\\debugger\\isdbg.exe $1",
You can ask user for specific questions before external debugger is started. Each question corresponds to the respective index on command line:
"rech.cobol.debug.commandline": "isdbg.exe $1 $2",
"rech.cobol.debug.params": [
    "Program name",
    "Sample question for second parameter",
]
You can specify as many questions as needed.

