Access the interactive dashboard here: Data Viz Lab 4 on PythonAnywhere
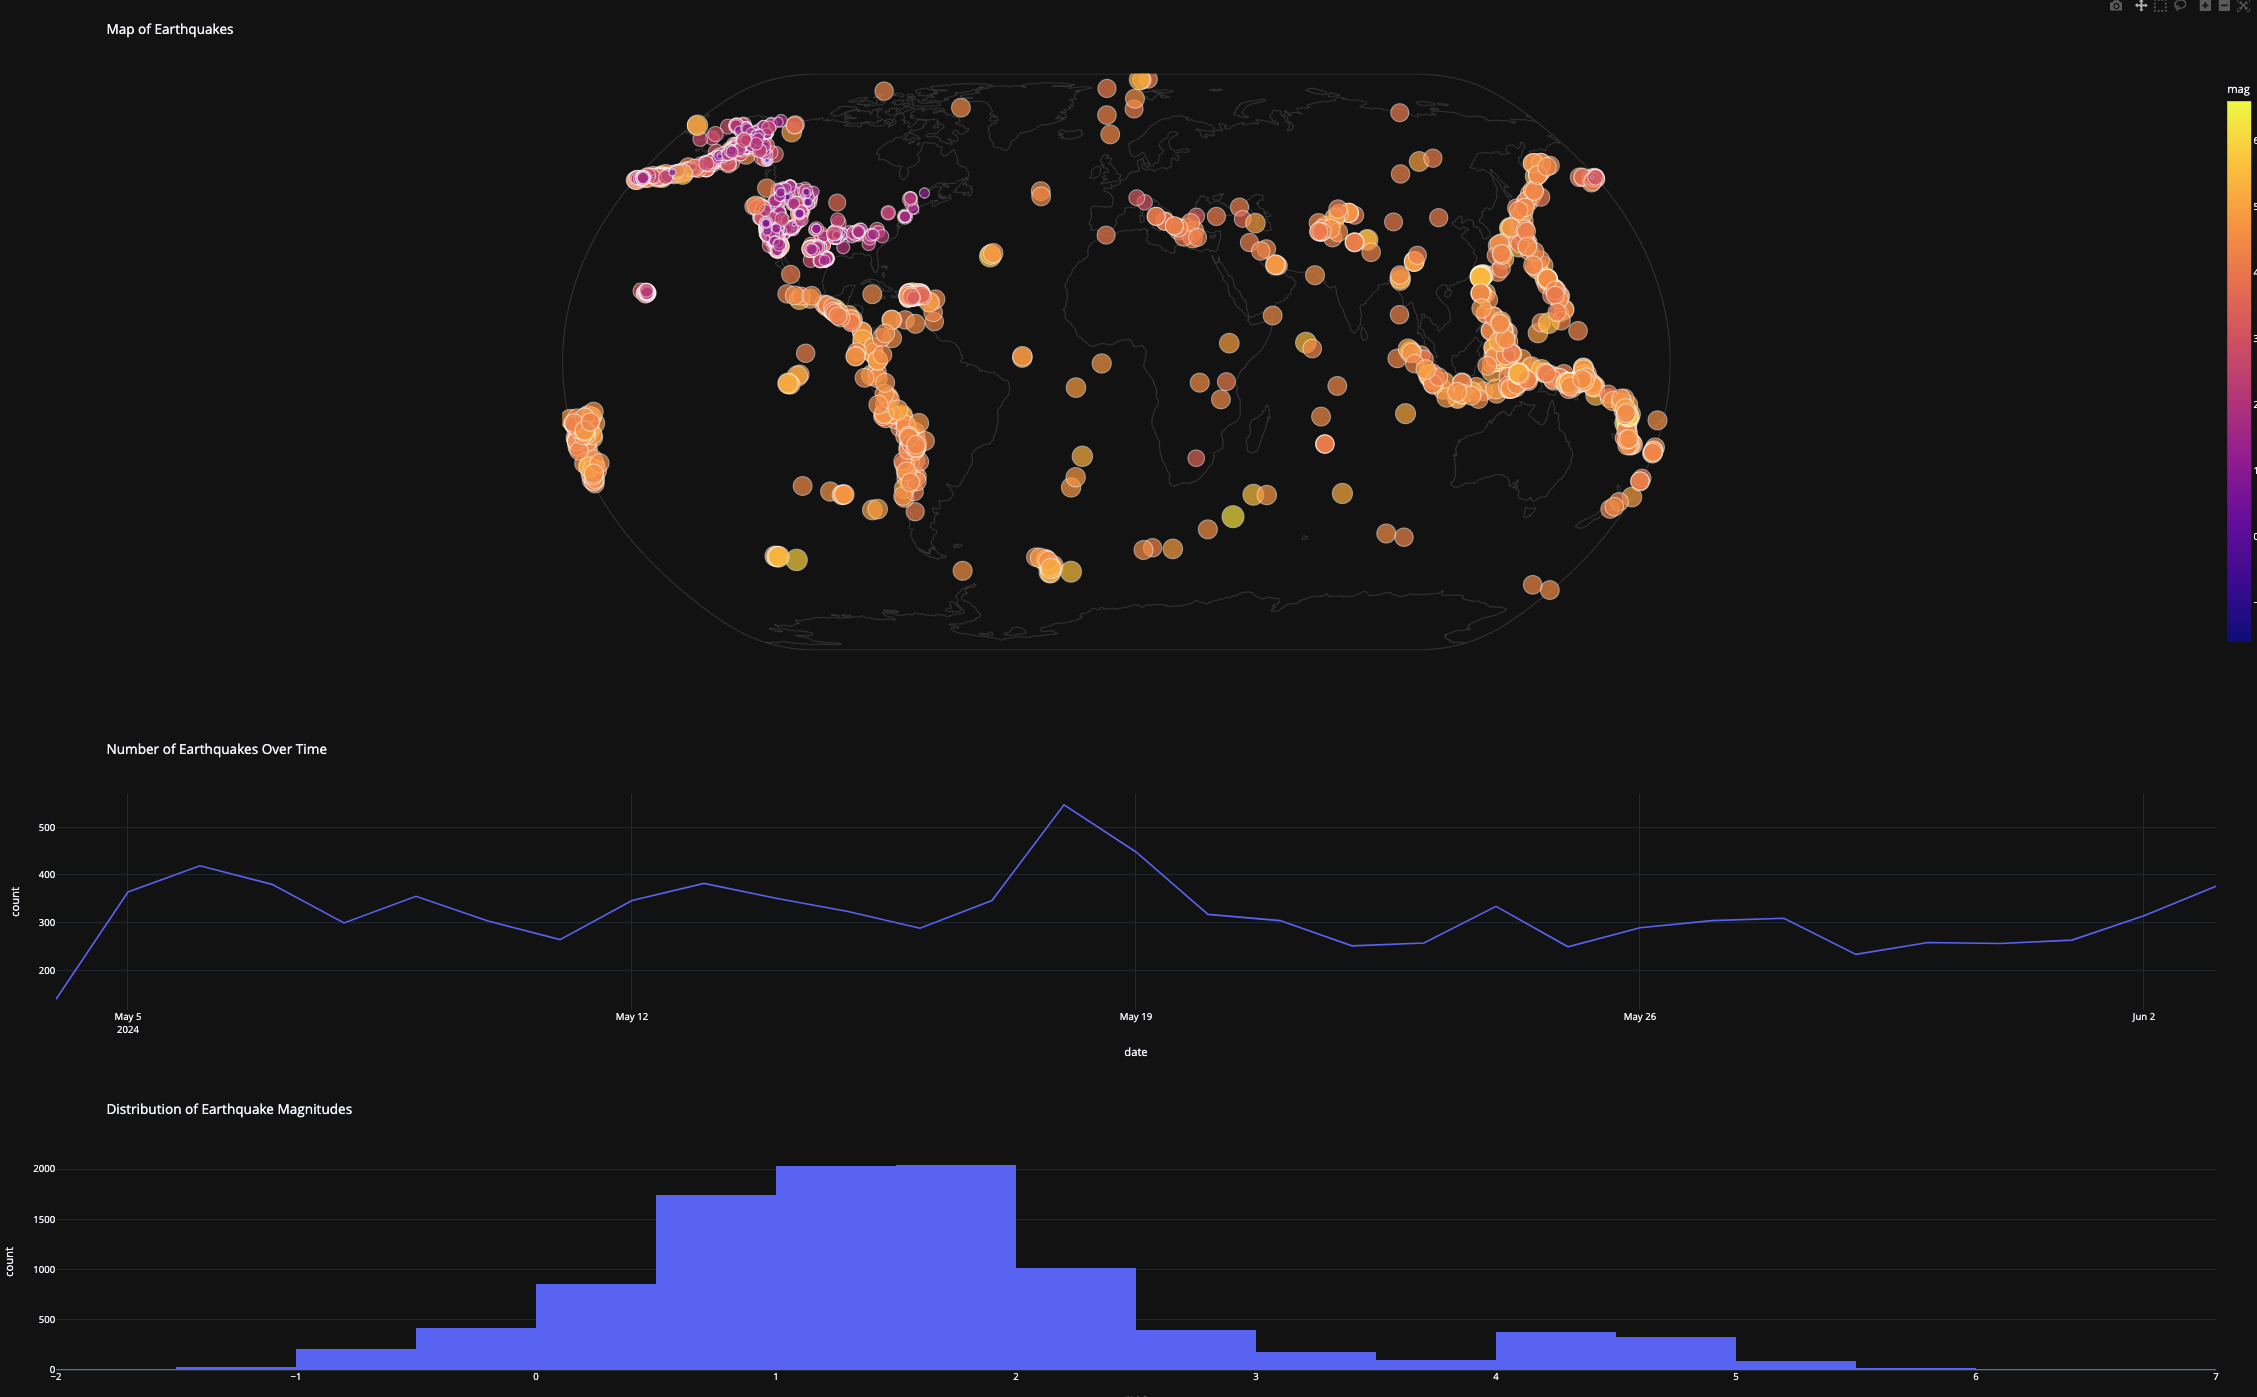
This repository contains an interactive web application developed with Dash for visualizing earthquake data. It demonstrates advanced data visualization techniques and user interactivity.
The application is deployed on PythonAnywhere, a free hosting platform that supports Python applications. This allows users to access the visualization without local setup. The deployment might be slower depending on the dataset's size, but this can be mitigated by techniques like data resampling or narrowing the scope of data with filters.
app.py: Contains the main Dash application setup, layout, and callback definitions.requirements.txt: Lists all necessary Python libraries for replicating the app environment.notebooks/: Contains Jupyter notebooks with research code for initial data exploration and analysis.data/: Directory for the earthquake data used in the application.
- Interactive Components:
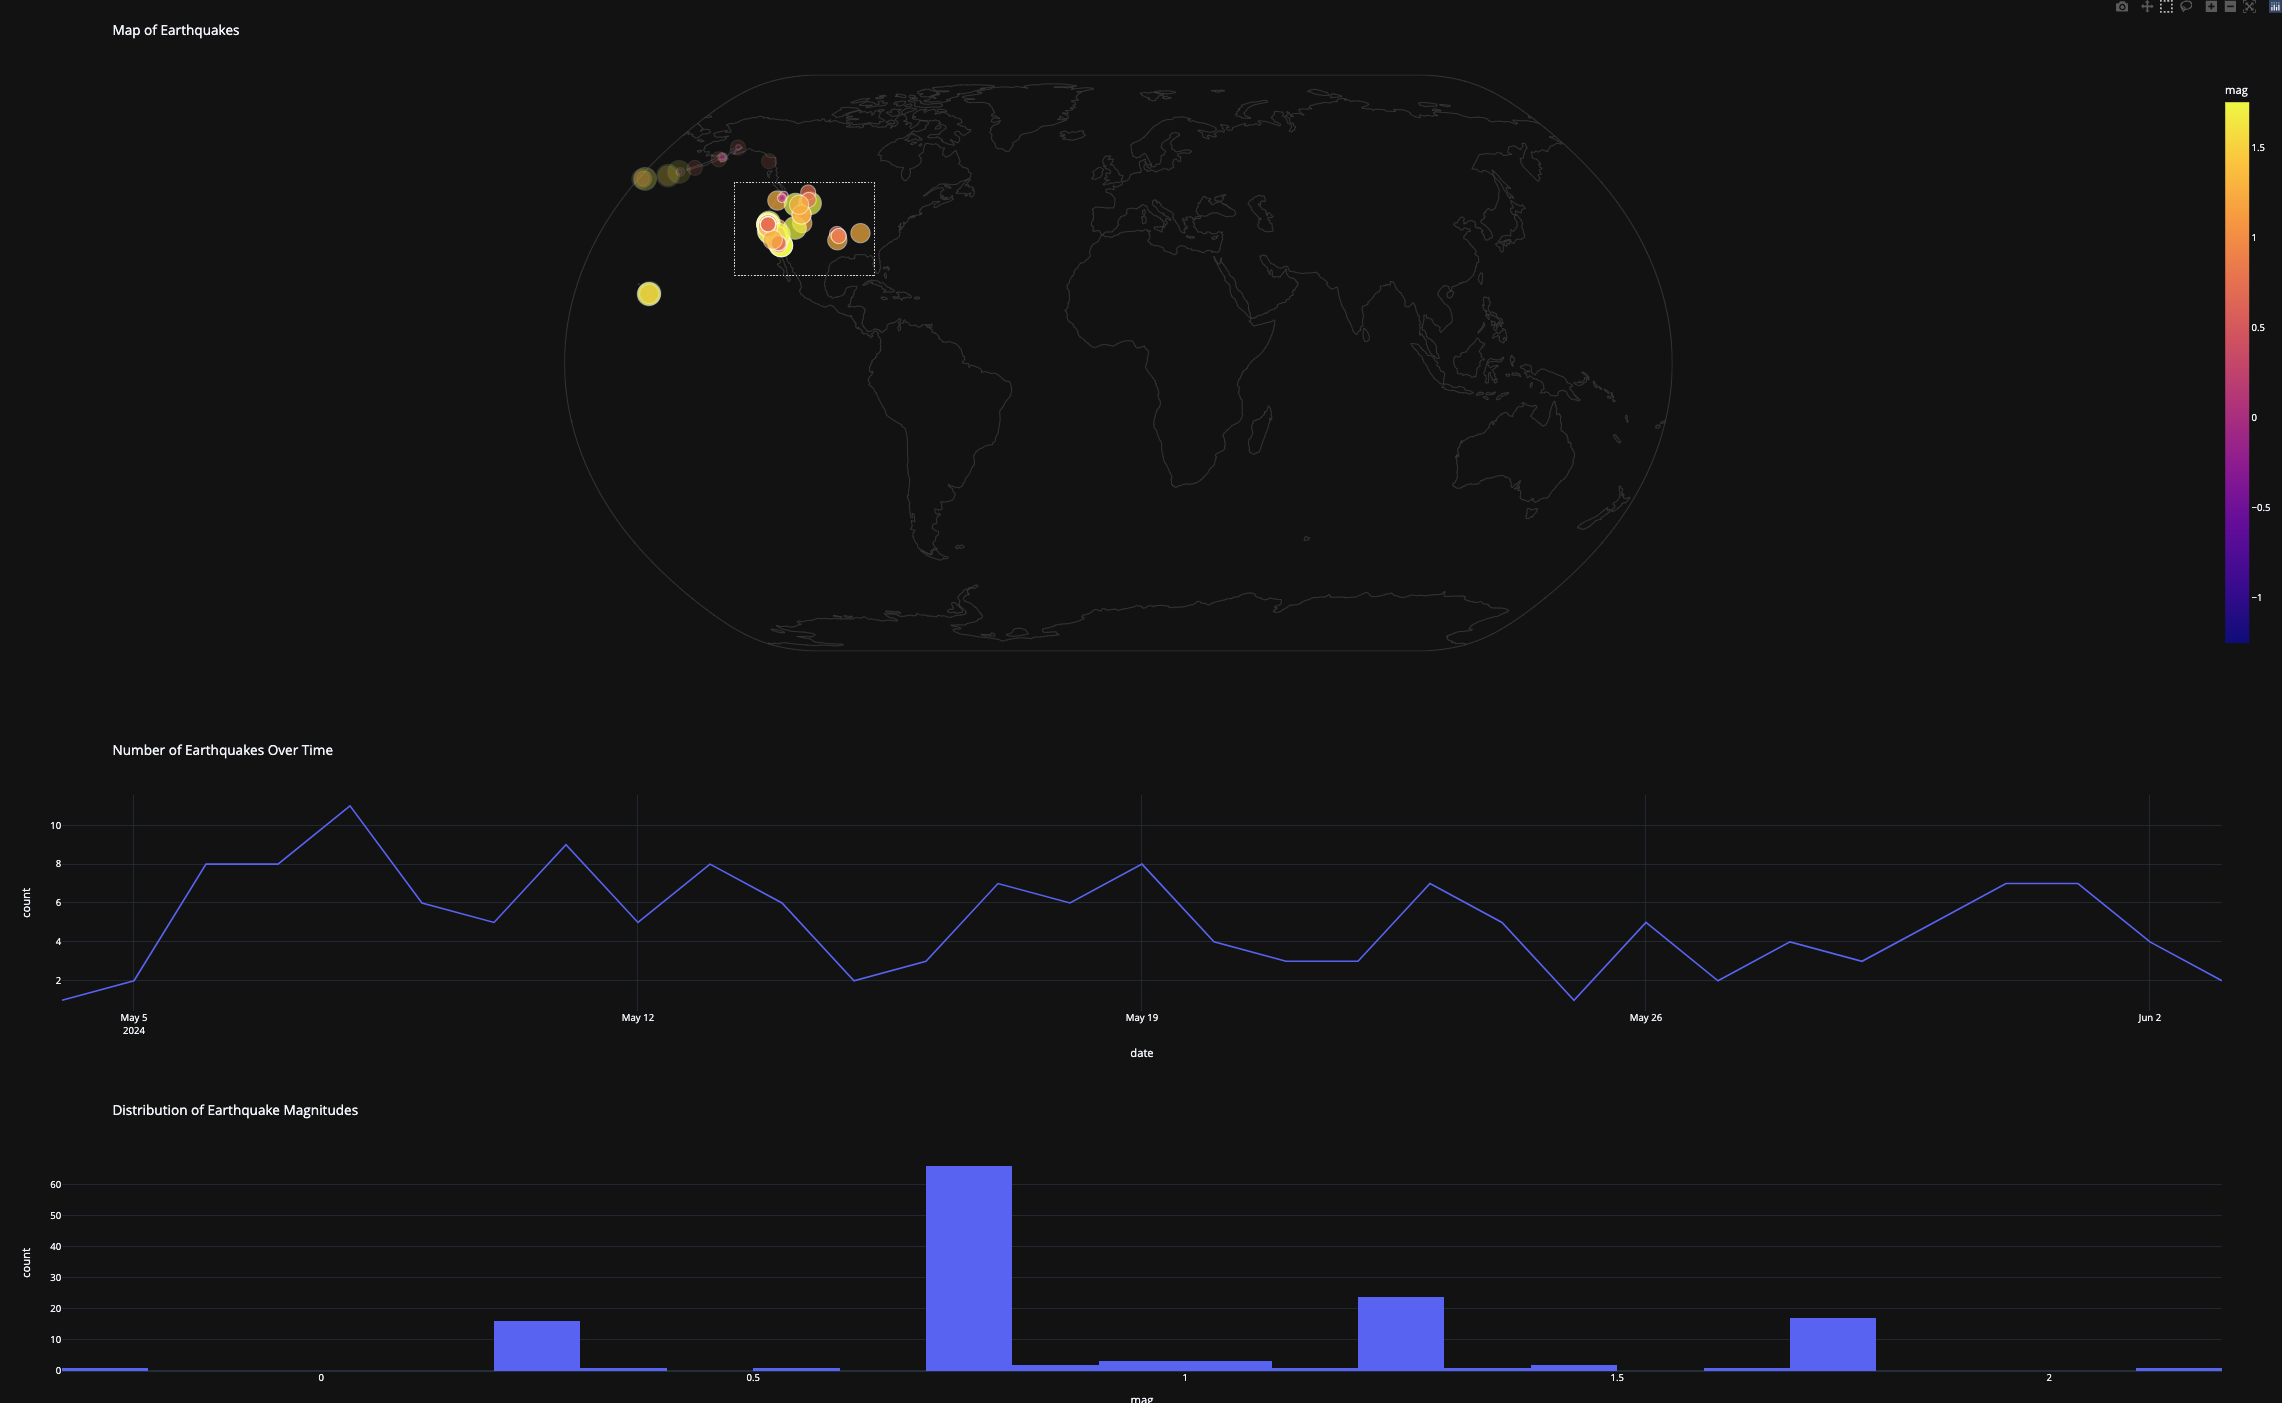
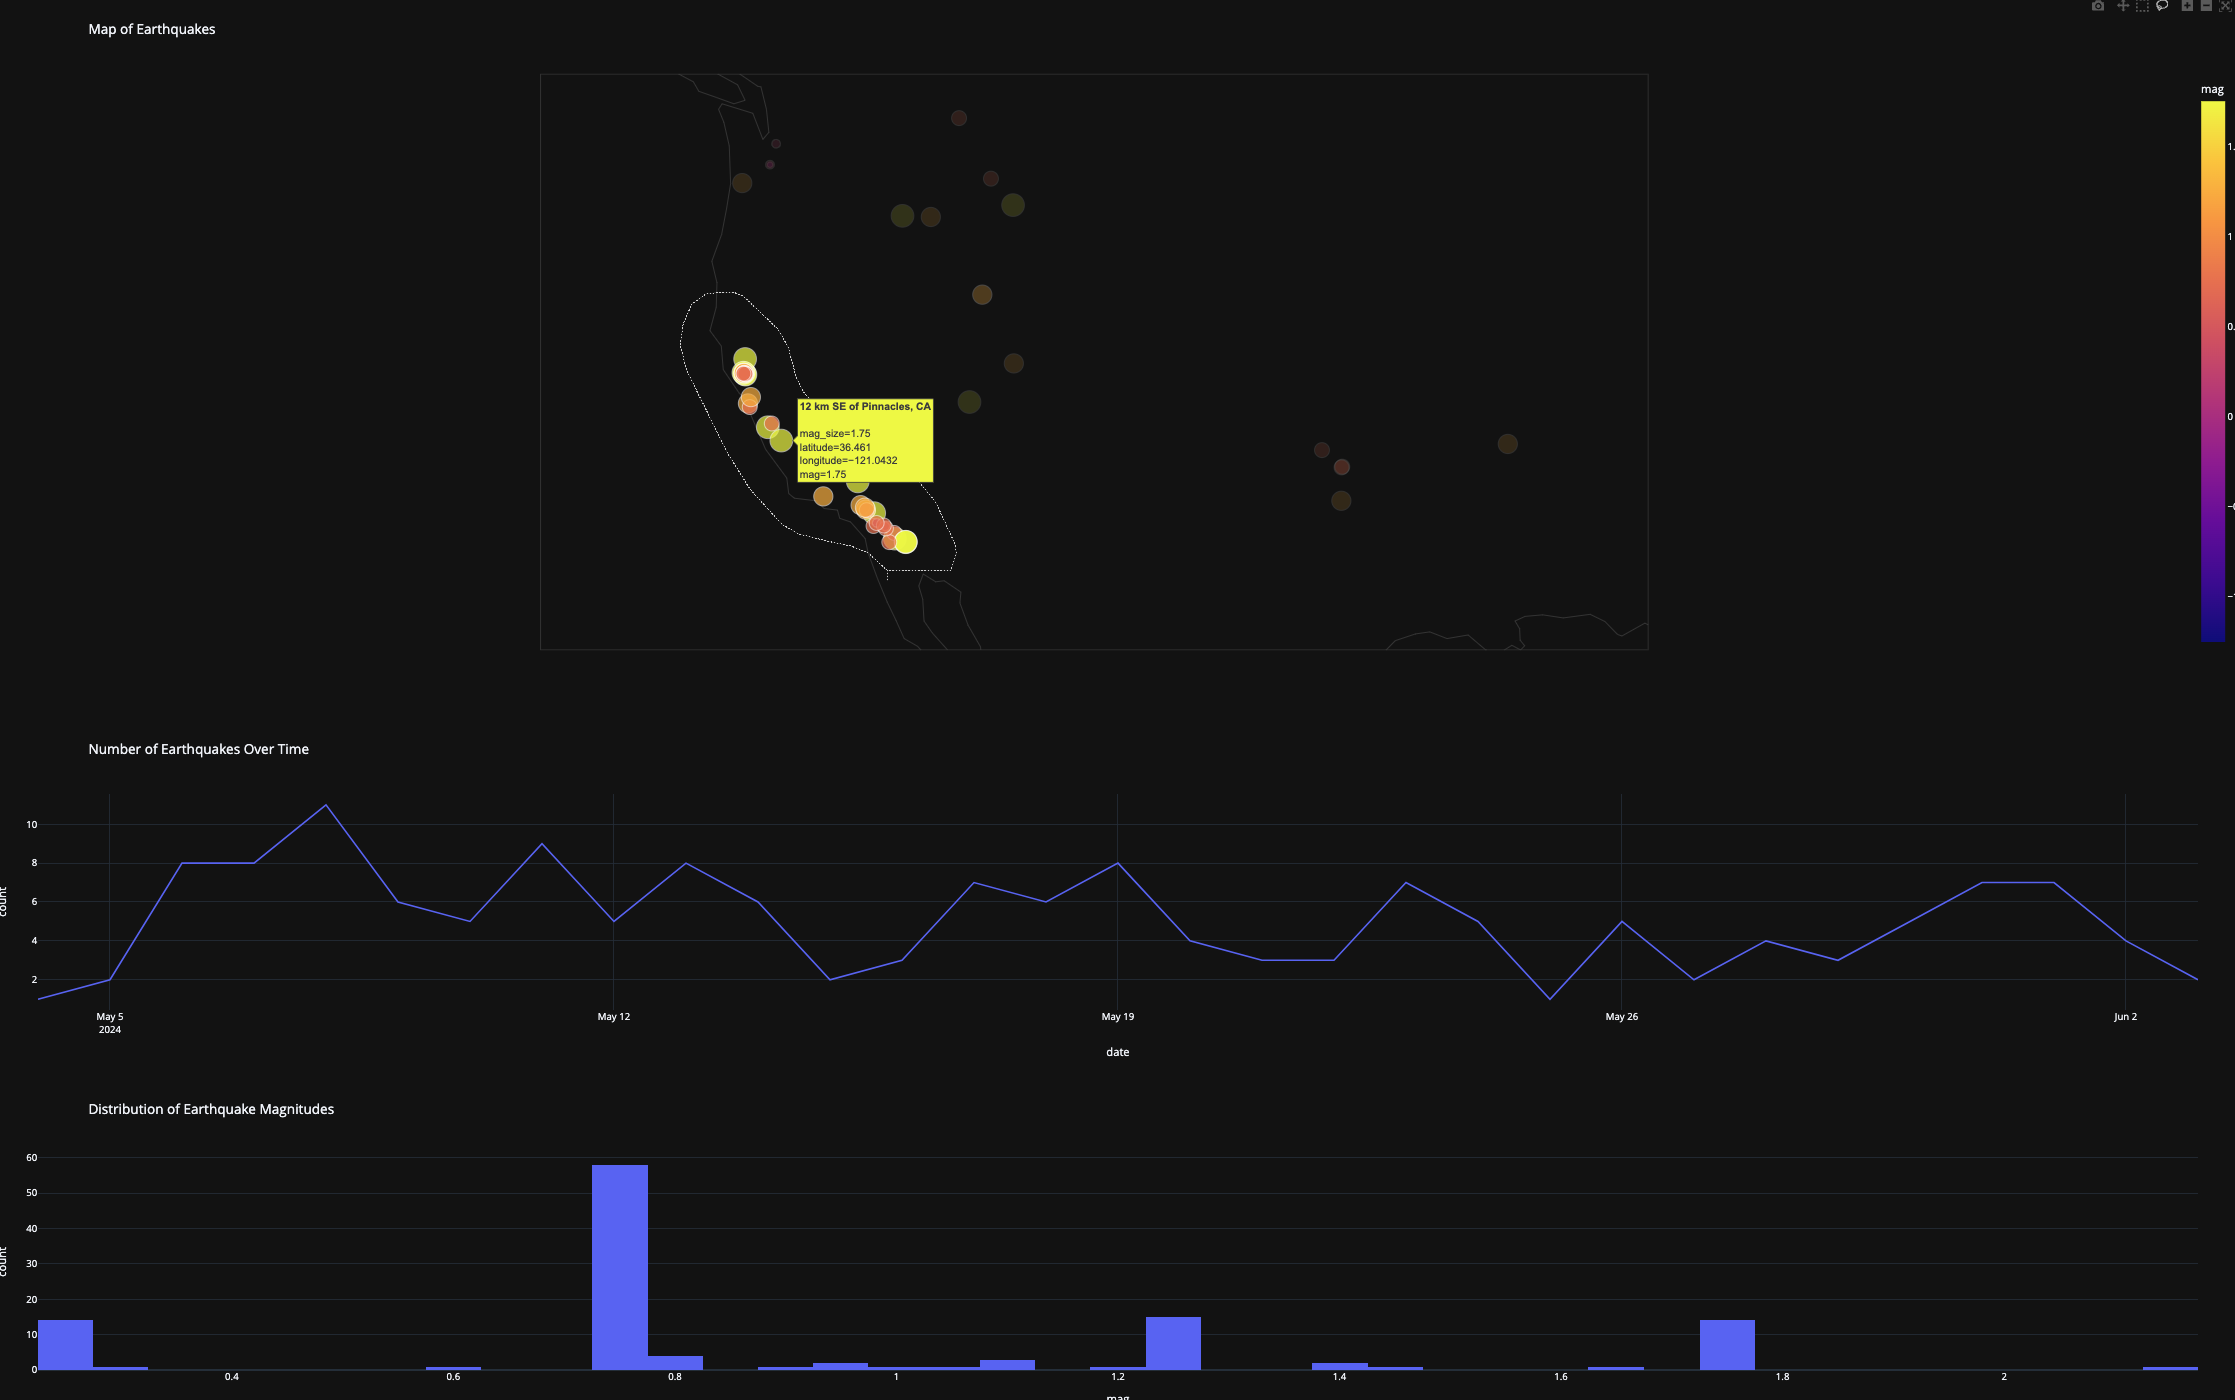
- Map View: Use box select to highlight specific earthquake regions.
- Time Series Plot: Use Plotly's zoom tool to select time ranges.
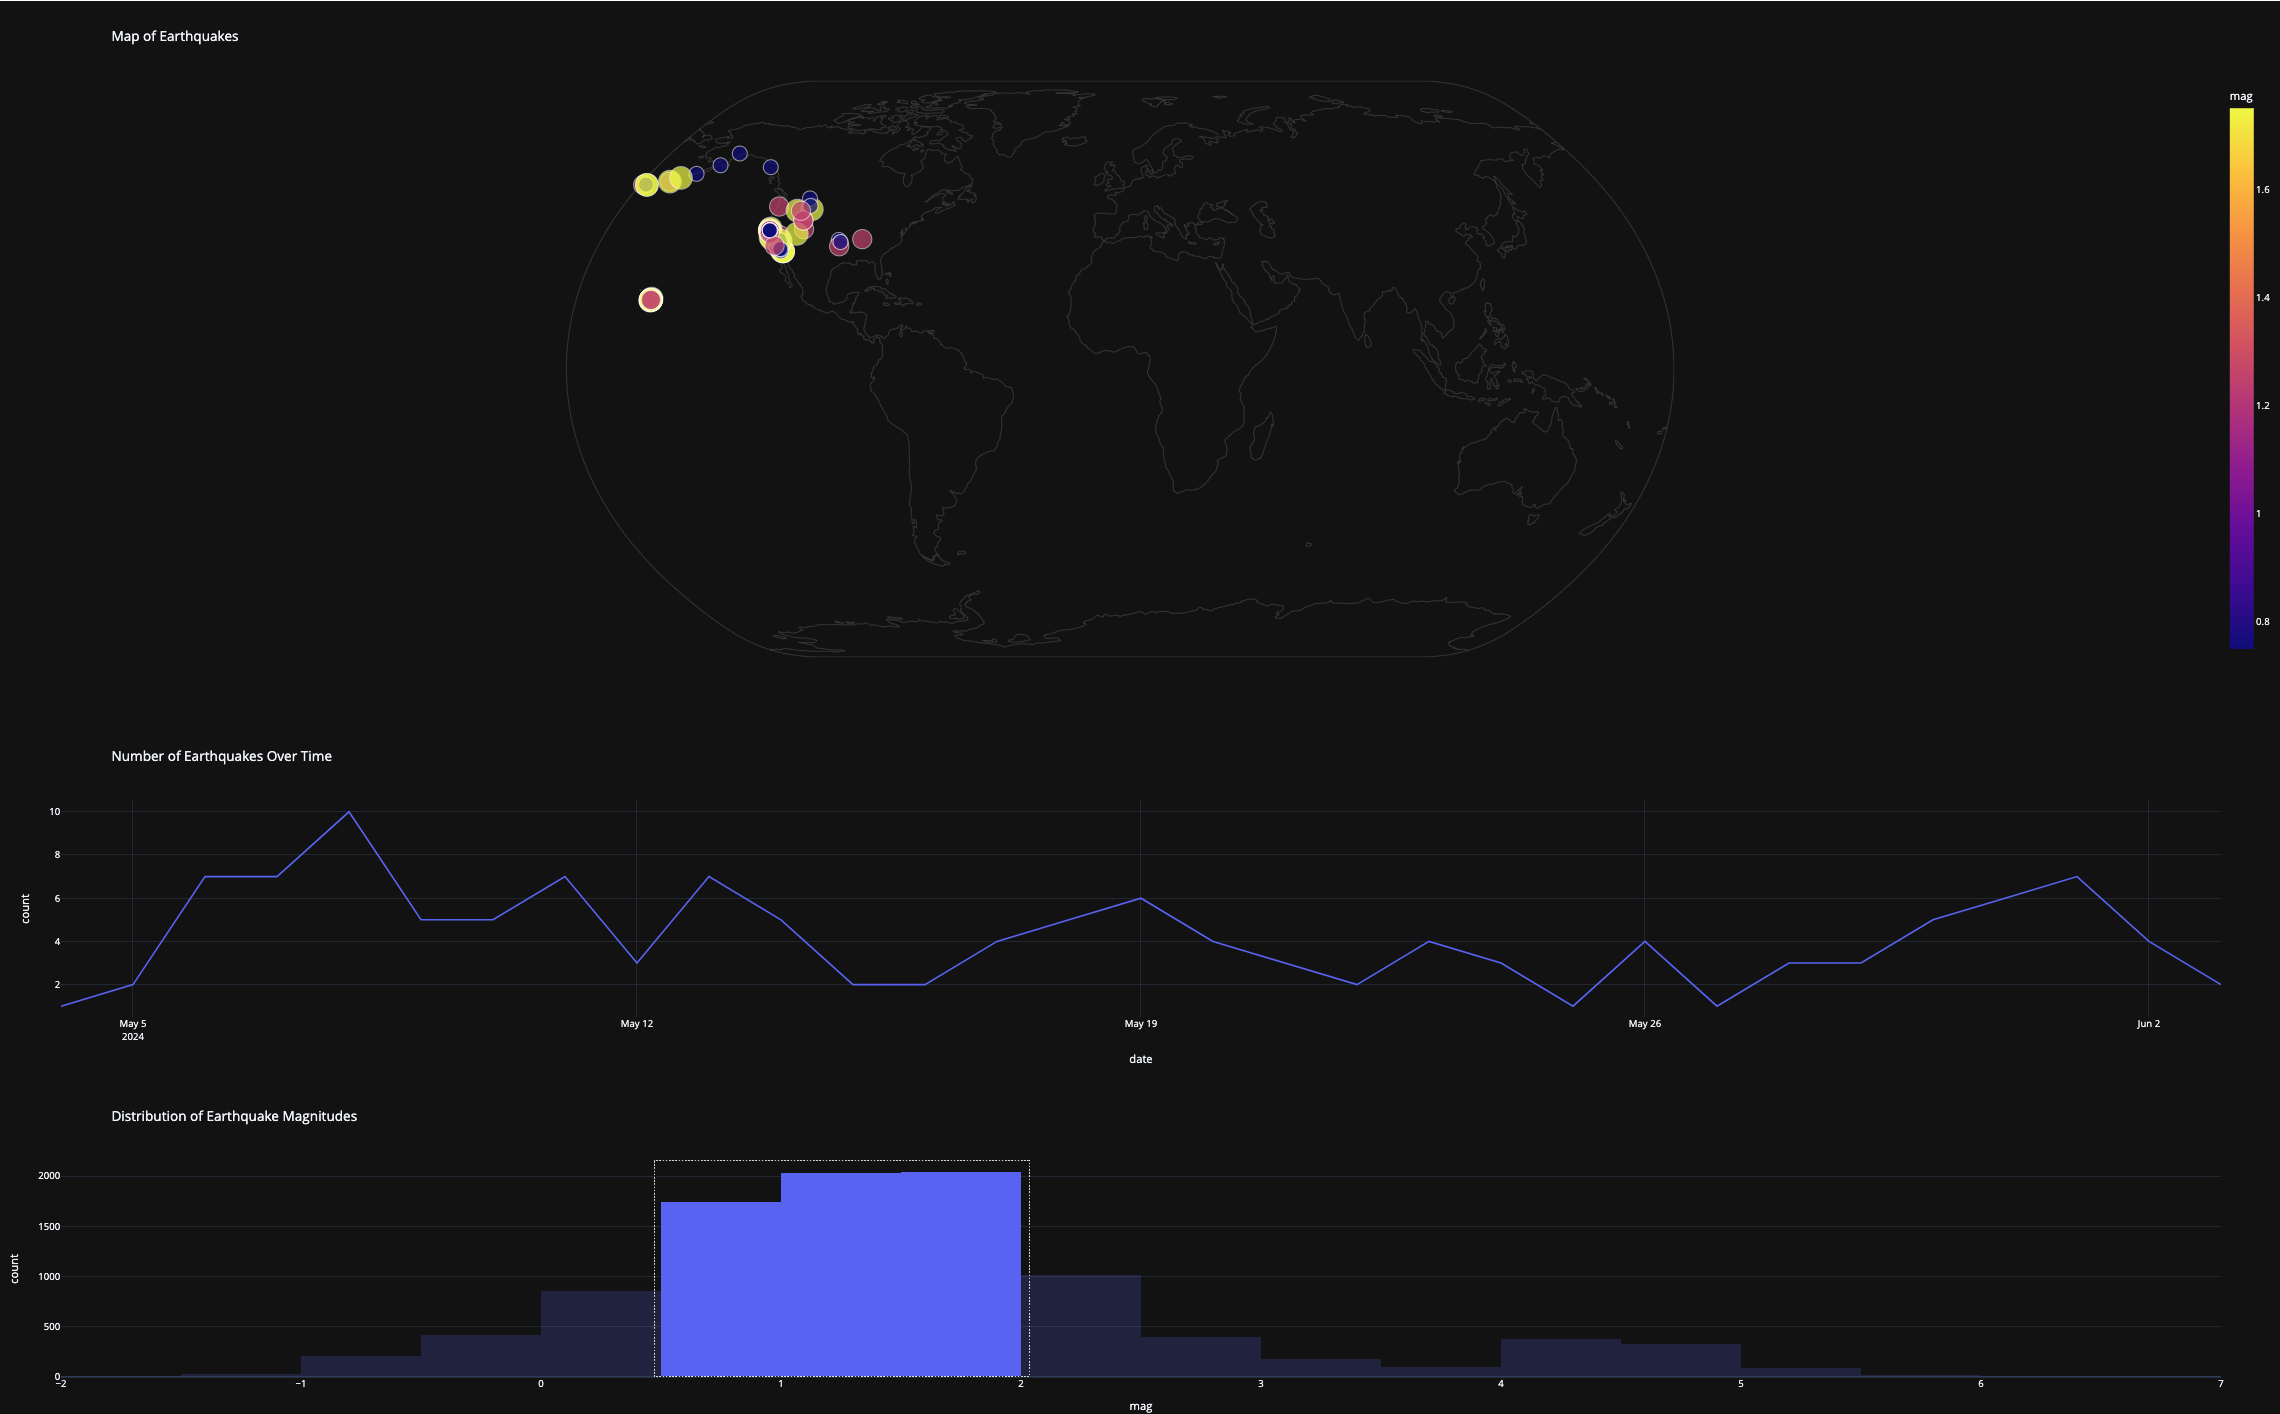
- Magnitude Distribution Plot: Use box select to filter by various levels of magnitude.
- Cross-Plot Interaction: Selections in one visualization dynamically update the others, providing a cohesive and interactive data exploration experience.
- Resetting Filters:
- To reset a filter, select the tool you used for filtering and double-click within the plot area.
- To reset zoom, click the "Reset Axes" button in the upper right corner of the plot.
- Legends: Each plot has its own legend to help identify the data being displayed.
You have multiple options to explore and run the code:
- View the Deployed Application: Visit Data Viz Lab 4 on PythonAnywhere to see the interactive dashboard in action.
- Run Locally:
- Clone the repository:
git clone https://github.com/Reennon/data_viz_lab_4.git - Navigate to the project directory:
cd data_viz_lab_4 - Create a virtual environment:
python -m venv venv - Activate the virtual environment:
- On Windows:
venv\Scripts\activate - On macOS/Linux:
source venv/bin/activate
- On Windows:
- Install dependencies:
pip install -r requirements.txt - Run the application:
python app.py
- Clone the repository:
- Explore Notebooks: The
notebooks/directory contains Jupyter notebooks with research code for initial data exploration and analysis. You can open these notebooks locally to understand the data processing steps.
This project leverages Dash to create a dynamic and interactive experience for data exploration, deployed on a web platform for easy access globally. The techniques used here illustrate a practical approach to handling and visualizing complex datasets in an interactive environment.


