UnhandledPromiseRejectionWarning 'Page' domain was not found
hdodov opened this issue · 2 comments
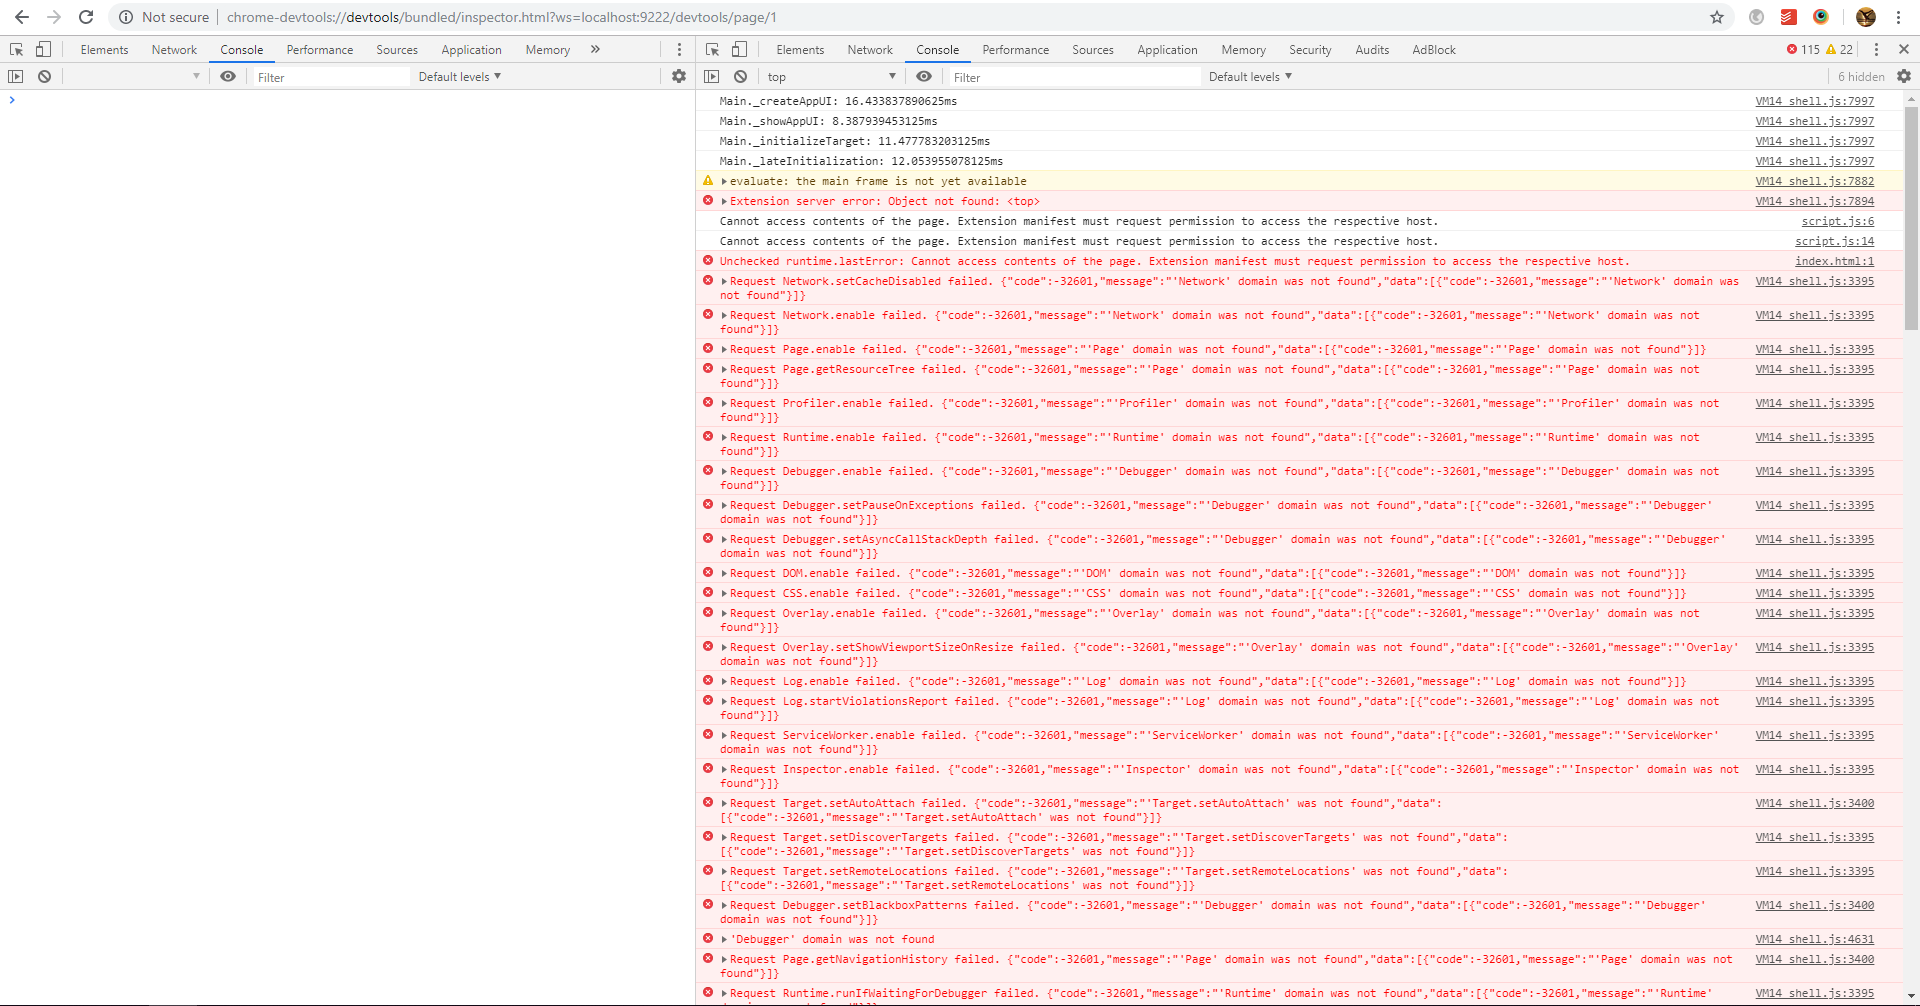
I'm trying to set up remote debugging on iPhone 6S. I followed the instructions in the README and the device appears in chrome://inspect. However, when I open a DevTools window, I see nothing in all of its panels. I get a bunch of errors in the console, though. Here's a full log with DEBUG enabled:
The following errors seem to occur a lot:
remotedebug sendToTools.{"error":{"code":-32601,"message":"'Page' domain was not found","data":[{"code":-32601,"message":"'Page' domain was not found"}]},"id":28} +1ms
remotedebug sendToTools.{"error":{"code":-32601,"message":"'Runtime' domain was not found","data":[{"code":-32601,"message":"'Runtime' domain was not found"}]},"id":29} +4ms
Edit: Those errors also appear if I run:
ios_webkit_debug_proxy -f chrome-devtools://devtools/bundled/inspector.html
And then open the debugger page:
@hdodov Did you find a solution for this?
This project is now super-seeded by https://inspect.dev/ – a new developer tool for macOS and Windows to inspect and debug your web apps and websites in Safari and WebViews on iOS devices.
RemoteDebug iOS WebKit Adapter is not proactively maintained or extended.