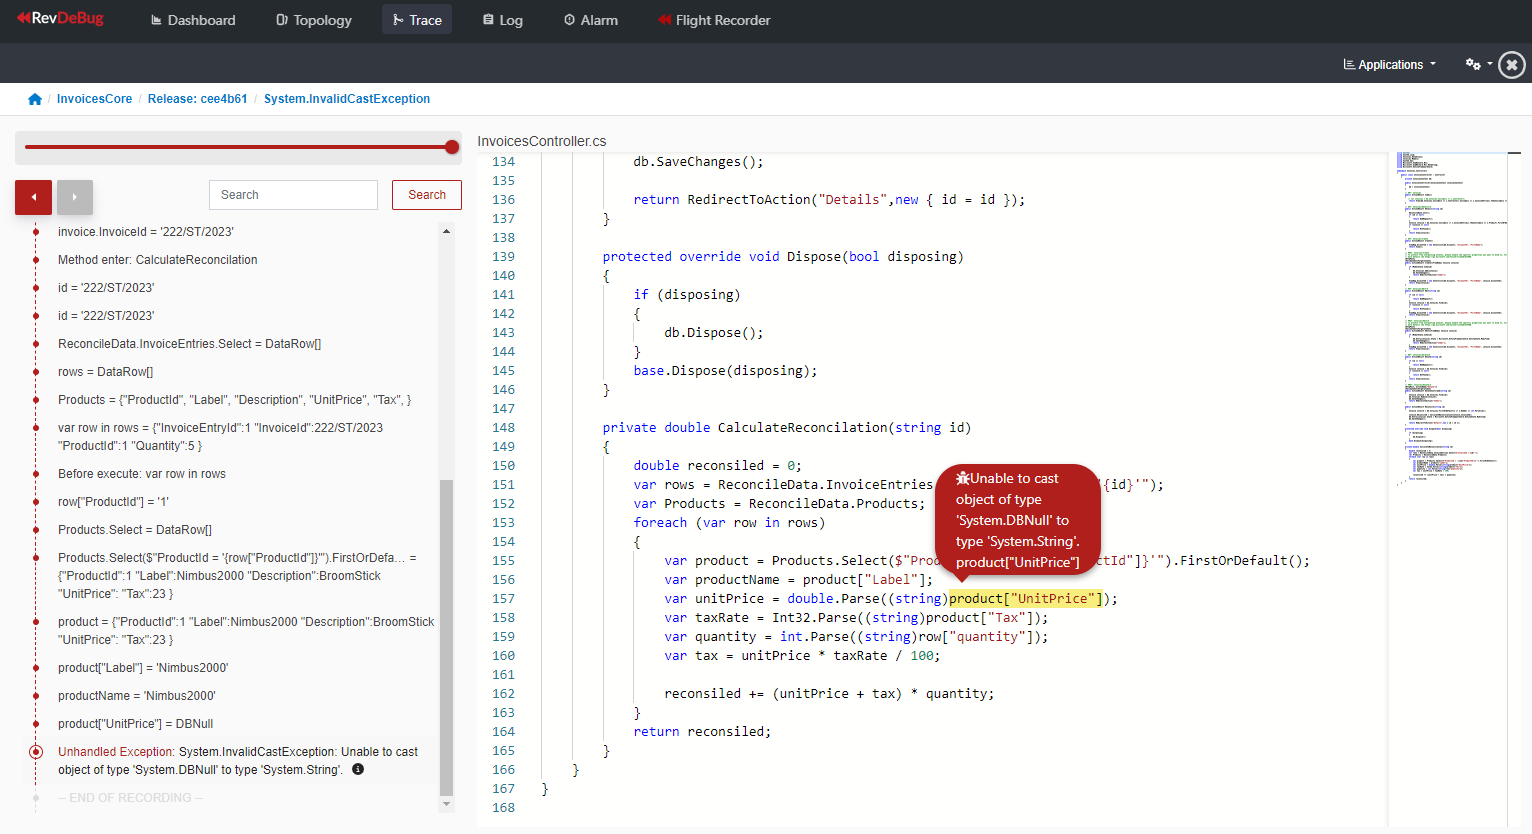
The following application is an example ASP.NET Core application showing the tracing and code execution recording of RevDeBug. A prerequisite for this follow along tutorial is a working RevDeBug Server instance running, please refer to user manual at: https://revdebug.gitbook.io/revdebug/installing-revdebug-server#setting-up-revdebug-server-instance
git clone https://github.com/RevDeBug/revdebug-tutorial-netCore

cd revdebug-tutorial-netCore
docker build --build-arg REVDEBUG_RECORD_SERVER_ADDRESS_ARG=[revdebug_server_address] -t rdb_core_demo .
docker build --build-arg REVDEBUG_RECORD_SERVER_ADDRESS_ARG=[revdebug_server_address] --build-arg REVDEBUG_TLS=true -t rdb_core_demo .
Where [revdebug_server_address] is your RevDeBug server address (IP address or just the hostname).
docker run -d -p 8090:80 --name rdb_core_demo rdb_core_demo:latest
Afterwards the application will be accessible through a web browser at: http://localhost:8090/
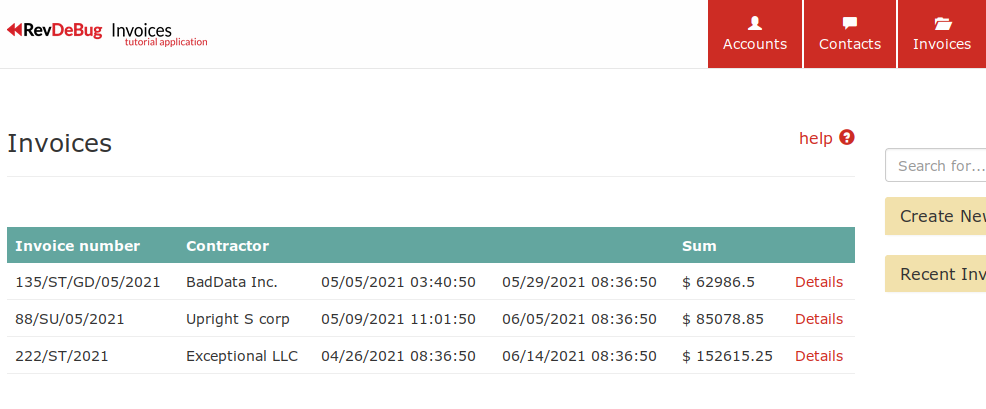
Navigate to Invoices web page.
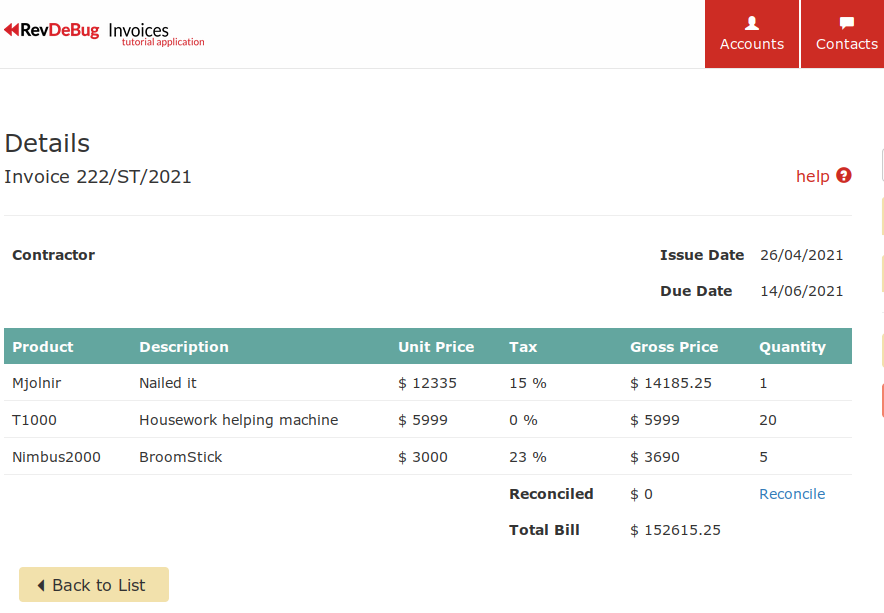
Select the invoice that came from: Exceptional LLC, access the details of the invoice and press the "Reconcile" link.
It will result with an error - you may see a "blank" or an error 500 web page at this time.
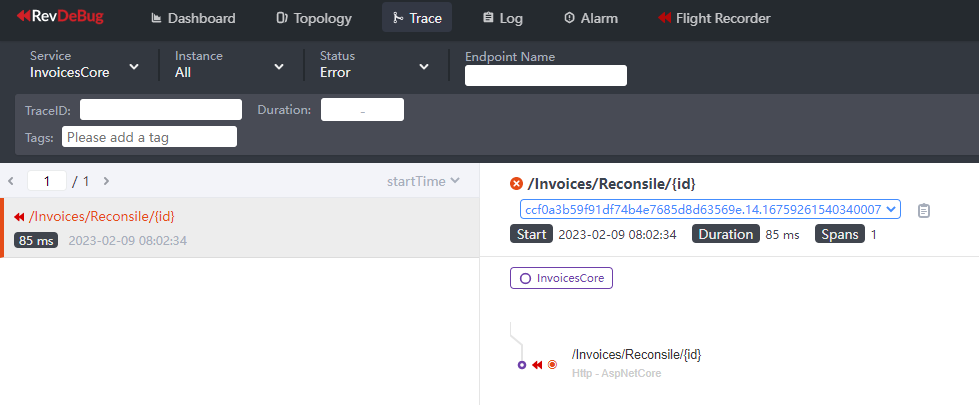
Next, you may switch to a RevDeBug server web interface and navigate to the “Trace” tab, where you may filter the traces to show only errors and limit to application “InvoicesCore”.
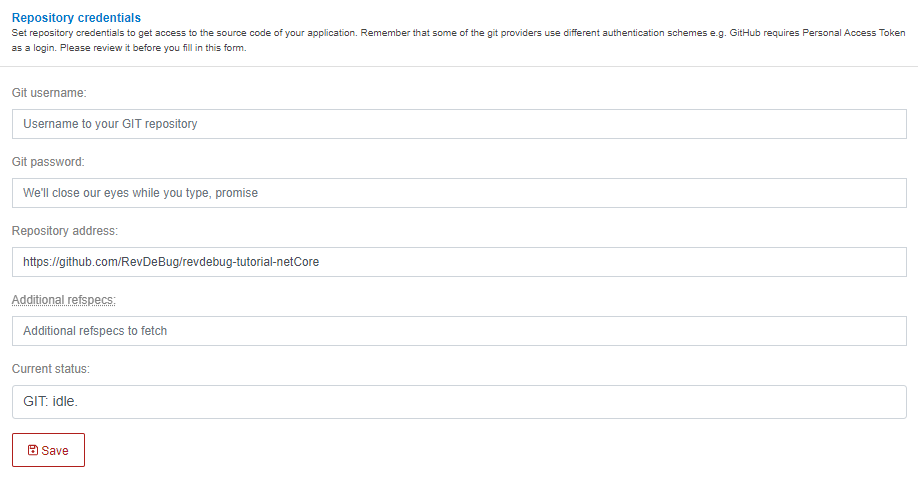
There you’ll find the trace for the caused error and you can access the recording of code execution. Accessing the recording for the first time will ask to configure the source code repository address.
Follow the “connect to repository” option and fill the “Repository address” to github repository location of https://github.com/RevDeBug/revdebug-tutorial-netCore and press “Save”.
Closing the inner window and reopening the code recording will present the recording on the source code and allow you to move around the recording timeline using the arrow buttons at top left.
