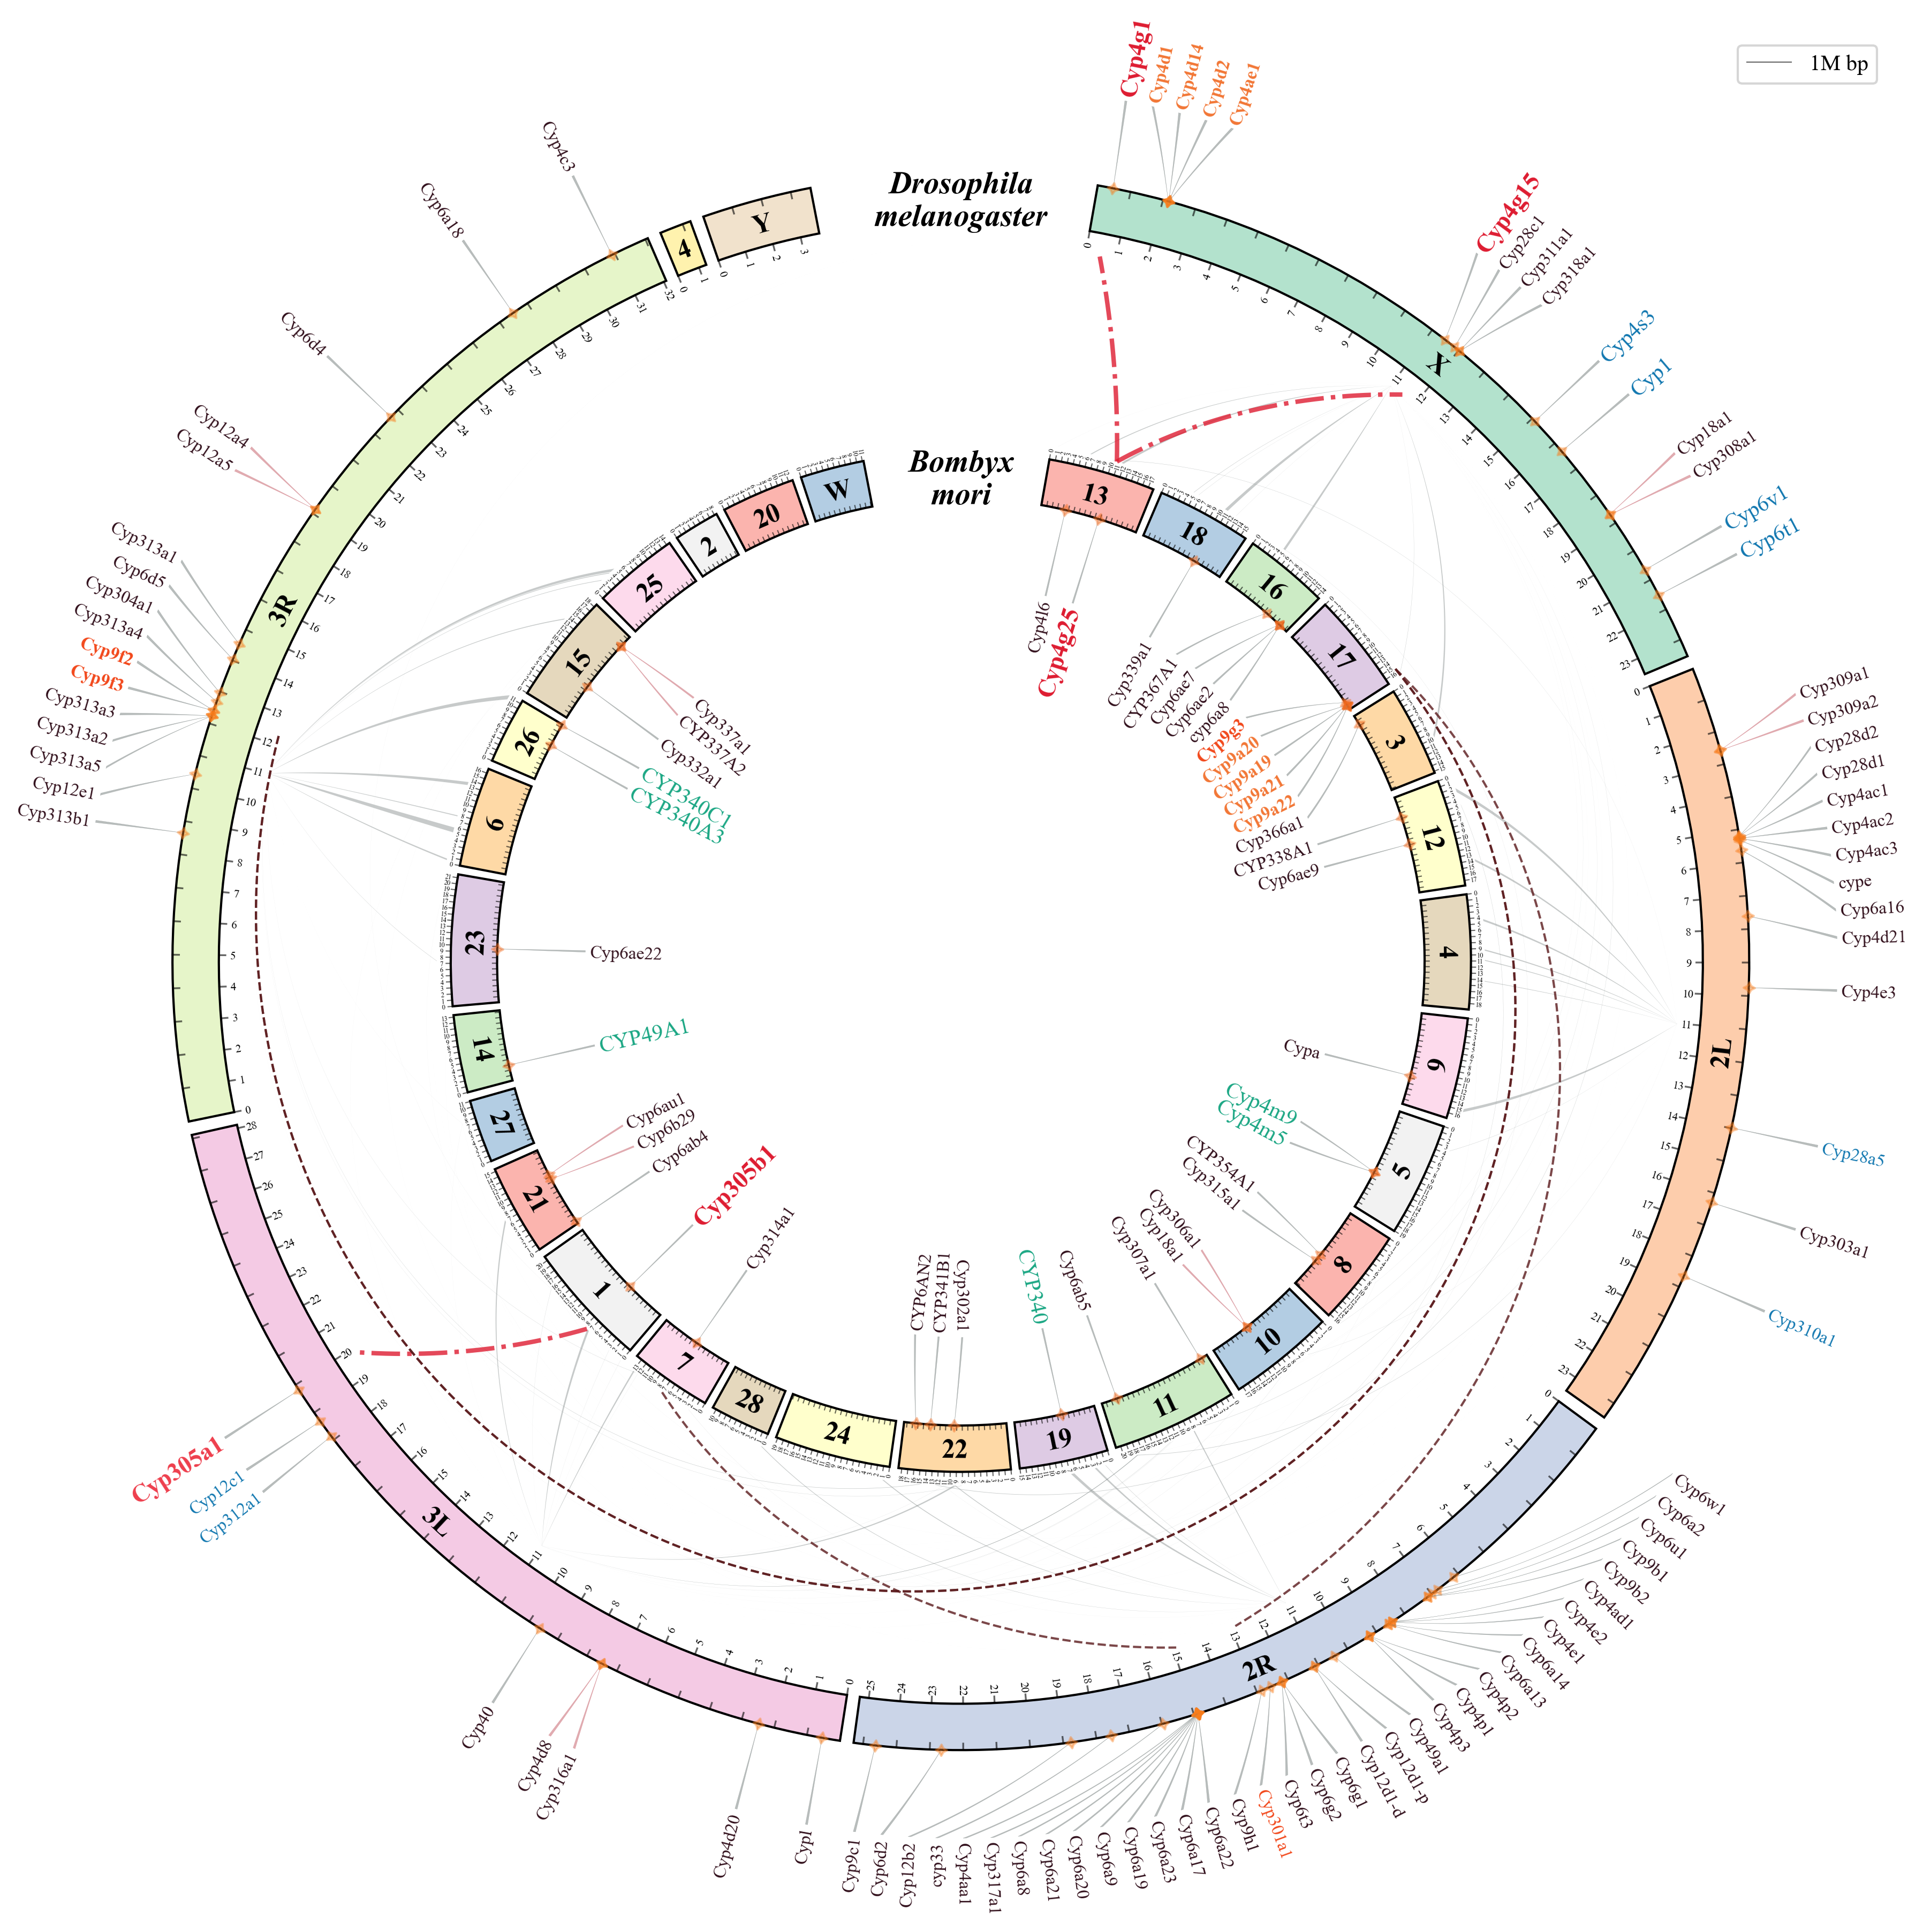
pyCircle is a Python-based tool for creating circular visualizations in comparative genomics. It leverages Matplotlib extensively and offers high customization capabilities.
pyCircle is implemented as a Jupyter Notebook file, which you can find here. It was inspired by pyCirclize, circlize, and the "Advanced Circos" function in TBtools. To create your own circular visualizations, you'll need to manually modify the source code within the ./pyCircle.ipynb file.
version 0.1
- Parsing: Supports parsing of
.anchors.simplefiles generated by MCscan (Python version). - Linking: Enables drawing links (blocks or lines) between two species.
- 😄Non-overlapping Genomic Labels: Ensures that genomic labels are displayed without overlapping, enhancing readability and clarity.
- Chromosome Length Scale: Provides a scale for chromosome lengths, enabling accurate representation and comparison of genomic regions.
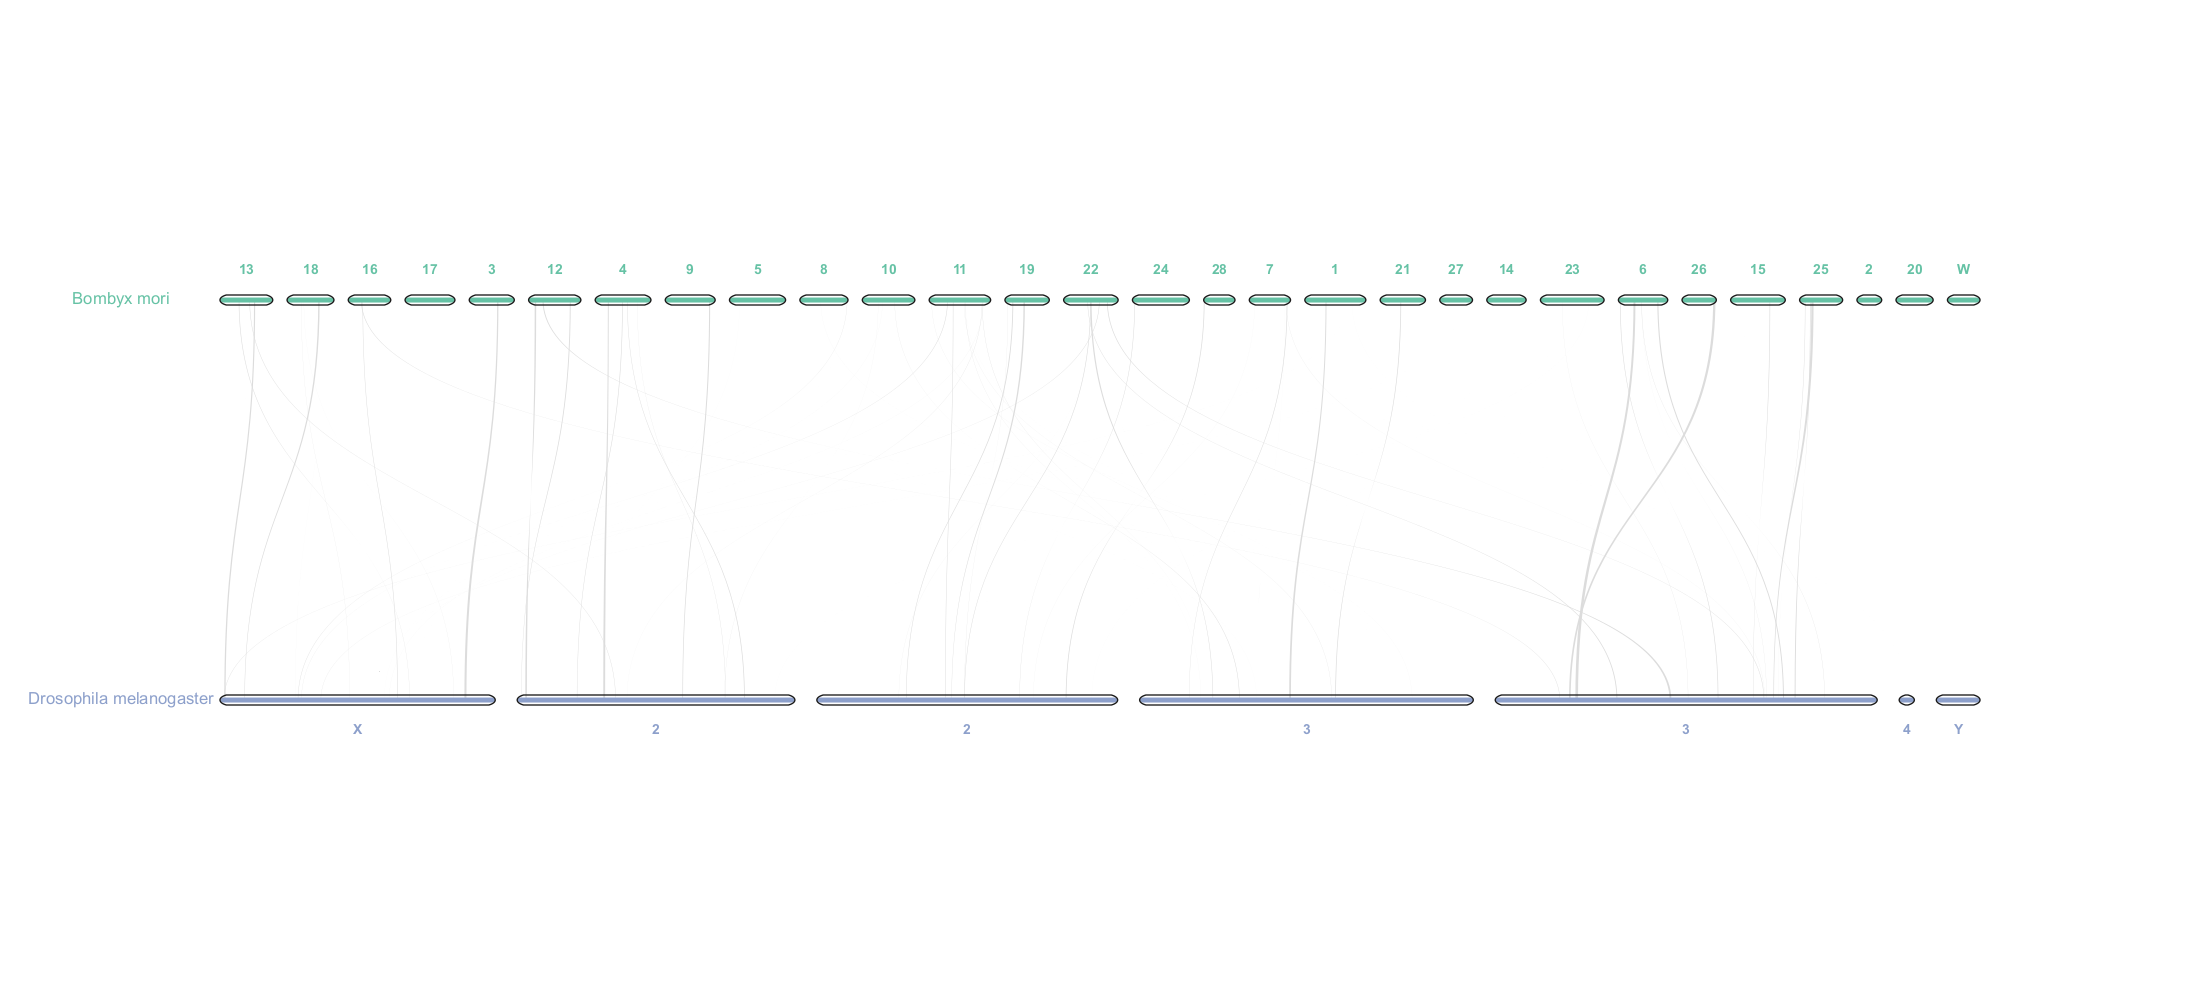
The figure above shows an example of a circular visualization created using pyCircle, the figure below shows a simple visualization using MCscan (Python version) in JCVI.
I encourage you to explore and customize the code to suit your specific needs. Enjoy creating beautiful visualizations (๑•̀ㅂ•́)و✧
If you encounter any issues or have suggestions for improvements, please feel free to open issues or submit pull requests😉
- Prerequisites: Ensure you have Python installed along with Matplotlib and other dependencies (Times New Roman font for example) in the environment.
- Installation: Clone this repository.
- Usage: Open the
pyCircle.ipynbfile in Jupyter Notebook and modify the code according to your dataset and visualization requirements.
This project is licensed under the MIT License, see the LICENSE file for details.
- Shimoyama, Y. (2022). pyCirclize: Circular visualization in Python [Computer software]. https://github.com/moshi4/pyCirclize
- Gu, Z., Gu, L., Eils, R., Schlesner, M., & Brors, B. (2014). circlizeimplements and enhances circular visualization in R. Bioinformatics, 30(19), 2811–2812. https://doi.org/10.1093/bioinformatics/btu393
- Chen, C., Wu, Y., & Xia, R. (2022). A painless way to customize Circos plot: From data preparation to visualization using TBtools. iMeta, 1(3). https://doi.org/10.1002/imt2.35
- Tang, H., Krishnakumar, V., Zeng, X., Xu, Z., Taranto, A., Lomas, J. S., . . . Zhang, X. (2024). JCVI: A versatile toolkit for comparative genomics analysis. iMeta. https://doi.org/10.1002/imt2.211

