Stock analysis is the evaluation or examination of the stock market. There are many trading tools to use to analyze stocks; such as fundamental and technical analysis. Fundamental analysis is more focused on data from the financial statements, economic reports, and company assets. Technical analysis is based on the study of the past of historical price to predict the future price movement.
This is an extremely basic stock analysis tutorial.
There are 7 parts in this tutorial.
- Libraries Used
- Get data from Yahoo
- Analyze Data
- Understand the Data based on Statistics
- Calculate Prices
- Plot Charts
- Calculate Holding Period Return
Data handling: pandas
Numerical calculations: numpy
Visualization: matplotlib
Ignore Warnings: warnings
Stock price information yfinance
Technical Analysis Indicators talib
Pull the ticker from the Yahoo Finance API yfinance.download()
-
display the first and last 5 rows of the dataset using the built in functions froms pandas
- df.head() -df.tail()
-
Show the quantity of rows and columns
- df.shape()
-
Show the column names
- df.columns
-
Show the data types of each column
- df.dtypes
-
Show information about DataFrame
- df.info()
-
Show summary statistics based on stock data
- df.describe()
Using "Adj. Close" price to find the minimum, maximum, average and standard deviation prices. The reason we are using "Adj. Close" is to show historical returns. The Adjusted Prices itakes into account the dividend and splits, while the Close price does not include dividend and splits.
Find the minimum df['Adj Close'].min()
Find the maximum df['Adj Close'].max()
Find the average df['Adj Close'].mean()
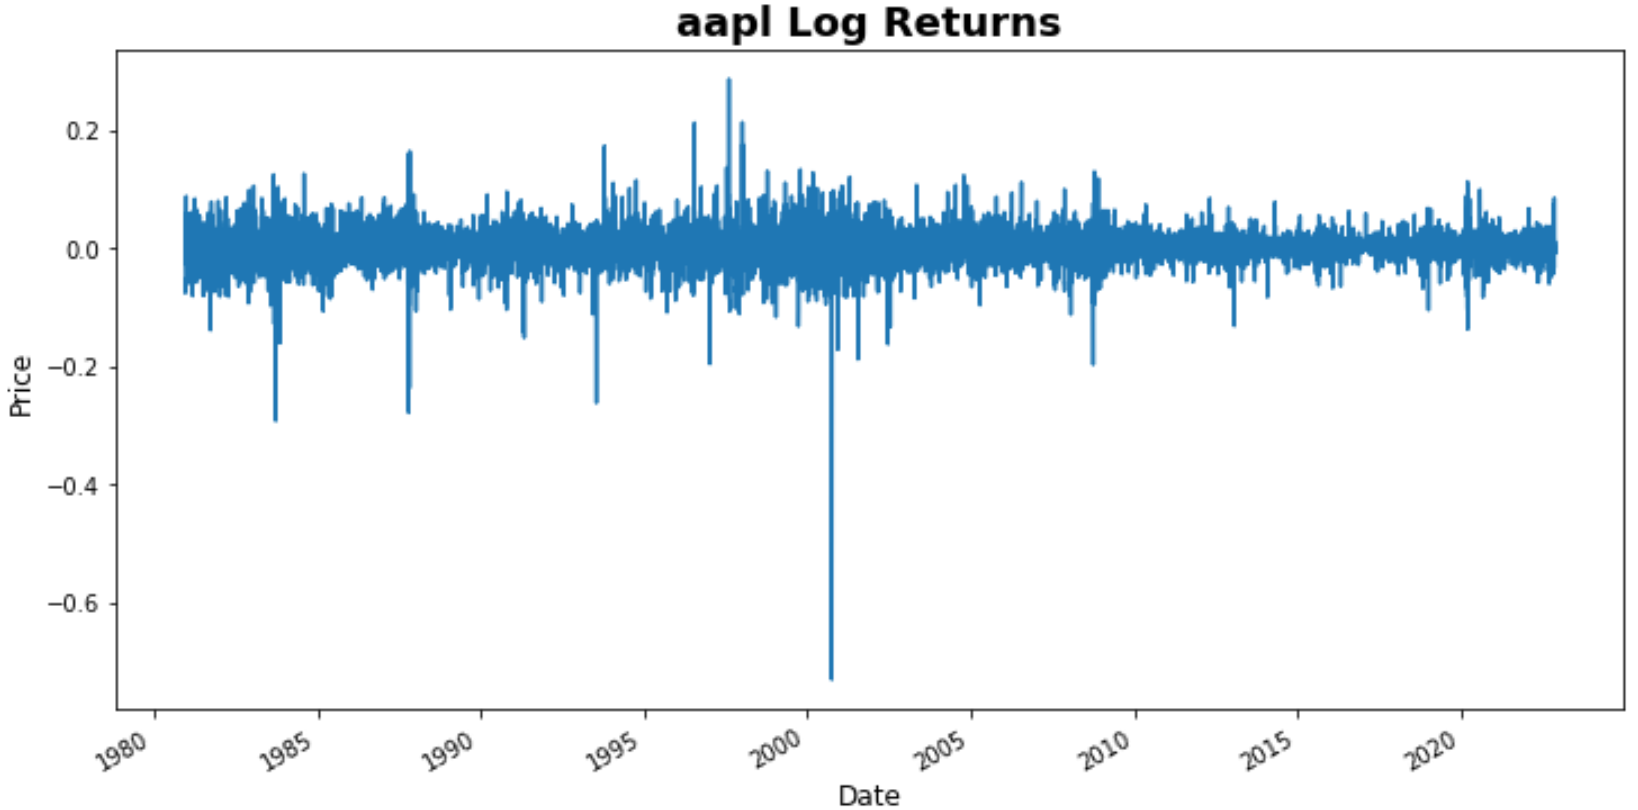
This section, we will be calculating the daily returns, log returns, and other technical indicators such as RSI(Relative Strength Index), MA(Moving Average), SMA(Simple Moving Averga), EMA(Exponential Moving Average), and VWAP(Voume Weighted Average Price). We will also calculate drawdowns.
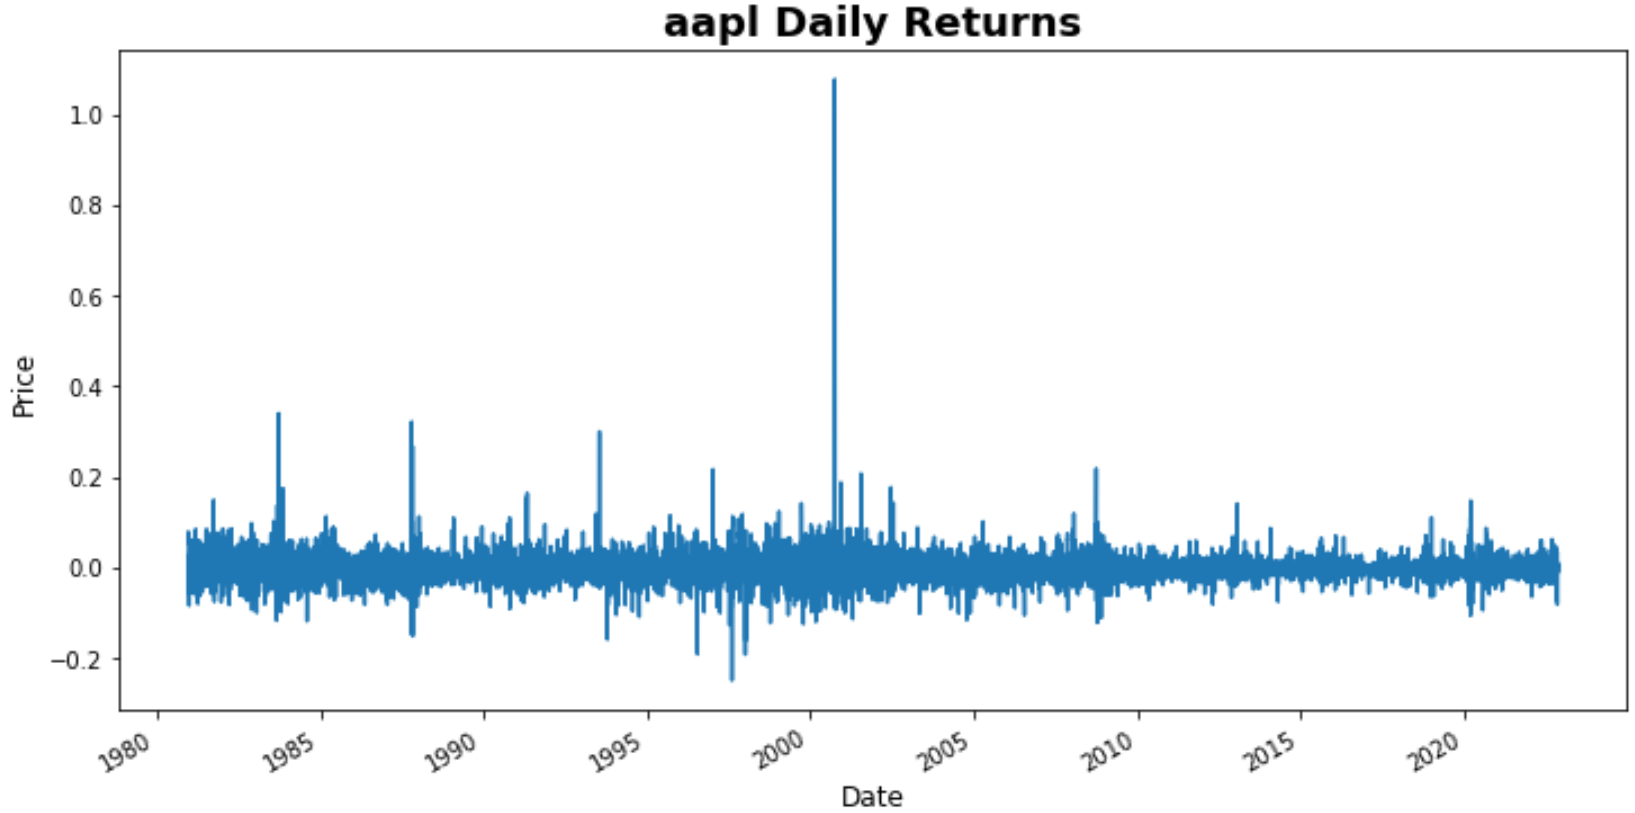
Daily Returns
df['Daily_Returns'] = df['Adj Close'].shift(1) / df['Adj Close'] - 1
Alternative method to calculate Daily Returns:
df['Adj Close'].pct_change(1) # 1 is for "One Day" in the past
Log Returns
np.log(df['Adj Close']) - np.log(df['Adj Close'].shift(1))
We will now use the talib library to access tools to perform technical analysis. This will precent us from having to do long handed calculatins!
ta.RSI()
ta.MA()
ta.SMA()
ta.EMA()
Volume Weighted Average Price - VWAP
round(np.cumsum(df['Volume']*(df['High']+df['Low'])/2) / np.cumsum(df['Volume']), 2)
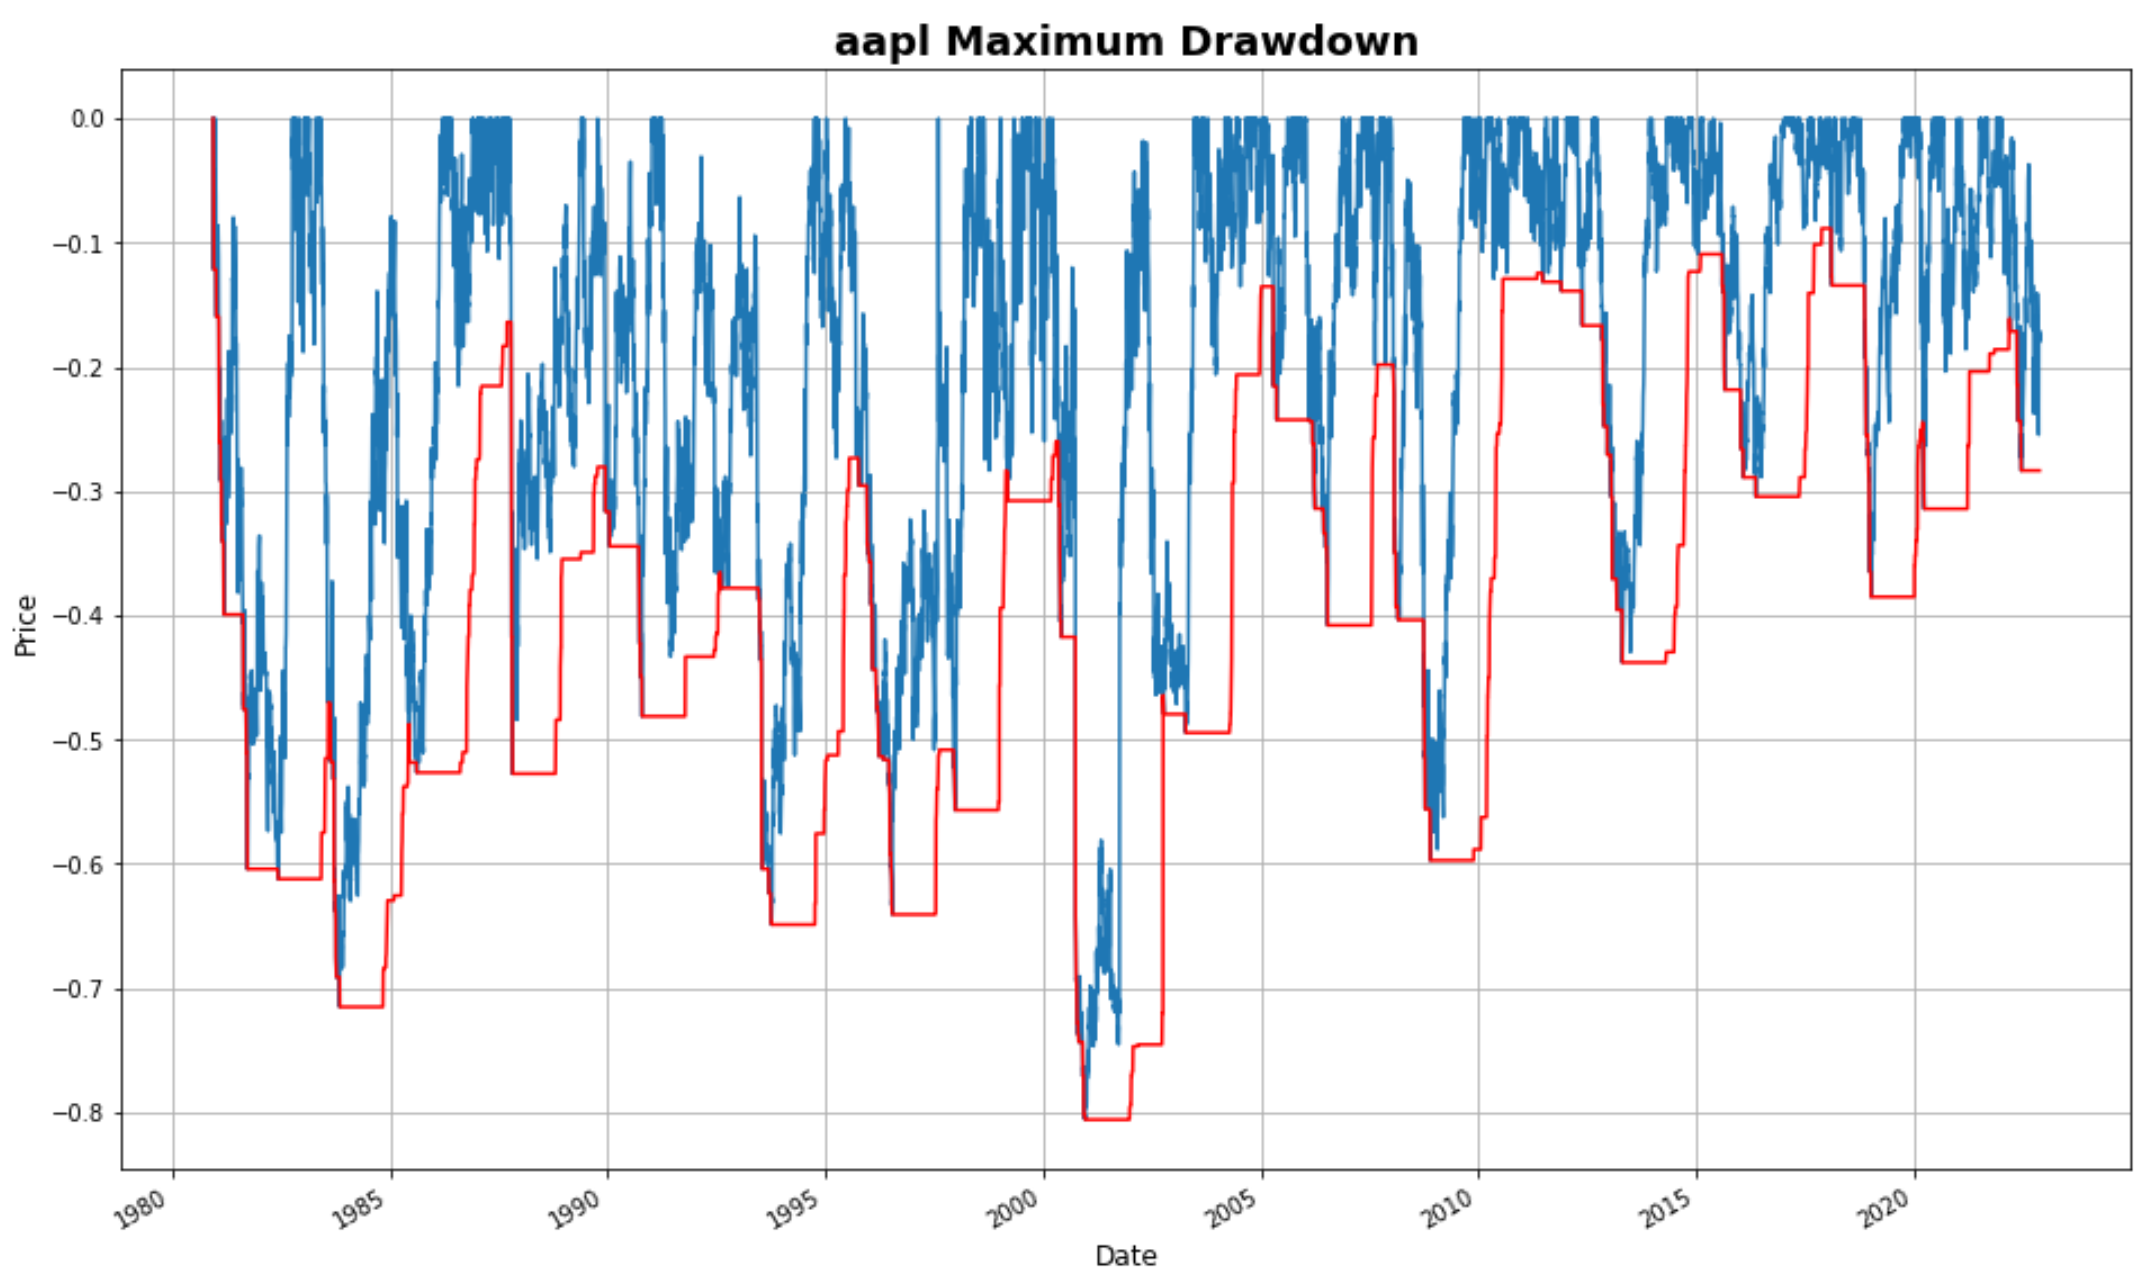
Drawdown
Drawdown shows the decline price since the stock began trading https://www.investopedia.com/terms/d/drawdown.asp
- There are 252 trading day in a year
Calculate the maximum drawdown
Use the min_period of 1 (1 is the least valid observations) for the first 252 day in the data Maximum_Drawdown = df['Adj Close'].rolling(window, min_periods=1).max() Daily_Drawdown = df['Adj Close']/Maximum_Drawdown - 1.0
Calculate the negative drawdown
Negative_Drawdown = Daily_Drawdown.rolling(window, min_periods=1).min()
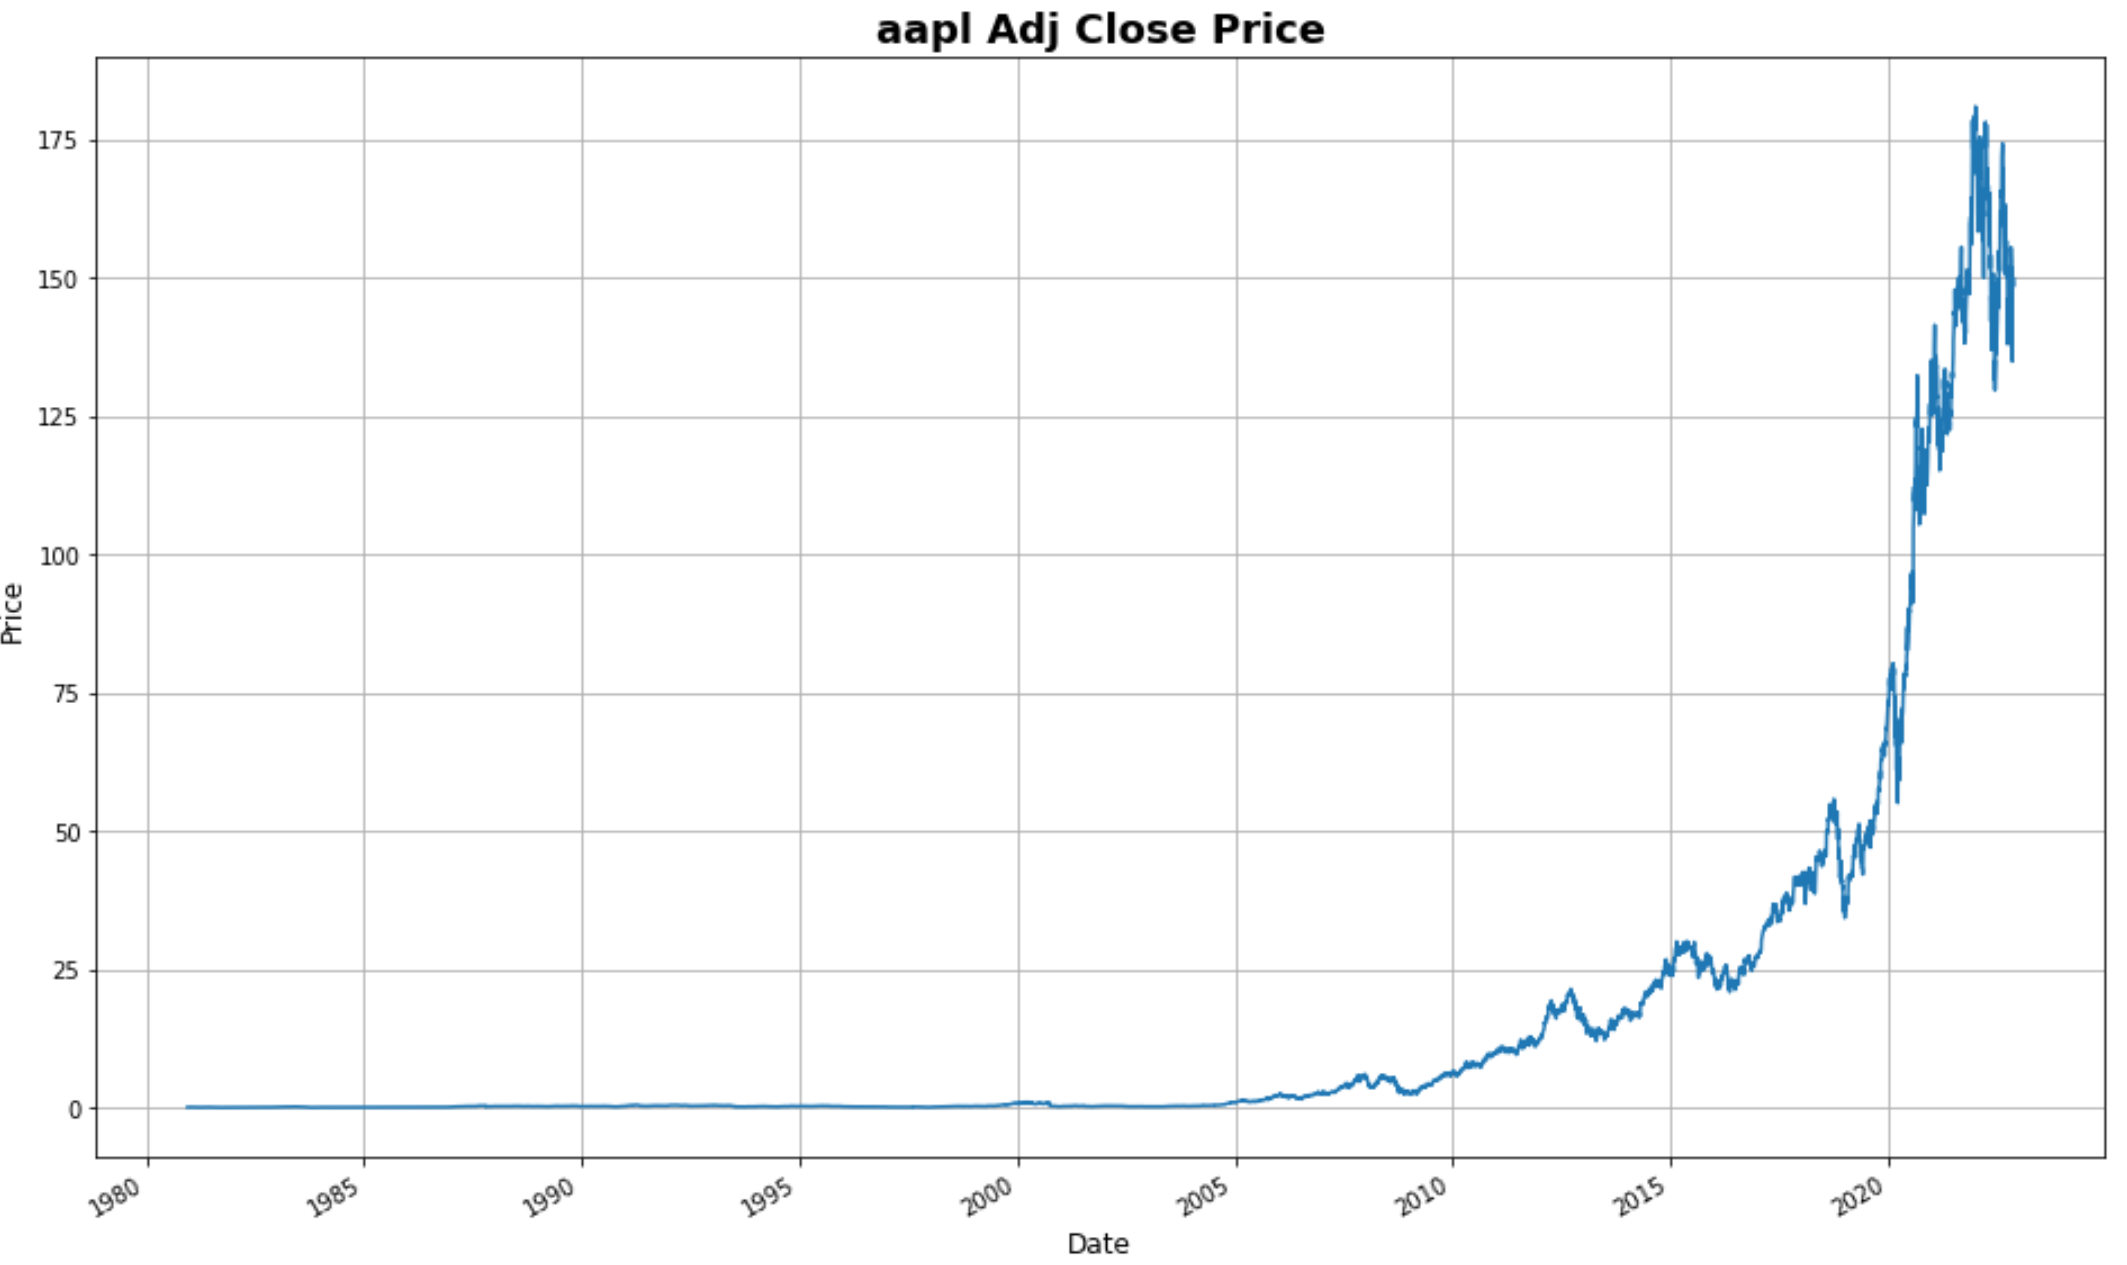
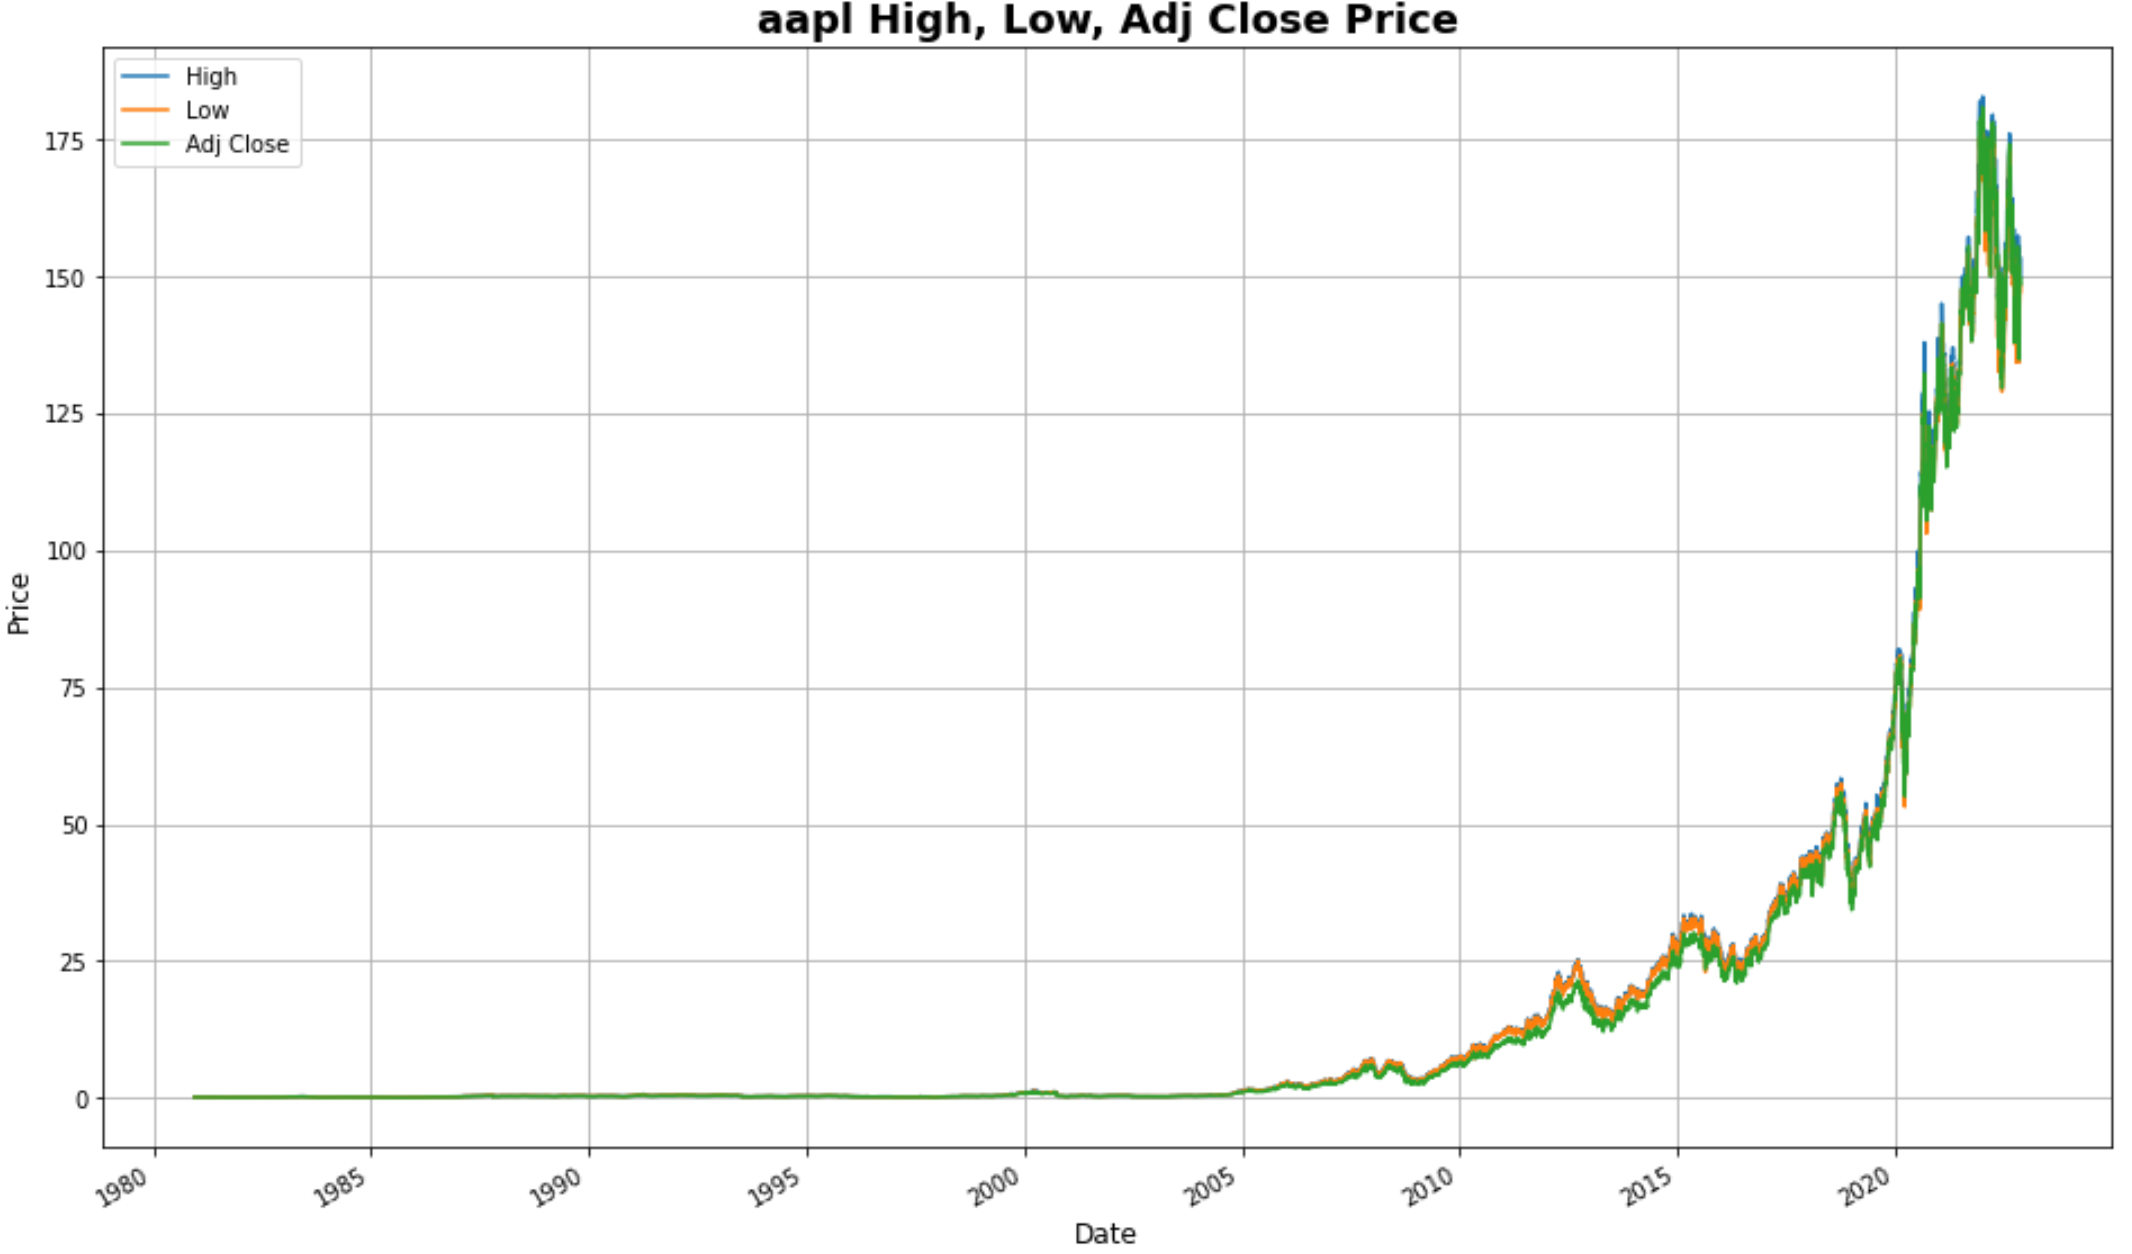
Use matplot lib to depict the stocks:
Holding period return (HPR) is the rate of return on an individual stocks or portfolio over the whole period during the time it was held. It is a measurement of investment performance.
- Analyze the Dividends
- Calculate the projected investment total after holding from the beginning and selling it at current.
