Rick Pack (VP of Research Triangle Analysts) March 10, 2020
"Pitch a talk, hear some talks, eat good food" #AnalyticsForward http://bit.ly/AF2020Signup
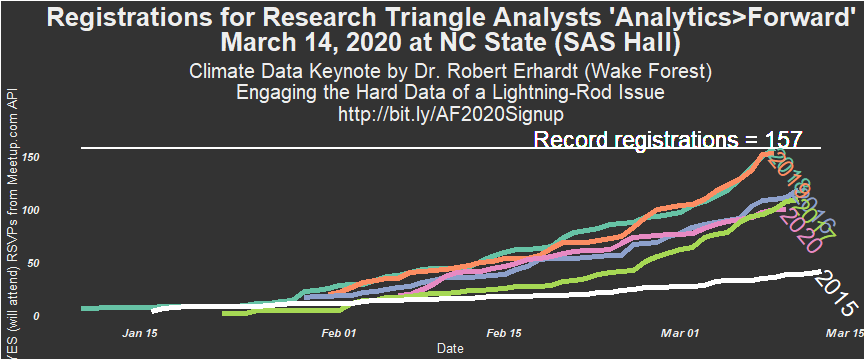
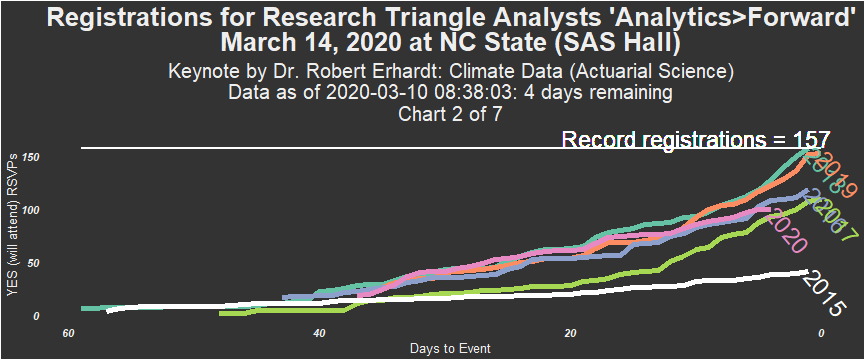
This page's data visualizations will be updated daily.
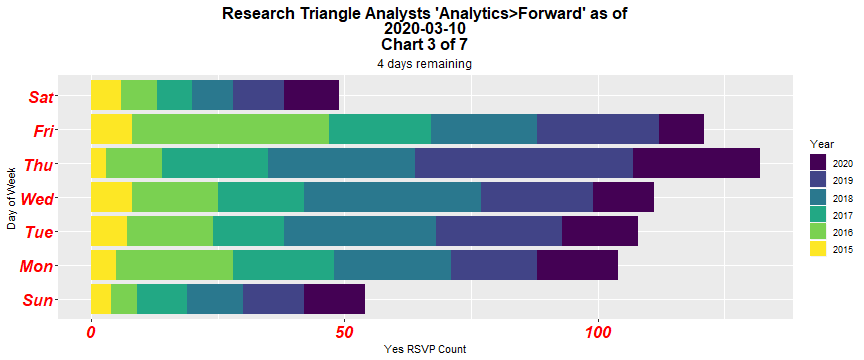
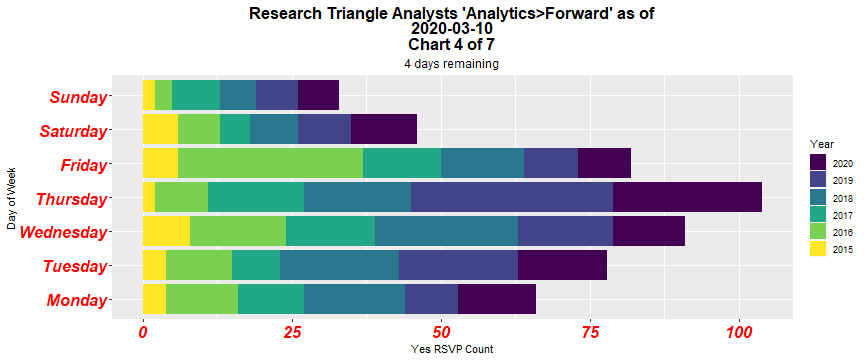
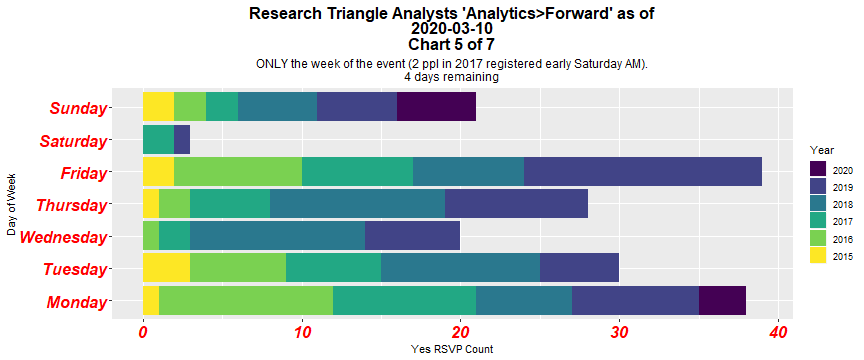
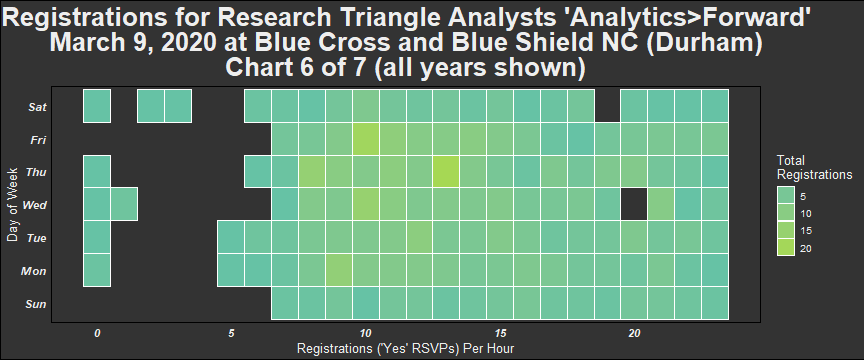
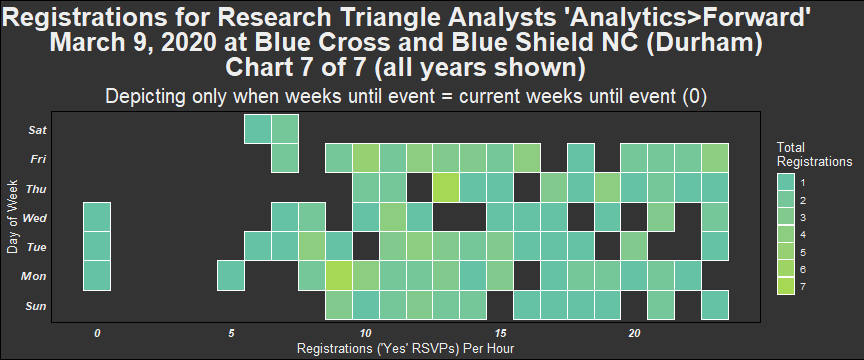
They primarily depict Meetup Registrations for Analytics>Forward, with the purpose of indicating sell-out potential and to help the planning comittee with elements including the catering order.
Thank you to R-Ladies for the meetupr package.
| weekday_rsvp | Average_RSVP_weekday |
|---|---|
| Sun | 3.50 |
| Mon | 7.75 |
| Tue | 6.75 |
| Wed | 4.75 |
| Thu | 6.25 |
| Fri | 9.00 |
| Sat | 0.75 |
| weekday_rsvp | RSVP_weekday |
|---|---|
| Sun | 4 |
| Mon | 3 |
| name | Meetup_Start_Date | Registration_Date | Weekday | Registration_Count |
|---|---|---|---|---|
| Analytics>Forward 2019 | 2019-01-31 | 2019-01-31 | Thu | 19 |
| Analytics>Forward 2020 | 2020-02-06 | 2020-02-06 | Thu | 18 |
| Analytics>Forward, with Keynote by John Sall, EVP of SAS Institute | 2016-01-29 | 2016-01-29 | Fri | 16 |
| Analytics>Forward 2019 | 2019-01-31 | 2019-03-08 | Fri | 15 |
| Analytics>Forward, with Keynote by John Sall, EVP of SAS Institute | 2016-01-29 | 2016-03-07 | Mon | 11 |
| Analytics>Forward 2018 | 2018-01-10 | 2018-03-07 | Wed | 11 |
| Analytics>Forward 2018 | 2018-01-10 | 2018-03-08 | Thu | 11 |
| name | Meetup_Start_Date | Registration_Date | Weekday | Registration_Count |
|---|---|---|---|---|
| Analytics>Forward 2020 | 2020-02-06 | 2020-02-06 | Thu | 18 |
| Analytics>Forward 2020 | 2020-02-06 | 2020-02-10 | Mon | 7 |
| Analytics>Forward 2020 | 2020-02-06 | 2020-02-26 | Wed | 6 |
| Analytics>Forward 2020 | 2020-02-06 | 2020-02-08 | Sat | 5 |
| Analytics>Forward 2020 | 2020-02-06 | 2020-02-09 | Sun | 5 |
| Analytics>Forward 2020 | 2020-02-06 | 2020-02-25 | Tue | 5 |
| Analytics>Forward 2020 | 2020-02-06 | 2020-03-03 | Tue | 5 |
| Analytics>Forward 2020 | 2020-02-06 | 2020-03-08 | Sun | 5 |
## [1] "As of 2020-03-10 08:38:46"
| name | Year | Total_Registrations |
|---|---|---|
| Analytics Forward - An Unconference | 2015 | 41 |
| Analytics>Forward, with Keynote by John Sall, EVP of SAS Institute | 2016 | 119 |
| Analytics>Forward | 2017 | 109 |
| Analytics>Forward 2018 | 2018 | 157 |
| Analytics>Forward 2019 | 2019 | 153 |
| Analytics>Forward 2020 | 2020 | 100 |
To facilitate engagement by potential collaborators, the following discusses available files.
After installing R and R-Studio, fork this repo by clicking fork at the top-right. Then follow these instructions from the RStudio web site to create a new project that is a clone of this version-controlled (think Github) repository. In the future, you can then double-click the AnalyticsForward_2020.Rproj file to open RStudio with the files of this project being easily accessible.
- Readme.Rmd creates what appears on the Github page, including this text. +One
- Meetup_RSVP_Yes_latest.R contains the Meetup_RSVP_Yes_Count() function. You can use Readme.Rmd to understand how to use it.
- The .csv files contain data one could use with any program for analysis.
- Chuck Jaeger used Tableau to create this Tableau storyboard.
- Related, although he used the JMP Meetup API, Xan Gregg created images including this one on Twitter. Xan inspired many updates to the data visualizations presented here and Chuck also provided some thoughts, including the key stimulus that began all my early 2020 work.
- animate_sponsor_coord.R is a quick-reference for stitching together images into an animated .GIF
- AF_Pres.Rpres is a Xaringan presentation that has obvious imperfections I would love for others to help me fix.
- The RTAgrp .html files are what I called "Easter eggs" in my A>F presentation. These can be opened in a web browser to see the use of Joshua Kunst's highcharter package, inspired by the work of 2018 keynoter, Mara Averick.
- Other files are images used in the Analytics>Forward presentation I did with Dr. Zeydy Ortiz. You can her gganimate() use for RSVPs at:
Plenty of #AnalyticsForward images are available on Twitter and LinkedIn via #AnalyticsForward as well as this Facebook album: (http://bit.ly/2O126hX)

