This is a data visualization web application developed using Streamlit. The application accepts a CSV file and allows the user to visualize the data distribution and apply statistical hypothesis tests.
To get started with application, the hosted on streamlit version of app can be used:
https://csv-statistics-visualizer.streamlit.app/
-
Clone the repository
git clone https://github.com/Rivgad/csv-statistics-visualizer cd csv-statistics-visualizer -
Open Anaconda Prompt and change directory to project directory
-
Create a new Conda environment and activate it
conda env create -f conda-env.yml conda activate csv-statistics-visualizer-env -
Run the Streamlit app
streamlit run app/streamlit_app.pyor (for Windows)
python -m streamlit run app/streamlit_app.py
Running on Streamlit Community Cloud
Running on Streamlit Community Cloud
-
Fork repository *click here*
-
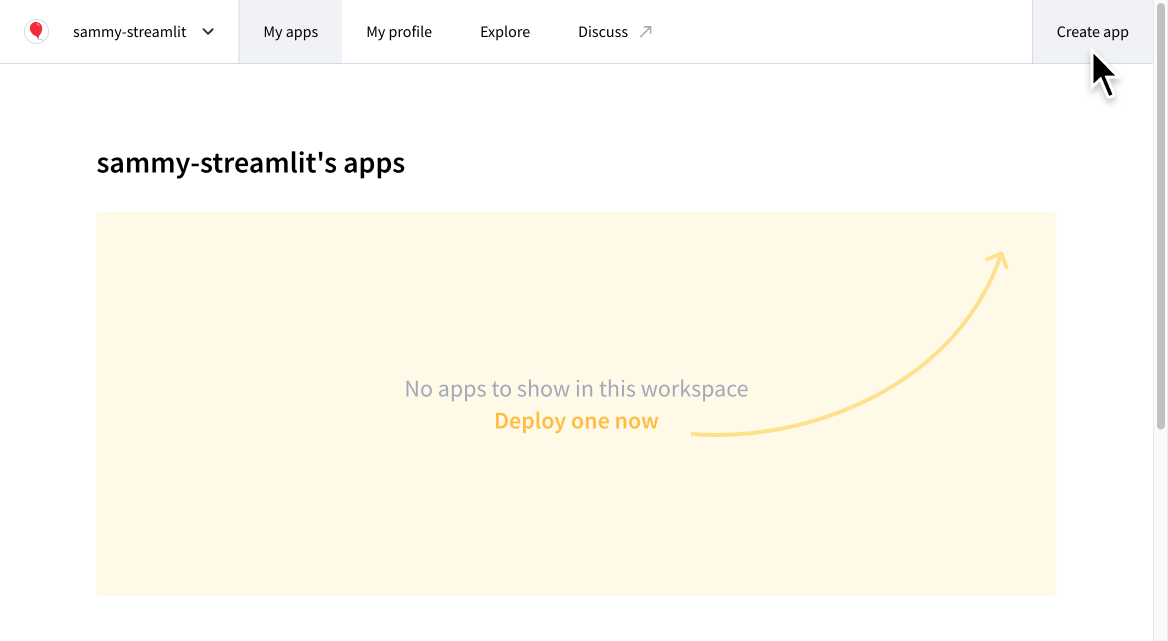
To deploy an app, click "New app" from the upper right corner of your workspace.
-
Fill in:
- Repository: %your_github_username%/csv-statistics-visualizer
- Branch: main
- Main file path: app/streamlit_app.py
-
Click 'Advanced settings...' and choose Python version 3.10
-
Click 'Deploy!'
