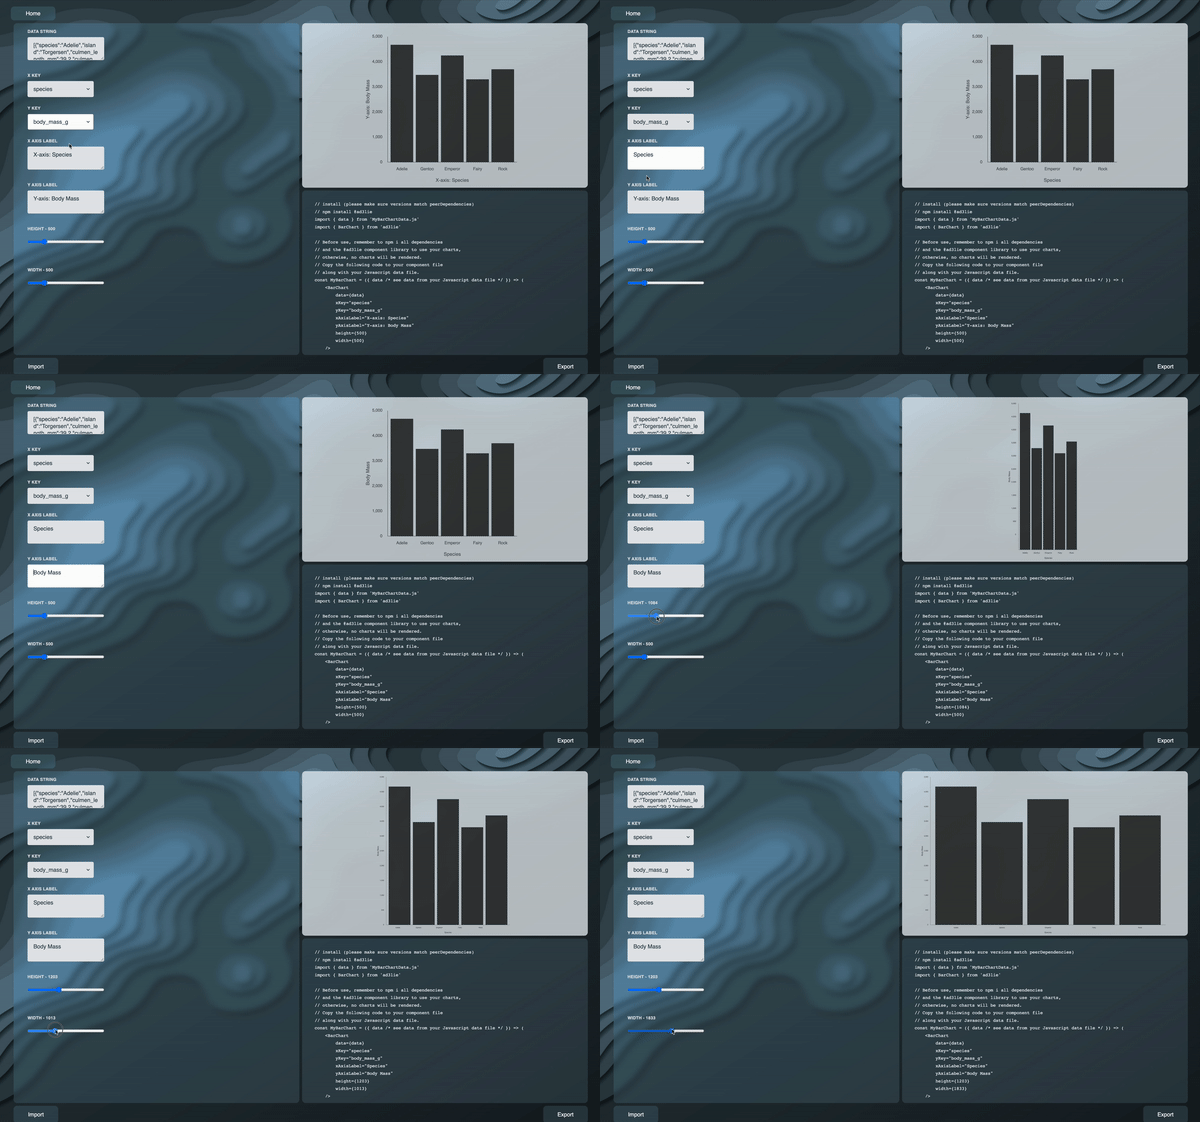
ad3lie is an open-source application and package for creating elegant and responsive data visualizations built with React and D3.
The focus of this application is to generate user customized charts that can be used in any React project.
Begin by downloading the app from our website.
After opening the app, choose which graph to create. Don't worry, if you decide to chose another graph, simply click on the home button and choose another graph from the home page. All of your input data will be saved for the duration of the application's life span.
Input the required fields (i.e. Data, xKey, and yKey) and adjust the graph based on the inputs given
Click the export button and select the file directory of your project for both the data file and React component.
Downloading ad3lie will include other necessary dependencies in order to generate your data visualizations. This allows for the use of the React component exported from the ad3lie application.
Simply download the npm package
npm i ad3lie
OR
yarn add ad3lie
From here, import the React component as a child component.
import Chart from "./file/path/to/component"
From here, simply use the componet as you would any other child component in your React app.
For more detailed information, please check the related package documentation or go directly to our npm package.
Checkout our website to see incoming features, how to get involved, and meet our team!


