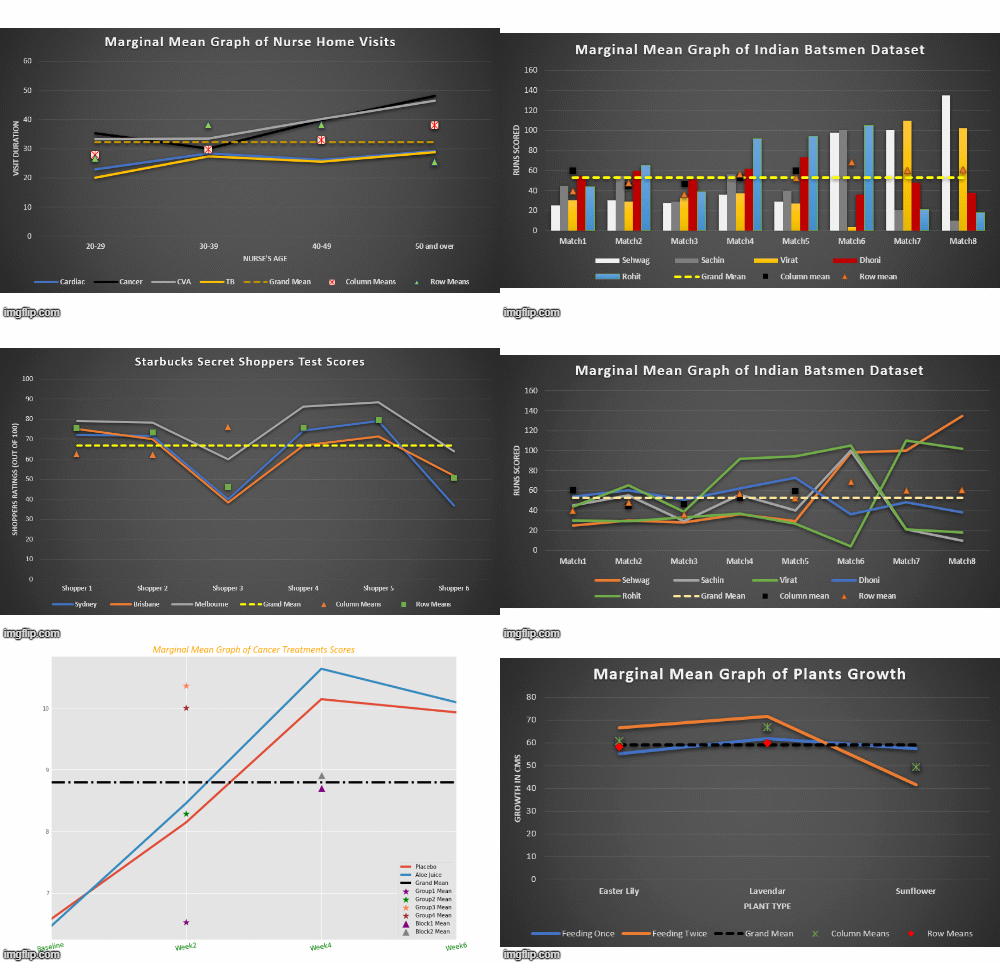
This repository is created for storing the components of Statistical Tests carried out on One, Two and Three or more populations using Python. Here, I have also worked on some of the real-life datasets to perform Statistical or Hypothesis Testing.
Also, shared the hand-written notes & python implementations which I created to attain better knowledge around these tests.
Below are the tasks carried out in this project:
-
- T Test or STUDENT-T or STUDENT Test
- Z Test
- Population Proportion
- Chi-Square Test
-
- Large Independent Samples
- Pooled Large Independent Samples
- Not-Pooled Large Independent Samples
- Small Independent Samples
- Pooled Small Independent Samples
- Not Pooled Small Independent Samples
- Population Proportions
- Large Independent Proportions -- Z Test
- Dependent Samples
- Small Dependent Samples -- T Test
- F-Distribution (2 variances or standard deviations)
- Large Independent Samples
-
-
Solved
One-factorproblems- Post-Hoc Analysis
- Normality Test
- Homogenity Test
-
Solved
Two-factors W/O Repetitionproblems- Running 1-Way ANOVA
- Running 2-Way ANOVA
- Post-Hoc Analysis
- Normality Test
- Homogenity Test
-
Solved
Two-factors With Repetitionproblems- Running 1-Way ANOVA
- 1-Way ANOVA Post-Hoc
- Running 2-Way ANOVA
- Post-Hoc Analysis
- Normality Test
- Homogenity Test
- Running 1-Way ANOVA
-
🤿 Fun-Fact :: Why I wrote some of these statistical tests from scratch? 🤷♂️
- It was not only my eagerness to gain a full understanding but python statistical packages (like statsmodels and others) were following slightly different mathematical formulations for these tests.
- So, I was getting a noticeable difference while comparing my on-paper calculated p-values with python-generated p-values. That motivated me to look into the
statsmodelsimplementations and find such differences. 😇
📙 Textbook referred :: Biostatistics: A Foundation for Analysis in the Health Sciences, 10th Edition
✅ Datasets used in Textbook :: Download 👈
