This project ultilizes a momentum-based strategy to autonomously day-trade on the stock market.
- Contents
- Trading Stategy
- ADX
- +DI and -DI
- Entering Positions
- Stop-Loss Margins
- Code Overivew
- Price
- Technical Analysis
- Signals
- Streaming
- Authentication
- Current Goals
- Storing Orders
- Determining Take-Profit Margins
- Trading Stategy
This trading strategy incorporates the ADX and DMI to determine buy and sell signals for long and short positions.
-
ADX
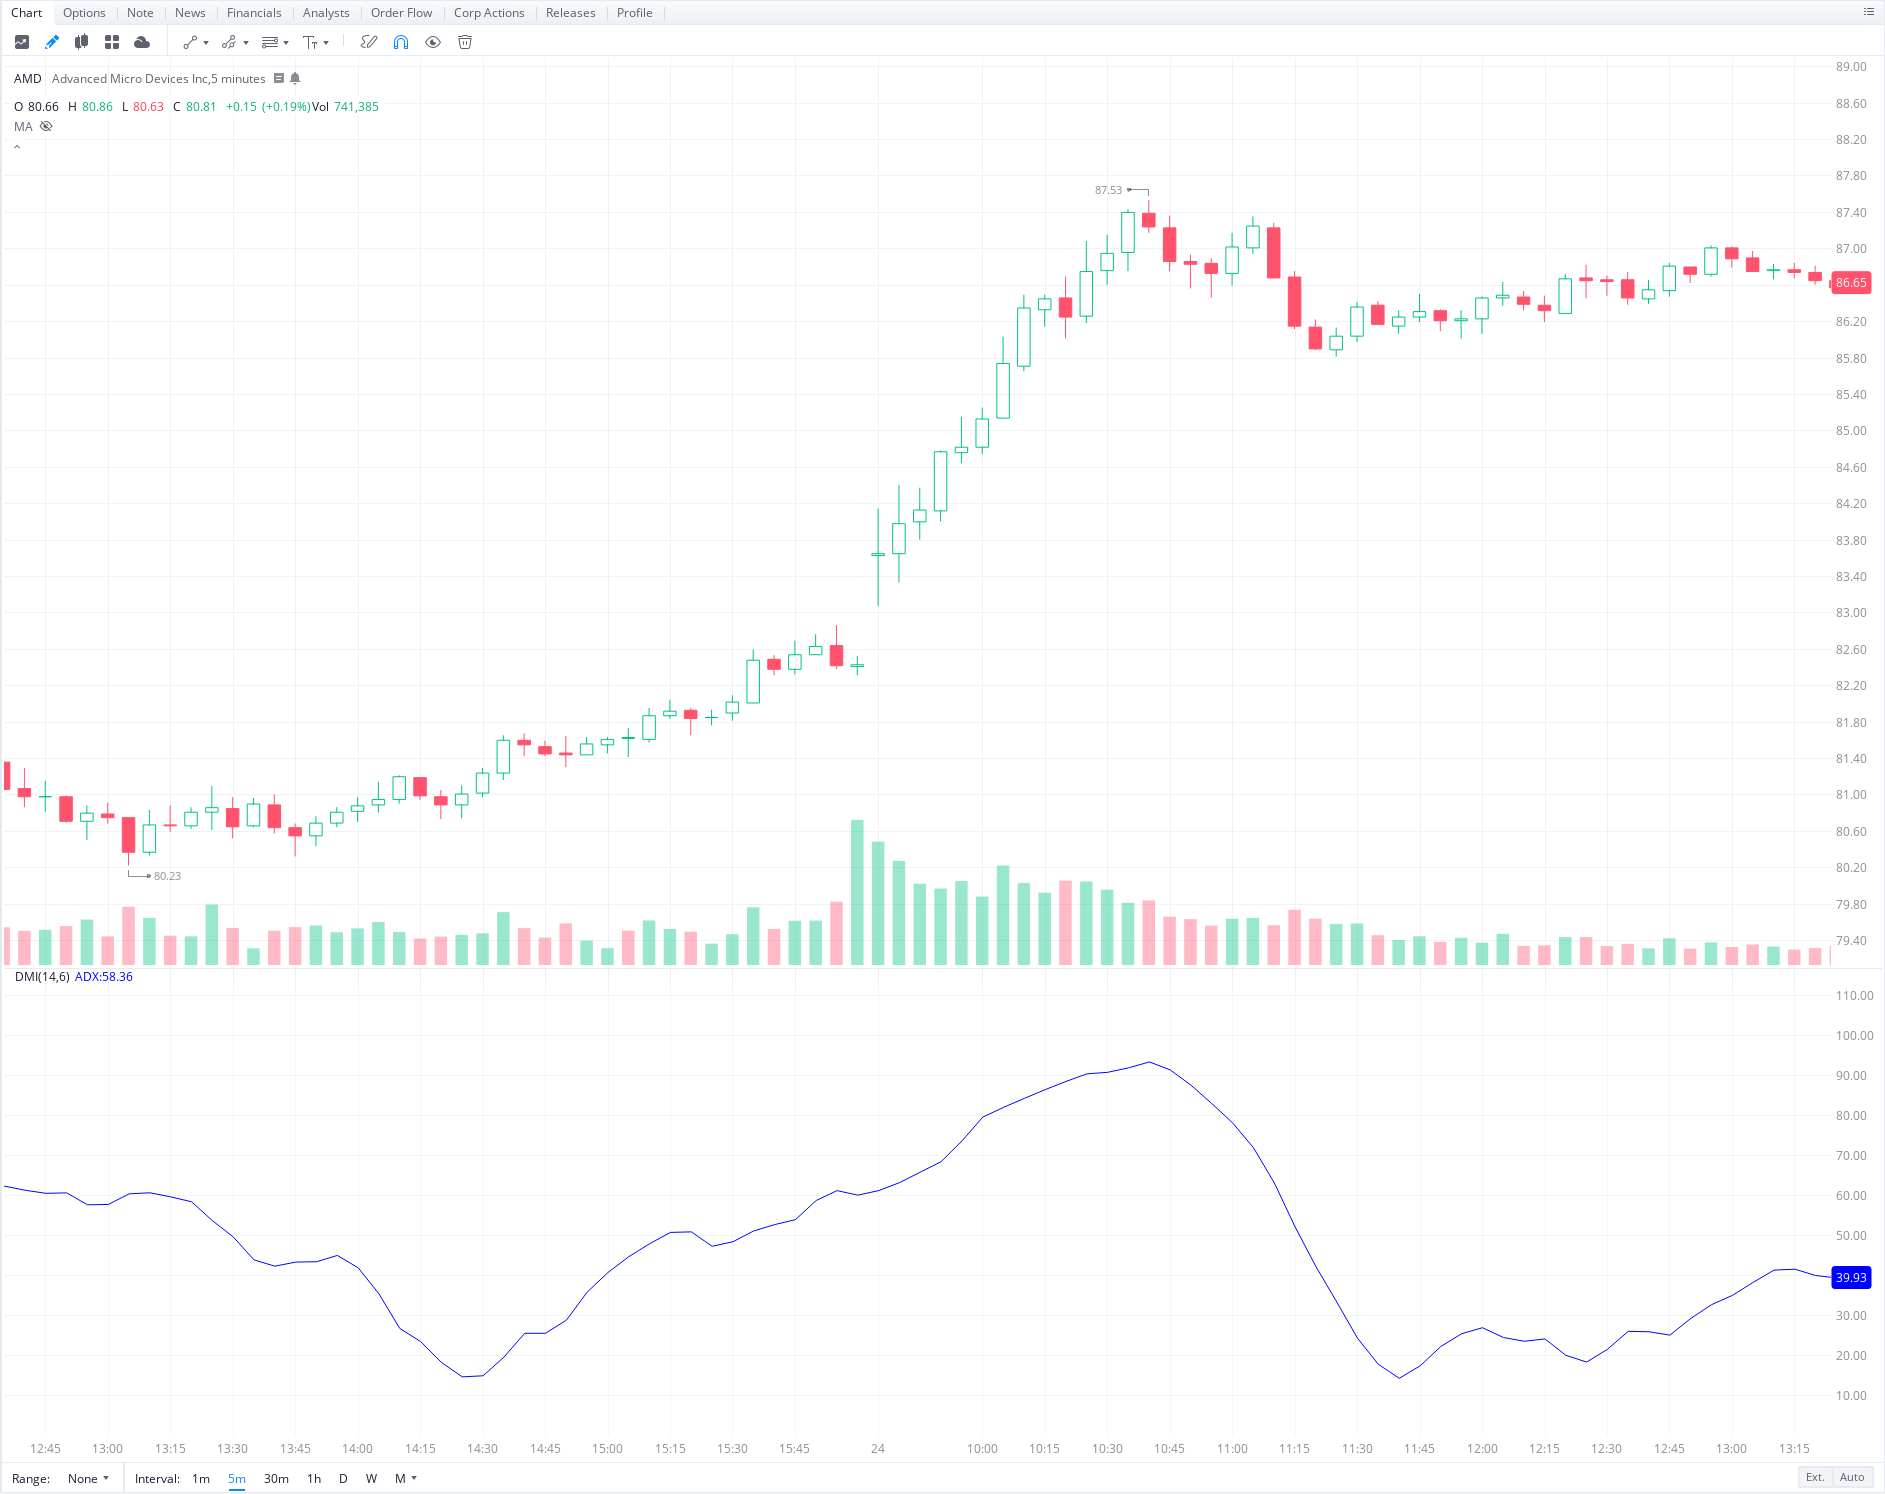
- The ADX, or "Average Directional Index", is a technical indicator that measures the strength of the current trend.
- An ADX value above 25 signifies that the current trend is strong, while an ADX value below 25 means that the current trend is weak.
- The main disadvantage with the ADX is that it does not tell you the direction of the trend.
- Here is an example of the ADX with the 5-minute chart for AMD. We can see that as the price starts to increase at a faster rate, the ADX increases, and as soon as the rate of price reaches a level of resistance, the ADX starts to decrease.
-
DMI
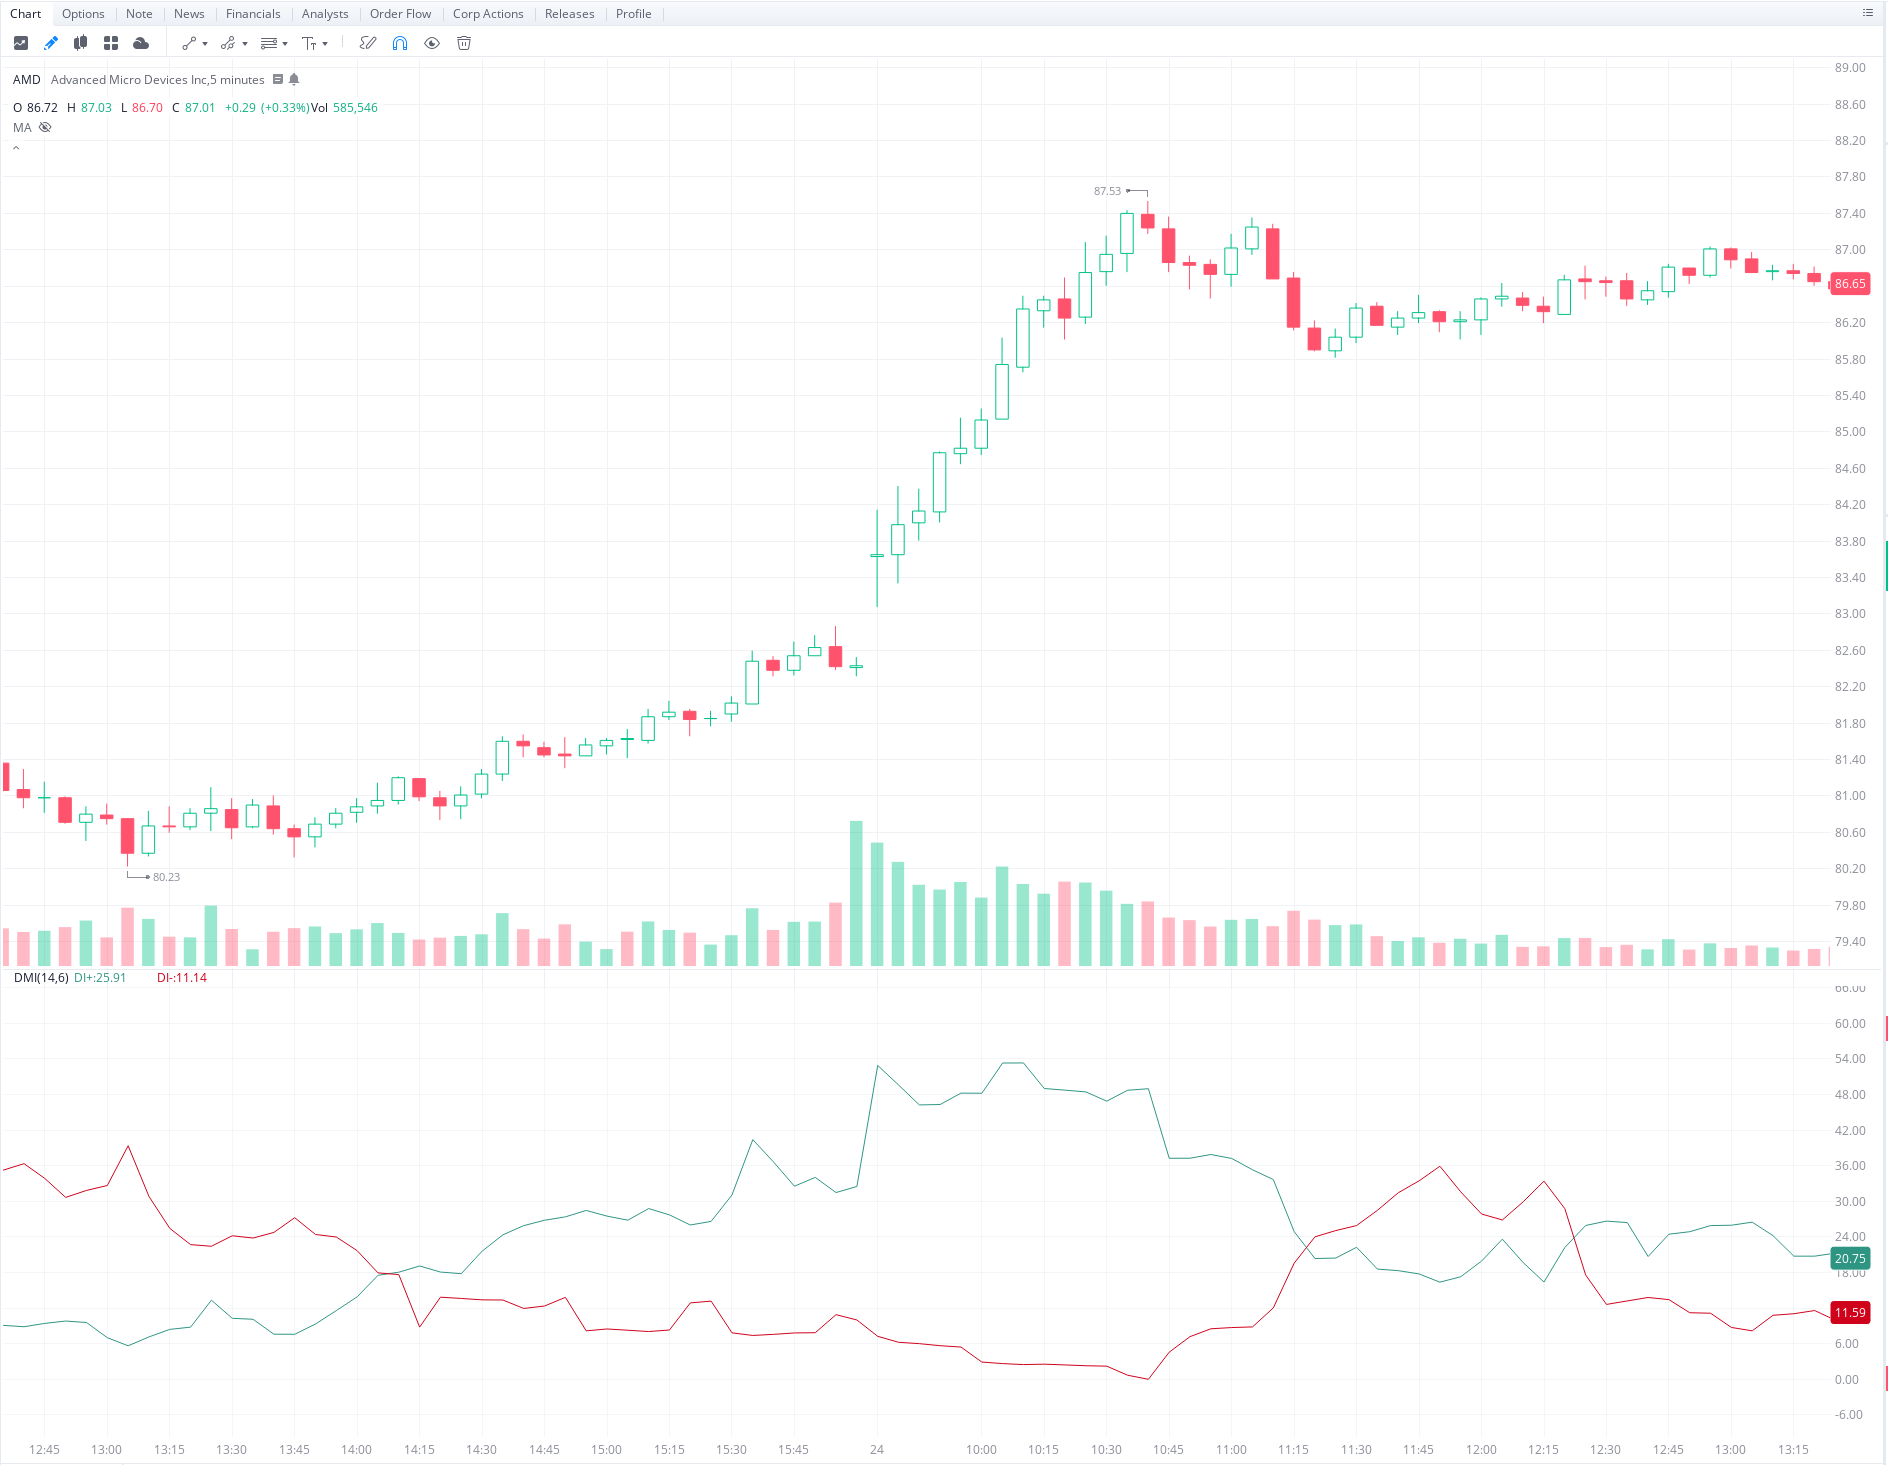
- To get the direction of a current trend, one can use the +DI and -DI, which are the positive and negative directional indicators that are a part of the DMI.
- When the +DI is above the -DI, it signifies that an uptrend is taking place.
- When the -DI is above the +DI, it signifies that a downtrend is taking place.
- Here is an example of the +DI and -DI with the 5-minute chart for AMD. We can see that when the +DI is above the -DI, the price is increasing. Additionally, when the -DI is above the +DI, the price decreases.
-
Entering Positions
- The 3 things to consider when entering a position are
- Trend Strength: We want to make sure the ADX is above 25 when we enter positions.
- DI Crossover: We want to check points were the +DI crosses over the -DI, or were the -DI crosses over the +DI. These crossovers are points were the trend may shift from uptrend to downtrend or vice versa.
- For a Long position, we want to see when the +DI crosses over the -DI.
- For a Short position, we want to see when the -DI crosses over the +DI.
- Increasing Trend Strength: We want to make sure that is trend is increasing in strength before entering a position.
- The 3 things to consider when entering a position are
-
Stop-Loss Margins
- The size of the stop-loss is determined by the length of the candle during which the position was entered in.
- For example, suppose we entered a long position at 83.00. And the candle had a high of 83.20 and a low of 82.80. The length of this candle would be the difference between the high and low, which is 0.40. Therefore, our stop-loss would be 83.00 - 0.40 = 82.60
- If we were entering a short position, the stop-loss would be 83.00 + 0.40 = 83.40
- For example, suppose we entered a long position at 83.00. And the candle had a high of 83.20 and a low of 82.80. The length of this candle would be the difference between the high and low, which is 0.40. Therefore, our stop-loss would be 83.00 - 0.40 = 82.60
- The size of the stop-loss is determined by the length of the candle during which the position was entered in.


Below is a brief outline for what role each .py file plays in this project:
-
Authenticate
- In order to use the TD Ameritrade API, you must have a TD Ameritrade brokerage account.
- The code in this file verifies that you are authorized to interact with the API.
- In addition to verification, this file also stores a list of ticker symbols I would like to look at.
- For this project, I have synced the watchlist to the 10 equities with the greatest intraday volume, but for testing purposes, I have set the list to just /ES since the futures market is open longer.
- For this project, I have synced the watchlist to the 10 equities with the greatest intraday volume, but for testing purposes, I have set the list to just /ES since the futures market is open longer.
-
Streaming
- Initializes a stream, which gets the timesales for every ticker symbol in the watchlist speicifed within authenticate.py.
- The data contained in a timesale is the following.
- Symbol: The ticker symbol of the equity that was purchased.
- Time: The time the purchase was made, expresed as an epoch.
- Price: The price at which each share of the equity was purchased at.
- Volume: The amount of shares that were purchased.
- This data is then processed and stored in a local SQL database in Price.py
-
Price
- Contains SQL tables which that store all of the price data for the ticker symbols within our watchlist.
- Creates candlesticks, which highlight the open, high, low, close prices, and total volume during a given period (typically 5 minute intervals).
- Additionally stores the values for the ADX, +DI, and -DI for each ticker symbol at any given time.
-
Technical Analysis
- Calculates the values for the ADX, +DI, and -DI for a given ticker symbol at a given time.
- The calculations are performed after each timesale, which makes the values identical to the values displayed on a techincal analysis chart on TD Ameritrade's ThinkOrSwim platform.
-
Signals
- Contains another SQL table which stores all of the generated buy signals for any ticker within our watchlist.
- Within this file, the speicifications of whether to enter a long or short position are also defined.
- This SQL table will used to offically send Stop-Loss and OCO orders to TD Ameritrade.
-
Storing Orders
- While I have an SQL table in Signals.py that stores all of the buy signals, I would take to have another table which stores all of the purchases and sales that the program has made.
- While I have an SQL table in Signals.py that stores all of the buy signals, I would take to have another table which stores all of the purchases and sales that the program has made.
-
Determining Take-Profit Margins
- While I have defined a specific Stop-Loss margin, I am still decided on the most effective Take-Profit margin. By examinig more data, I will be able to come to a better conclusion.
- While I have defined a specific Stop-Loss margin, I am still decided on the most effective Take-Profit margin. By examinig more data, I will be able to come to a better conclusion.