- Overview
- Pre-requisites
- Installation & Configuration
- Dashboards
- Test Alerts
- Utility Scripts
- Security Considerations
- Troubleshooting
Here's a quick start to stand-up a Prometheus stack containing Prometheus, Grafana and to monitor website uptime.
Here are links to the blog and video tutorials so you can follow along.
This tutorial assumes you are running on a Ubuntu 16.04 server. I like using this Digital Ocean image. You can also use your own service provider.
Once you have your Ubuntu node ready, go to the Installation & Configuration section below.
If you already have a Digital Ocean account, you can click here to create a new droplet.
If you don't already have a Digital Ocean account, create one using this link to create an account and get $10 in credits when you create your account.
For this demo the smallest standard droplet will do. If you don't know how to create a droplet or how to SSH into it you can follow my demo on Medium.
For a one click install experience run the following command:
curl https://raw.githubusercontent.com/PagerTree/prometheus-grafana-alertmanager-example/master/install.sh -H 'Cache-Control: no-cache' | sudo sh
At this point you'll have automagically deployed the entire Grafana and Prometheus stack. You can now access the Grafana dashboard at http://<Host IP Address>:3000 Username: admin, Password: 9uT46ZKE. Note: before the dashboards will work you need to follow the Datasource Configuration section.
Here's a list of all the services that are created:
| Service | Port | Description | Notes |
|---|---|---|---|
| Prometheus | :9090 | Data Aggregator | |
| Alert Manager | :9093 | Adds Alerting for Prometheus Checks | |
| Grafana | :3000 | UI To Show Prometheus Data | Username: admin, Password: 9uT46ZKE |
| Node Exporter | :9100 | Data Collector for Computer Stats | |
| CA Advisor | :8080 | Collect resource usage of the Docker container | |
| Blackbox Exporter | :9115 | Data Collector for Ping & Uptime |
If you would like to add or change the Ping targets should be monitored you'll want to edit the targets section in prometheus/prometheus.yml
...

- job_name: 'blackbox'
  metrics_path: /probe
  params:
    module: [http_2xx]
  static_configs:
    - targets:
      - https://pagertree.com # edit here
      - https://google.com # edit here

...
If you made changes to the Prometheus config you'll want to reload the configuration using the following command:
curl -X POST http://<Host IP Address>:9090/-/reload
The PagerTree configuration requires to create a Prometheus Integration. Follow steps 1-6 here then replace https://ngrok.io in /alertmanager/config.yml with your copied webhook.
...
receivers:
    - name: 'pager'
      webhook_configs:
      - url: https://ngrok.io # replace with your PagerTree webhook url
...
If you made changes to the AlertManager config you'll want to reload the configuration using the following command:
curl -X POST http://<Host IP Address>:9093/-/reload
Included are two dashboards. You can always find more dashboards on the Grafana Dashboards Page.
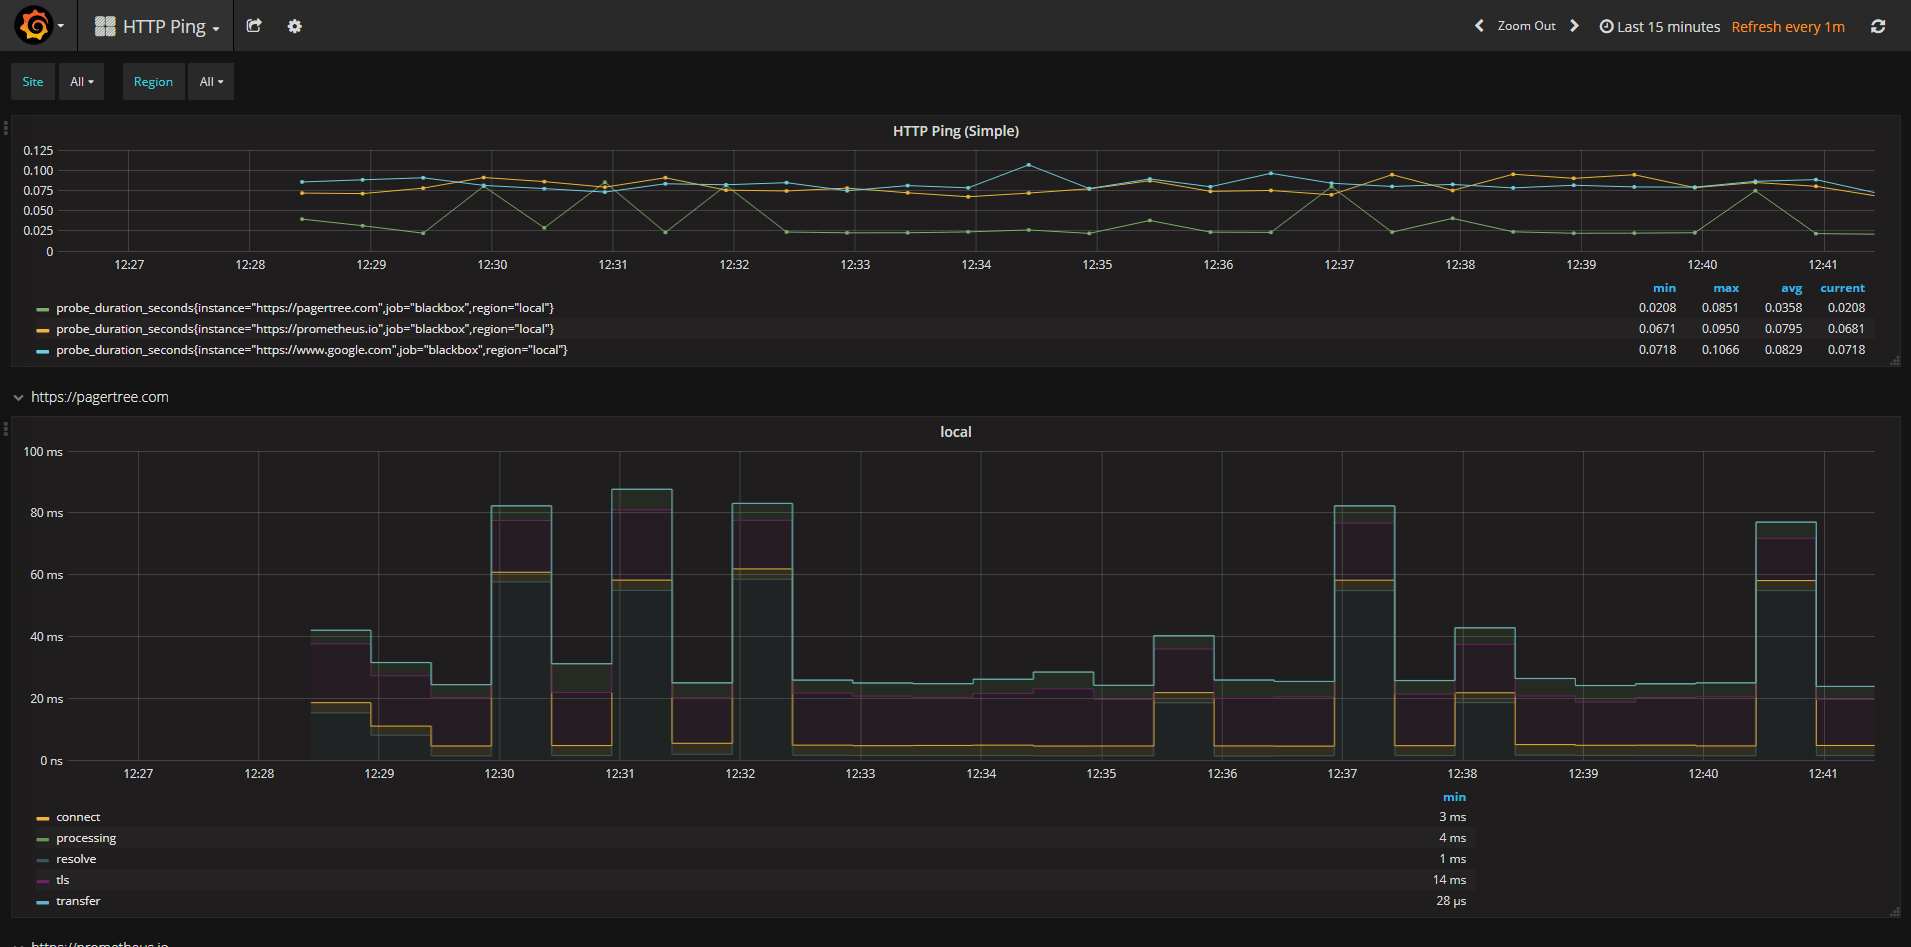
Shows HTTP uptime from websites monitored. See Ping Configuration section.
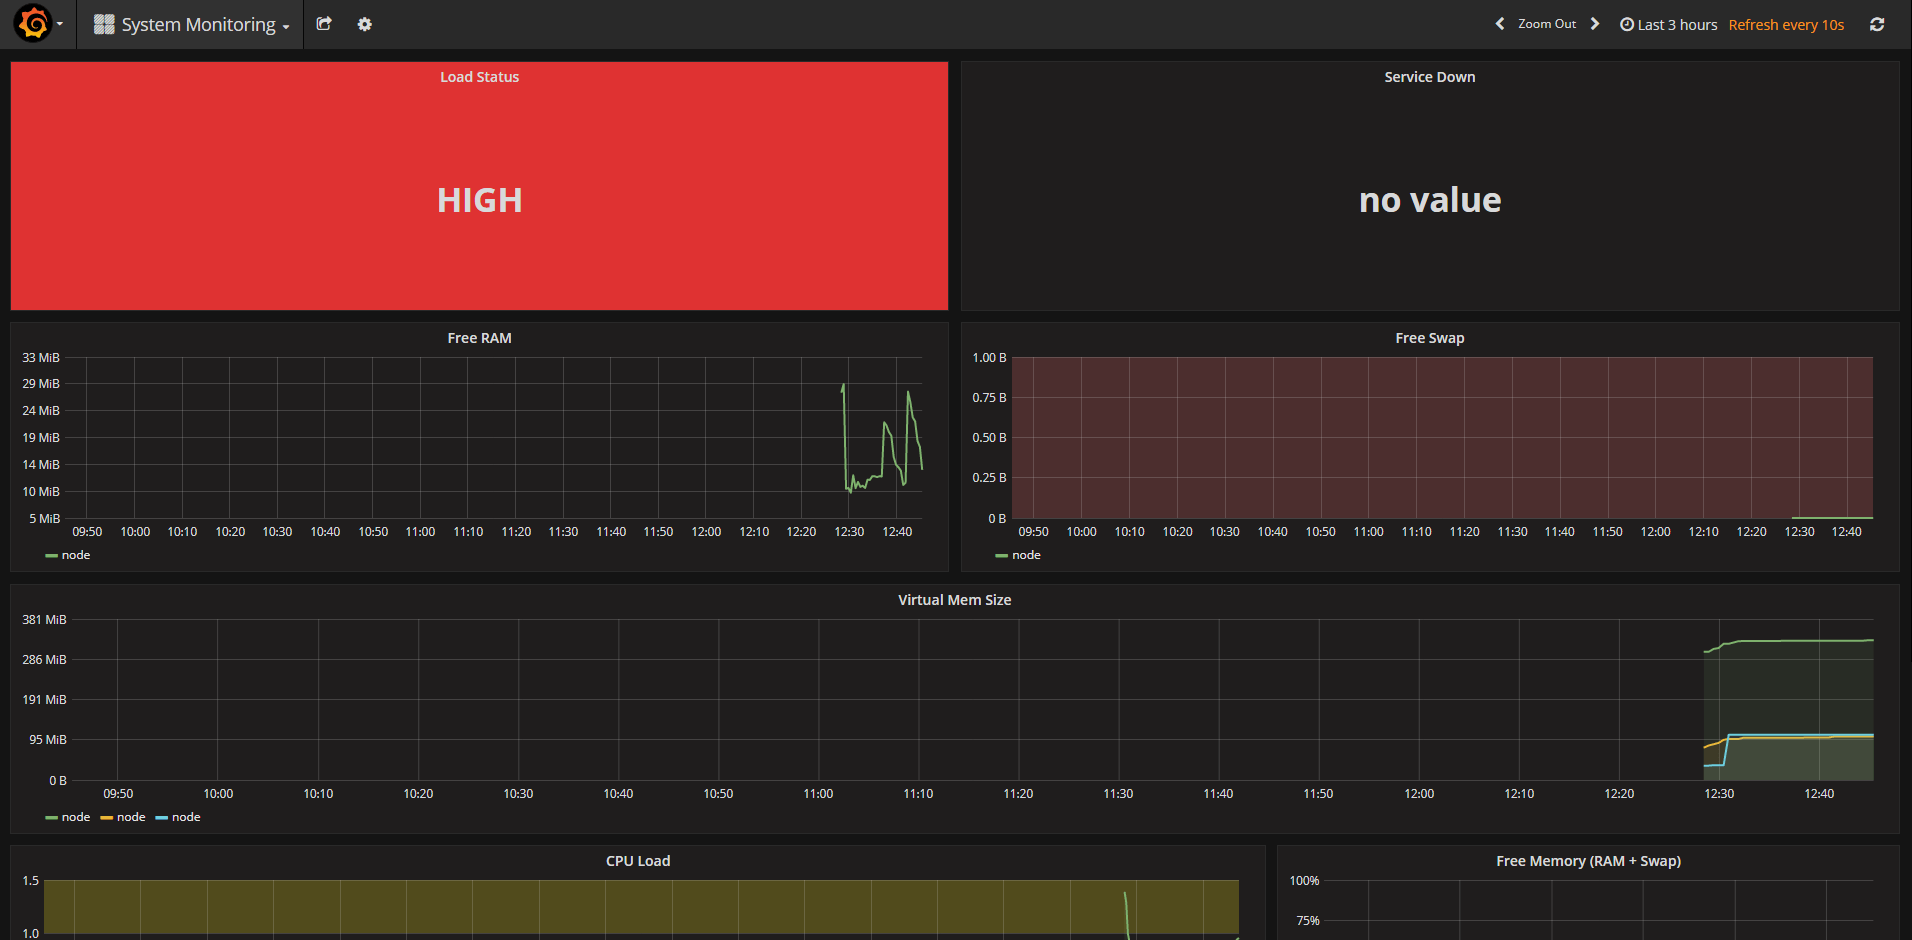
Shows stats like RAM, CPU, Storage of the current node.
We've provided some utility scripts in the util folder.
| Script | Args | Description | Example |
|---|---|---|---|
| docker-log.sh | service | List the logs of a docker service by name | ./util/docker-log.sh grafana |
| docker-nuke.sh | service | Removes docker services and volumes created by this project | ./util/docker-nuke.sh |
| docker-ssh.sh | service | SSH into a service container | ./util/docker-ssh.sh grafana |
| high-load.sh | Simulate high CPU load on the current computer | ./util/high-load.sh | |
| restart.sh | Restart all services | ./util/restart.sh | |
| start.sh | Start all services | ./util/start.sh | |
| status.sh | Print status all services | ./util/status.sh | |
| stop.sh | Stop all services | ./util/stop.sh |
There are 3 basic alerts that have been added to this stack.
| Alert | Time To Fire | Description |
|---|---|---|
| Site Down | 30 seconds | Fires if a website check is down |
| Service Down | 30 seconds | Fires if a service in this setup is down |
| High Load | 30 seconds | Fires if the CPU load is greater than 50% |
To get alerts sent to you, follow the directions in the Alert Configuration Section.
A quick test for your alerts is to simulate high CPU load. Run the utility script ./util/high-load.sh and about 30 seconds or so later you should notice the incident created in PagerTree (assuming you followed the Alert Configuration Section and you'll also get notifications.
Then Ctrl+C to stop this command. The incident should auto resolve in PagerTree.
This project is intended to be a quick-start to get up and running with Docker and Prometheus. Security has not been implemented in this project. It is the users responsibility to implement Firewall/IpTables and SSL.
Since this is a template to get started Prometheus and Alerting services are exposing their ports to allow for easy troubleshooting and understanding of how the stack works.
Here are just a couple security considerations for this stack to help you get started.
- Remove the published ports from Prometheus and Alerting services and only allow Grafana to be accessed
- Enable SSL for Grafana with a Proxy such as jwilder/nginx-proxy or Traefik with Let's Encrypt
- Add user authentication via a Reverse Proxy jwilder/nginx-proxy or Traefik for services cAdvisor, Prometheus, & Alerting as they don't support user authenticaiton
- Terminate all services/containers via HTTPS/SSL/TLS
It appears some people have reported no data appearing in Grafana. If this is happening to you be sure to check the time range being queried within Grafana to ensure it is using Today's date with current time.
Node-Exporter is not designed to run on Mac and in fact cannot collect metrics from the Mac OS. I recommend you comment out the node-exporter section in the docker-compose.yml file and instead just use the cAdvisor.

