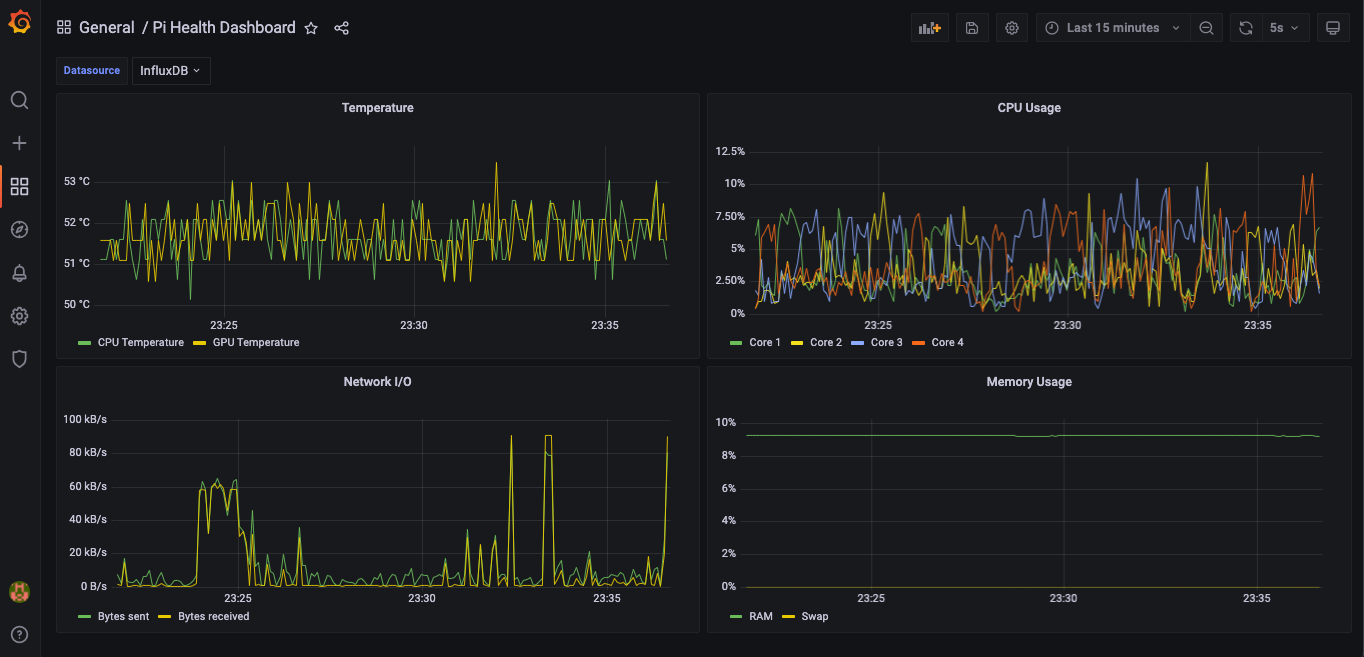
pi-stat is a tool to collect Raspberry Pi health metric (temperature, CPU and RAM utilization) at fixed interval and send them to InfluxDB instance, which then can be visualized through a Grafana dashboard
- Temperature
- CPU Temperature
- GPU Temperature
- CPU
- Usage per core
- RAM
- RAM usage
- Swap memory usage
- Network
- Bytes sent per second
- Bytes received per second
- Docker engine, CLI and docker-compose (if you want to run InfuxDB and Grafana via docker)
- Python3 and Pip3
- Raspberry Pi (of course!)
The project was built and tested using below
- Raspberry Pi 4B board with 8GB RAM
- Raspbian GNU/Linux 10 (buster) 32 bit OS
- clone the repo into pi folder system
- run InfluxDB and Grafana (using any of the below approach)
- locally installed on Pi OS
- via Docker containers (run
docker-compose -f docker-compose.yaml -dif you have docker-compose installed)
- [if installed without docker-compose] open influx shell and create a new bucket by running below
create database pistat - copy
.env.samplefile to.envand set the values as applicable - run
pip3 install -r requirements.txtto install the required python packages - run
python3 pi-stat/getstat.py - if configurations are correct, pi-stat utility should start pushing metrics to Influx DB. Keep the console running
- Open Grafana instance and login
- add a new InfluxDB data source and point it to running InfluxDB instance
- create a new dashboard by importing
dashboard.jsonand select the InfluxDB datasource on the dashboard variable
