
A Real Estate startup company based out of New York is looking where to invest in single family homes in the North East of the US.
We obtained our dataset from zillow and we downloaded the average price of a house per zipcode (all U.S. zipcodes) from January 31st, 2000 to August 31st, 2021
Data Size: Because our data is so big we decided not to load it onto our github. The data is over 35,000 rows and over 250 columns.
To download this data, please use this link https://www.zillow.com/research/data/, then change the 'Home Values' Geography to zipcode and download.
This is a csv file that gives us the average home values in the U.S. for each zipcode per month.
Our target is to forecast future home values in northeast to see which zipcodes would be good for investment purposes.
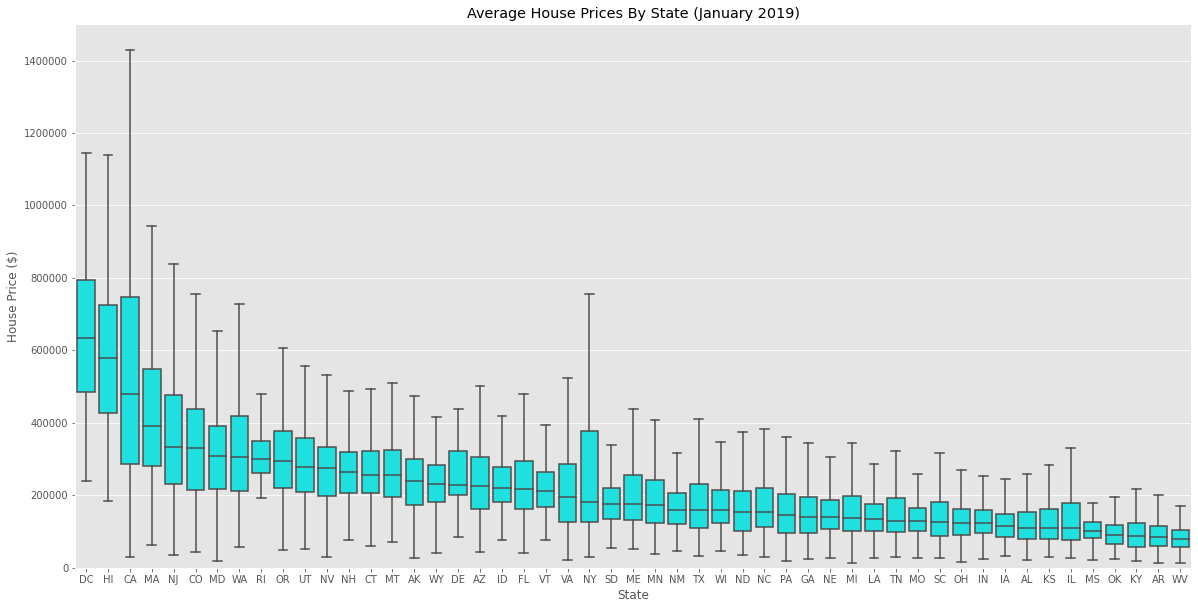
For visualization, we used median average home values per state.
First we found the top 5 zipcodes that had the highest annual average return per year.
We found that zipcodes 02558, 11216, 19122, 19121, 11222 are the best areas to invest in.
- Zipcode 02558 has 42.5% annual average return rate.
- Zipcode 11216 has 29.9% annual average return rate.
- Zipcode 19122 has 27.9% annual average return rate.
- Zipcode 19121 has 26.5% annual average return rate.
- Zipcode 11222 has 24.5% annual average return rate.
With the top 5 zip codes we found above, we will forecast future home values.
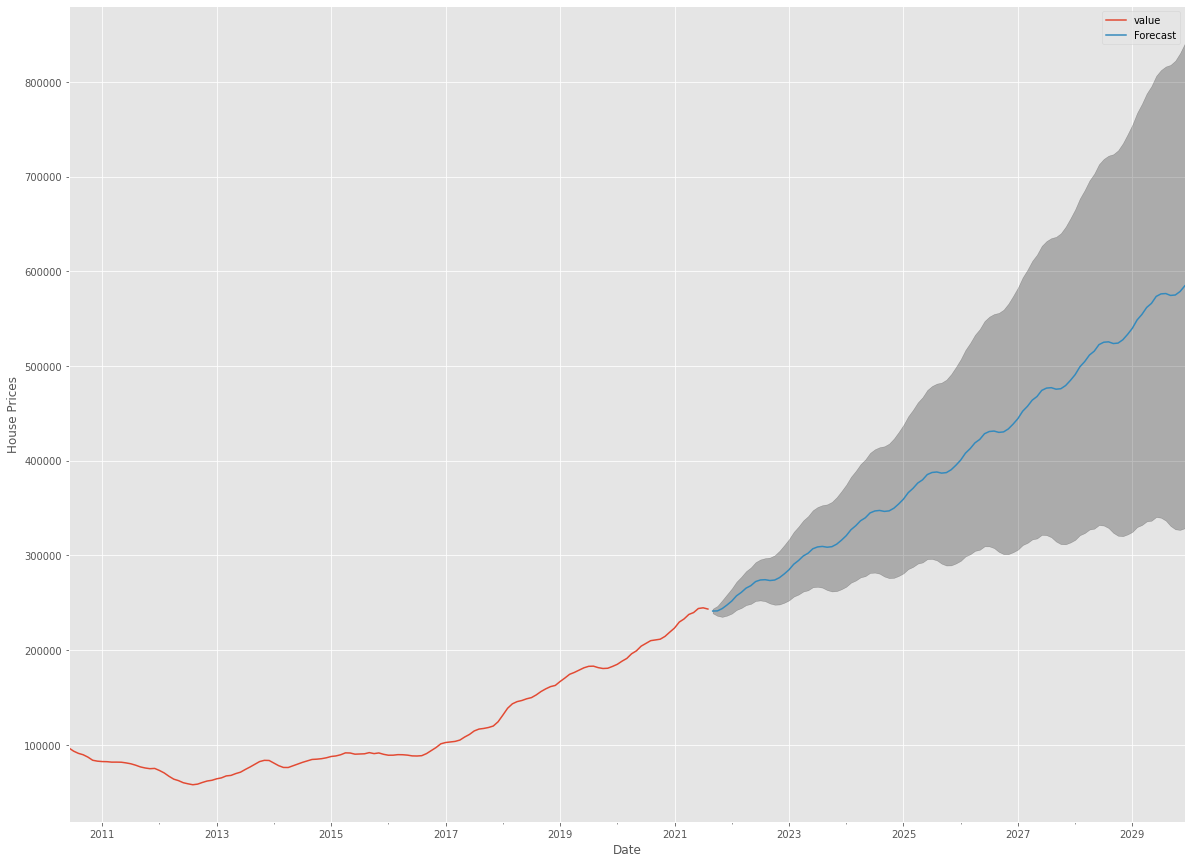
After making our data stationary, we used SARIMAX to model our data. Our SARIMAX model with order=(1, 1, 2) and seasonal_order=(0, 2, 2, 12) got the lowest aic score, which was 3811.805781. Then, we forecasted future home values for zip code 02558.
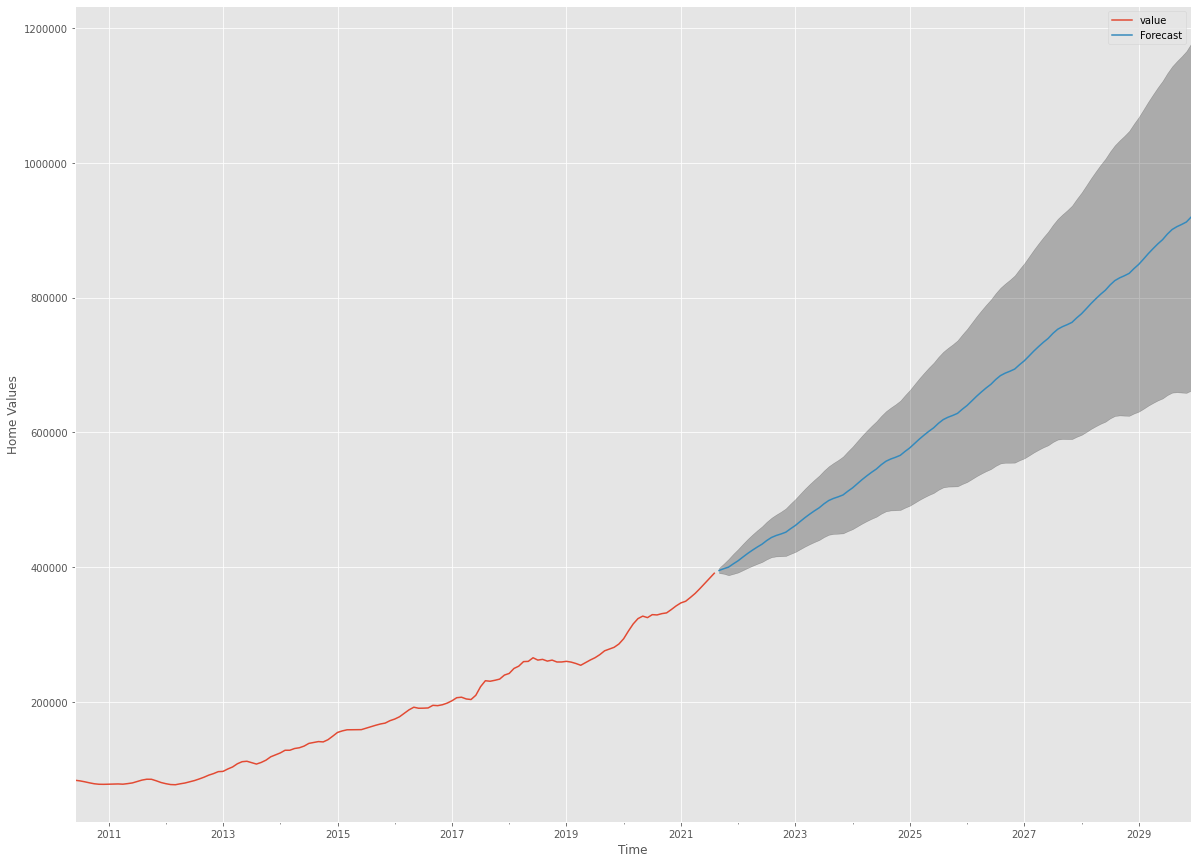
Both the forecasts and associated confidence interval that we have generated can now be used to further understand the dataset for zip code 02558 and foresee what to expect. We get less confident as we go more into the future.
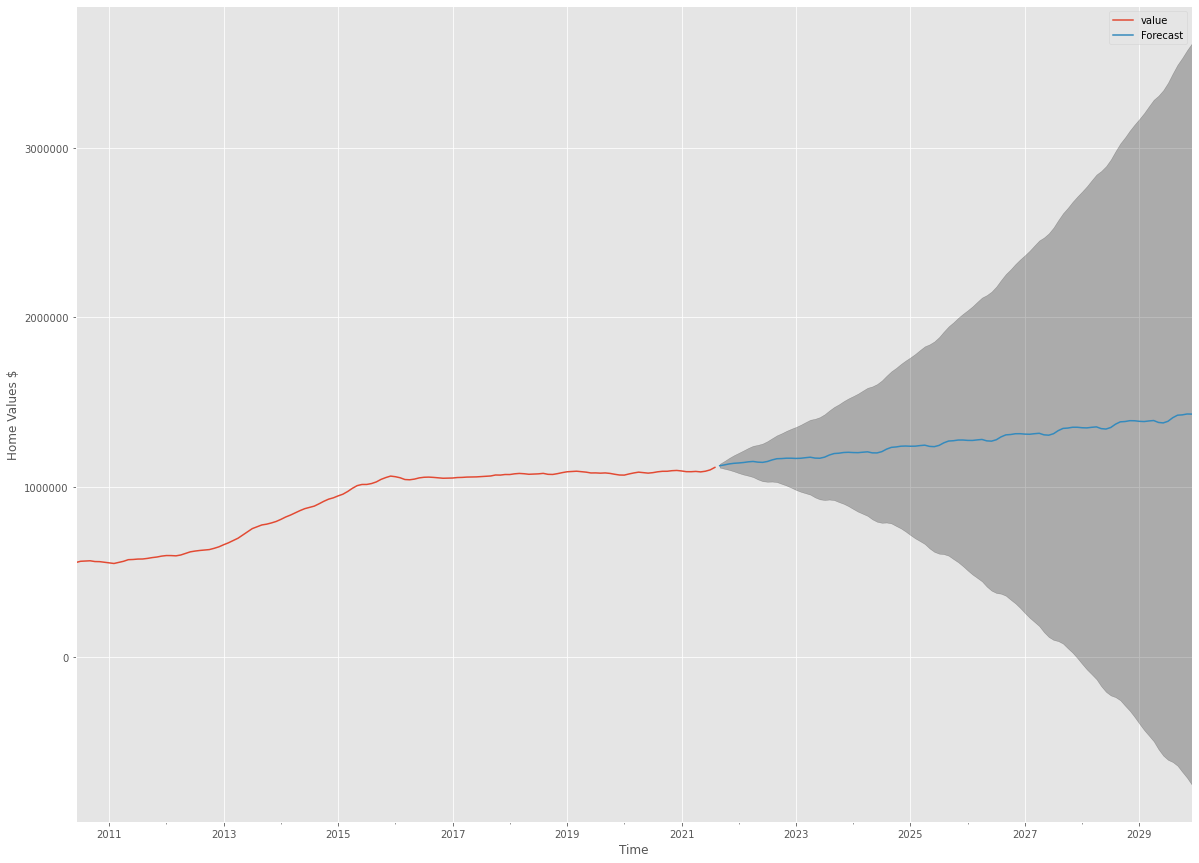
After making our data stationary, we used SARIMAX to model our data. Our SARIMAX model with order=(0, 2, 2) and seasonal_order = (2, 2, 2, 12) got the lowest aic score, which was 4134.18389. Then, we forecasted future home values for zip code 11216.
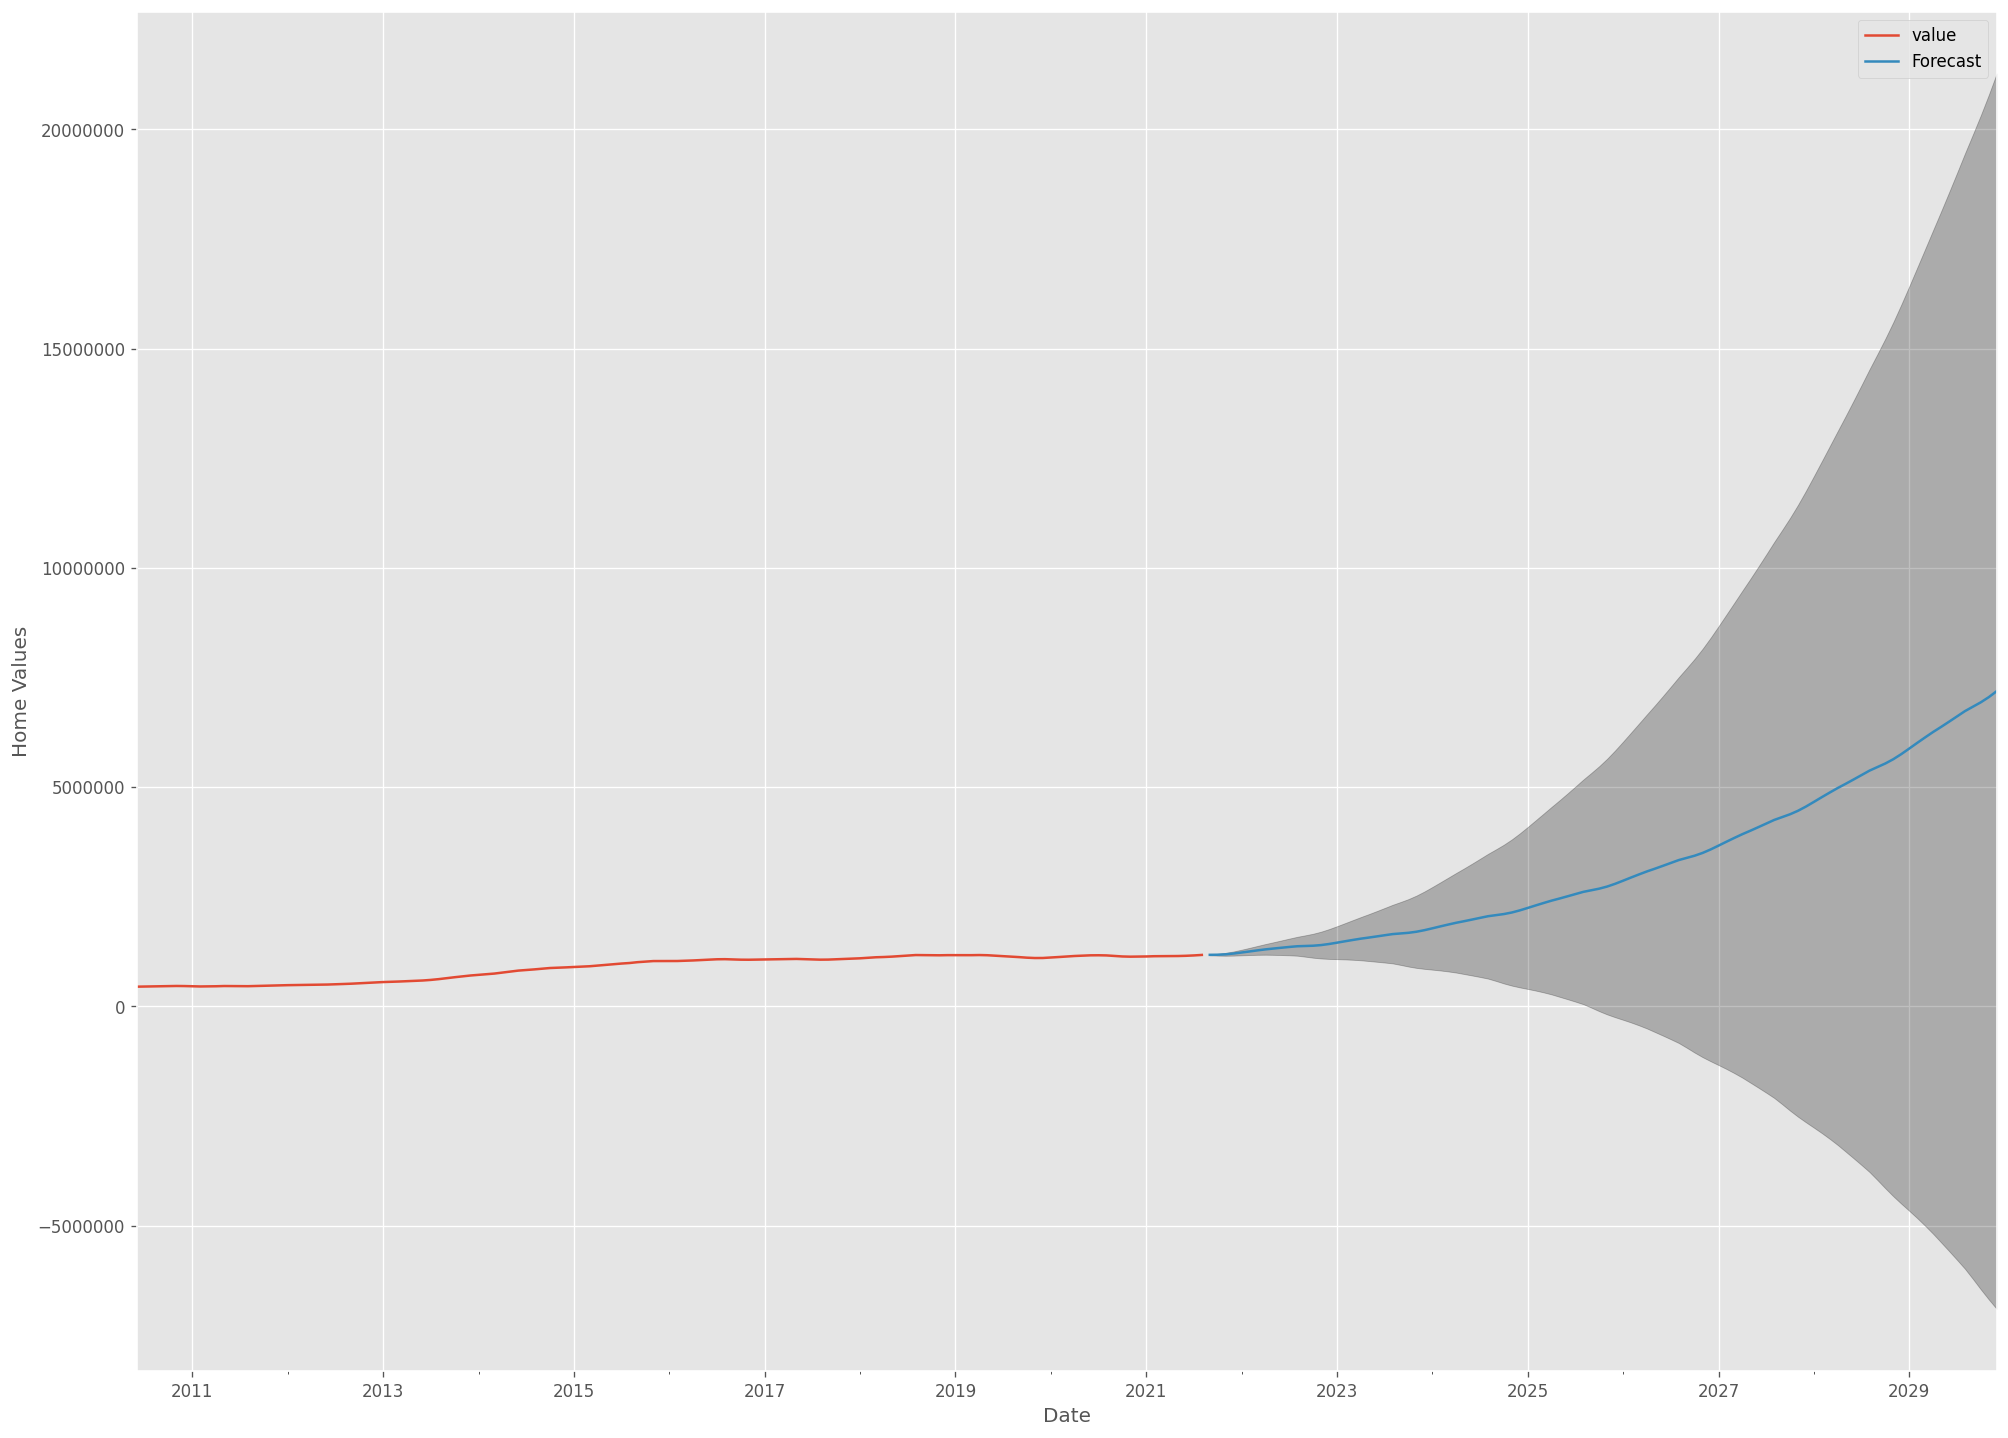
Both the forecasts and associated confidence interval that we have generated can now be used to further understand the dataset for zip code 11216 and foresee what to expect. We get less confident as we go more into the future.
After making our data stationary, we used SARIMAX to model our data. Our SARIMAX model with order=(0, 1, 2) and seasonal_order=(2, 2, 2, 12) got the lowest aic score, which was 3590.957746. Then, we forecasted future home values for zip code 19122.
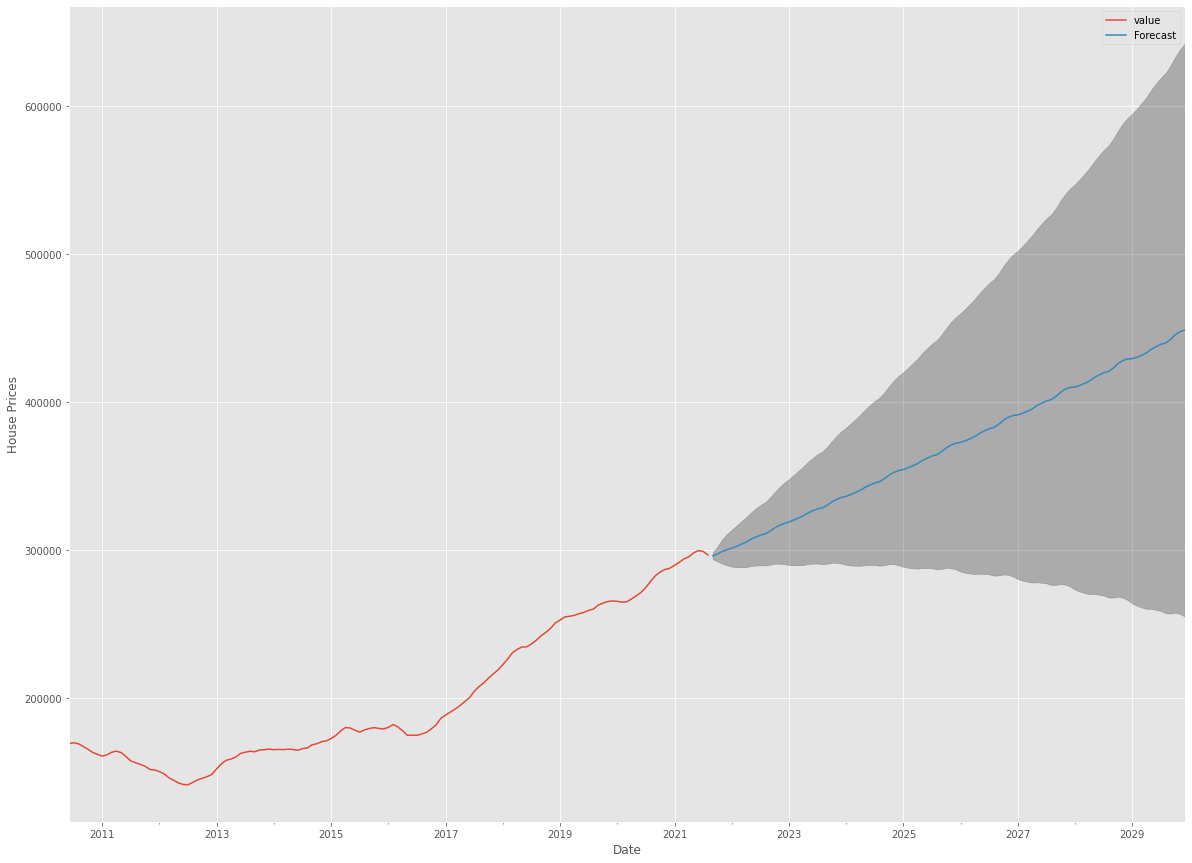
Both the forecasts and associated confidence interval that we have generated can now be used to further understand the dataset for zip code 19122 and foresee what to expect. We get less confident as we go more into the future.
After making our data stationary, we used SARIMAX to model our data. Our SARIMAX model with order=(0, 1, 2) and seasonal_order=(1, 2, 2, 12) got the lowest aic score, which was 3592.008805. Then, we forecasted future home values for zip code 19121.
Both the forecasts and associated confidence interval that we have generated can now be used to further understand the dataset for zip code 19121 and foresee what to expect. We get less confident as we go more into the future.
After making our data stationary, we used SARIMAX to model our data. Our SARIMAX model with order=(1, 1, 1) and seasonal_order=(2, 2, 1, 12) got the lowest aic score, which was 4228.479308. Then, we forecasted future home values for zip code 11222.
Both the forecasts and associated confidence interval that we have generated can now be used to further understand the dataset for zip code 11222 and foresee what to expect. We get less confident as we go more into the future.
- Best focus would be Wareham, MA 02558.
- In the next ten years our model predicts that the average home price in Wareham will double.
├── ignore - working notebooks
├── images
├── .gitignore
├── EDA_Data_Processing.ipynb
├── Maps.ipynb
├── Zipcode_02558.ipynb
├── Zipcode_11216.ipynb
├── Zipcode_11222.ipynb
├── Zipcode_19121.ipynb
├── Zipcode_19122.ipynb
├── Powerpoint_Forecasting_Home_Value.pdf
├── README.md