In this code pattern, we will create and deploy a customer churn prediction model using IBM Cloud Private for Data. First, we will load customer demographics and trading activity data into Db2 Warehouse. Next, we'll use a Jupyter notebook to visualize the data, build hypotheses for prediction, and then build, test, and save a prediction model. Finally, we will enable a web service and use the model from an app.
The use case describes a stock trader company that can use churn prediction to target offers for at-risk customers. Once deployed, the model can be used for inference from an application using the REST API. A simple app is provided to demonstrate using the model from a Python app.
When the reader has completed this code pattern, they will understand how to:
- Load data into Db2 Warehouse
- Run a Jupyter notebook
- Visualize data using Brunel
- Create a model using Spark ML library
- Deploy the model as a web service
- Access the model from an external app for inference (churn risk prediction)

- Data is loaded into Db2 Warehouse
- Jupyter notebook accesses data
- Jupyter notebook uses Brunel for information visualization
- Jupyter notebook uses Spark ML library to create a model
- Jupyter notebook saves the model to the repository for deployment
- Applications access the model via the REST API
The instructions in this code pattern assume you are using IBM Cloud Platform for Data and have access to a database using the Db2 Warehouse add-on.
Sign in to your IBM Cloud Private for Data web client. All of the steps are performed using the web client unless stated otherwise.
- Clone the repo
- Load the data into Db2 Warehouse
- Set up an analytics project
- Create the notebook
- Insert a Spark DataFrame
- Run the notebook
- Analyze the results
- Test the model in the UI
- Deploy the model
- Use the model in an app
Clone the icp4d-customer-churn-classifier repo locally. In a terminal, run the following command:
git clone https://github.com/IBM/icp4d-customer-churn-classifierIf you created a Db2 Warehouse database deployment in your IBM Cloud Private for Data cluster, you can access the integrated database console to complete common tasks, such as loading data into the database. This is a prerequisite to follow the instructions here and in the notebook, but you could easily adapt this code pattern to accept the data from another source.
- Use the left menu's
Collectdrop-down list and click onMy data. - Click on the
Databasestab. - You should see a Db2 Warehouse tile with a status of
Available(otherwise revisit the prerequisites and ensure your userid has access to a database). - Click on the tile action menu (vertical 3 dots) and select
Open.
- Click on the upper-right
☰ Menuand selectLoad. - Use drag-and-drop or click
browse filesand open thedata/mergedcustomers.csvfile from your cloned repo. - Click
Next. - Select or create the schema to use for the data.
- Select or create the table to use for the data.
- Click
Next. - Ensure that the data is being properly interpreted. For example, specify that the first row in the CSV file is a header and ensure that the comma separator is used.
- Click
Next. - Review the summary and click
Begin Load.
- Go back to
Collect ▷ My data ▷ Databases ▷ Db2 Warehousetile. - Click on the tile action menu (vertical 3 dots) and select
Details. - Copy the
Username,Password, andJDBC Connection URLto use later.
To get started, open the Projects page and set up an analytics project to hold the assets that you want to work with, and then get data for your project.
- Go to the
Projectslist and click+ New project. - Make sure
Analytics projectis select. - Provide a
Project name. - Click
OK. - Stay on the
Newtab. - Optionally, add a
Description - Click
Create.
- Use the left menu to go back to
Projects. - Select the project you created.
- In your project, use the
Data Sourcestab, and click+ Add Data Source. - Provide a
Data source nameandDescription. - Use the
Data source typedrop-down list to selectDb2 Warehouse on Cloud. - Fill in the
JDBC URL,Username, andPasswordthat you collected earlier. - Click the
Test Connectionbutton and make sure your test connection passed. - Click on
+ Add remote data set. - Provide a
Remote data set nameand aDescription. - Provide a
Schema. This is the schema that you used when you created the table. - Provide the table name (that you used when you loaded the CSV data).
- Click
Create.
To create and open the notebook from a file:
- In your project, using the
Assetstab, clickNotebooks. - Click on
+ Add Notebook. - Select the
From Filetab: - Provide a notebook
NameandDescription. - Use drag-and-drop or click
browseand open thenotebooks/TradingCustomerChurnClassifierSparkML.jupyter-py36.ipynbfile from your cloned repo. - Click
Create.
Now that you are in the notebook, add generated code to insert the data as a DataFrame and fix-up the notebook reference to the DataFrame.
-
Place your cursor at the last line of the following cell:
# Use the find data 10/01 icon and under your remote data set
# use "Insert to code" and "Insert Spark DataFrame in Python"
# here.
-
Click the find data
10/01icon on the menu bar (last icon). -
Using the
Remotetab under10/01, find the data set that you added to the project, clickInsert to codeandInsert Spark DataFrame in Python.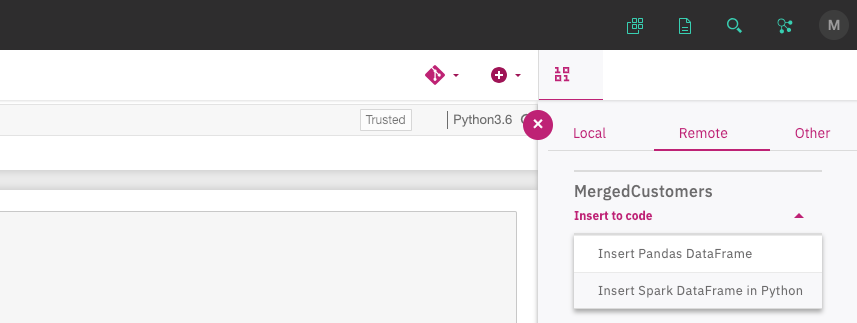
-
The inserted code will result in a DataFrame assigned to a variable named
df1ordf_data_1(perhaps with a different sequence number). Find the code cell like the following code block and edit the#to make it match the variable name.# After inserting the Spark DataFrame code above, change the following # df# to match the variable used in the above code. df_churn is used # later in the notebook. df_churn = df#

-
Run the entire notebook using the menu
Cell ▷ Run Allor run the cells individually with the play button as shown here.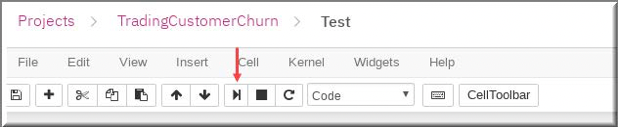

- A pod was instantiated – which means loading a complete compute Jupyter notebook environment (7+ GB) with all the artifacts from the private ICP-D registry.
- IBM Cloud Private schedules this pod on any VM – wherever CPU and memory resources are available.
- IP addresses and connections are all configured automatically.
- The same working environment can be used by multiple users. If a single pod's resources are not sufficient, another environment is created automatically.
- When the number of users grow, you can add more machines to the ICP-D cluster and scheduling of resources is handled automatically.
- ICP-D's scale-out model is pretty effective.
- You no longer have to wait days or even weeks to get the compute resources.
- IBM Cloud Private makes 40 – 60 percent more efficient use of compute resources. This means more users can be accommodated with same compute capacity. As one task completes, its resources are freed up to work on next one.
-
During the execution of a cell in a Jupyter notebook, an asterisk
[*]displays in the square bracket which changes to a sequence number when execution of that cell completes. -
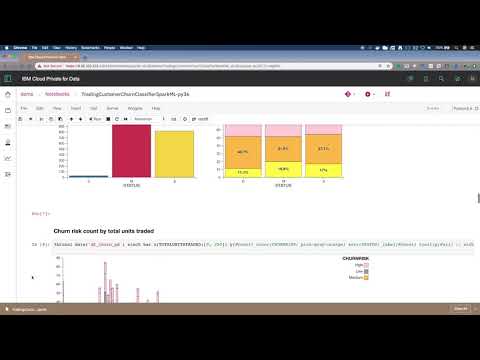
The mix of documentation, code, and output can make a Jupyter output self-explanatory. This also makes it a great environment to "show your work" if you have a hypothesis, do some analysis, and come up with a conclusion.
-
Example Brunel chart:
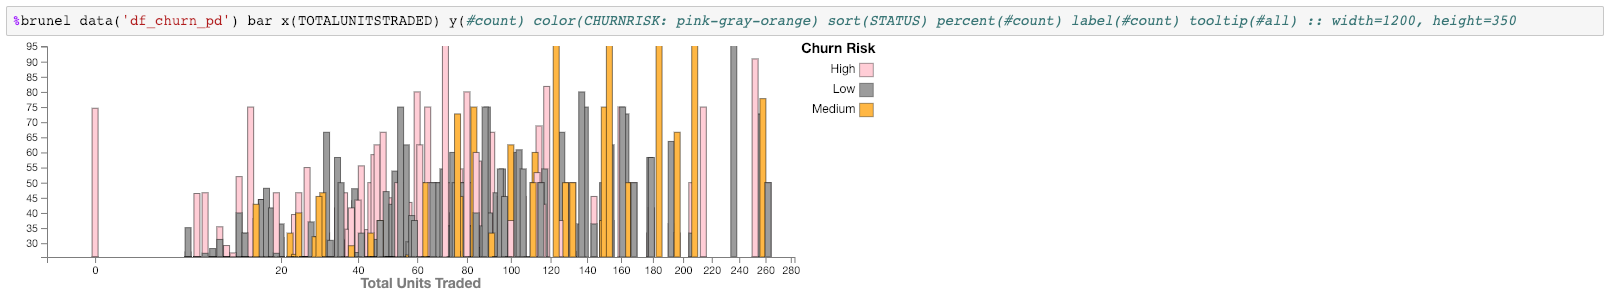
-
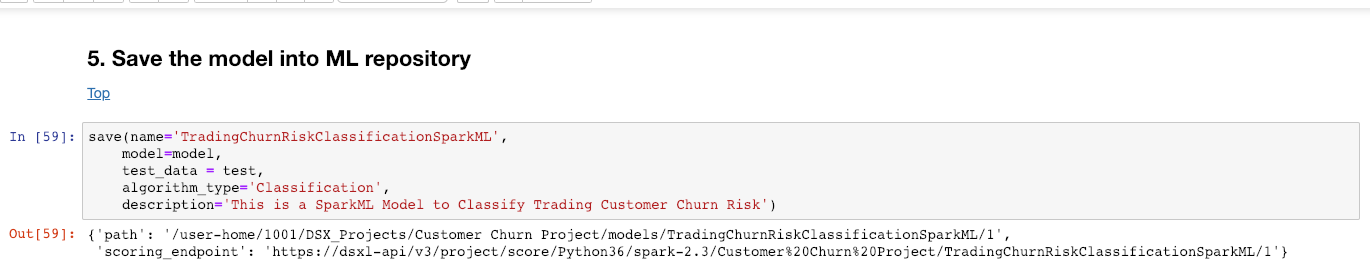
The model was saved to the repository. Next, we will test the model in the UI. Later, we'll deploy the model for external use.


IBM Cloud Private for Data provides various options for analytics models such as testing, scoring, evaluating, and publishing.
You can use real-time scoring to test your model with different input values in a easy-to-use user interface.
- In your project, using the
Assetstab, clickModels. - Click on the action menu (vertical 3 dots) and select
Real-time score.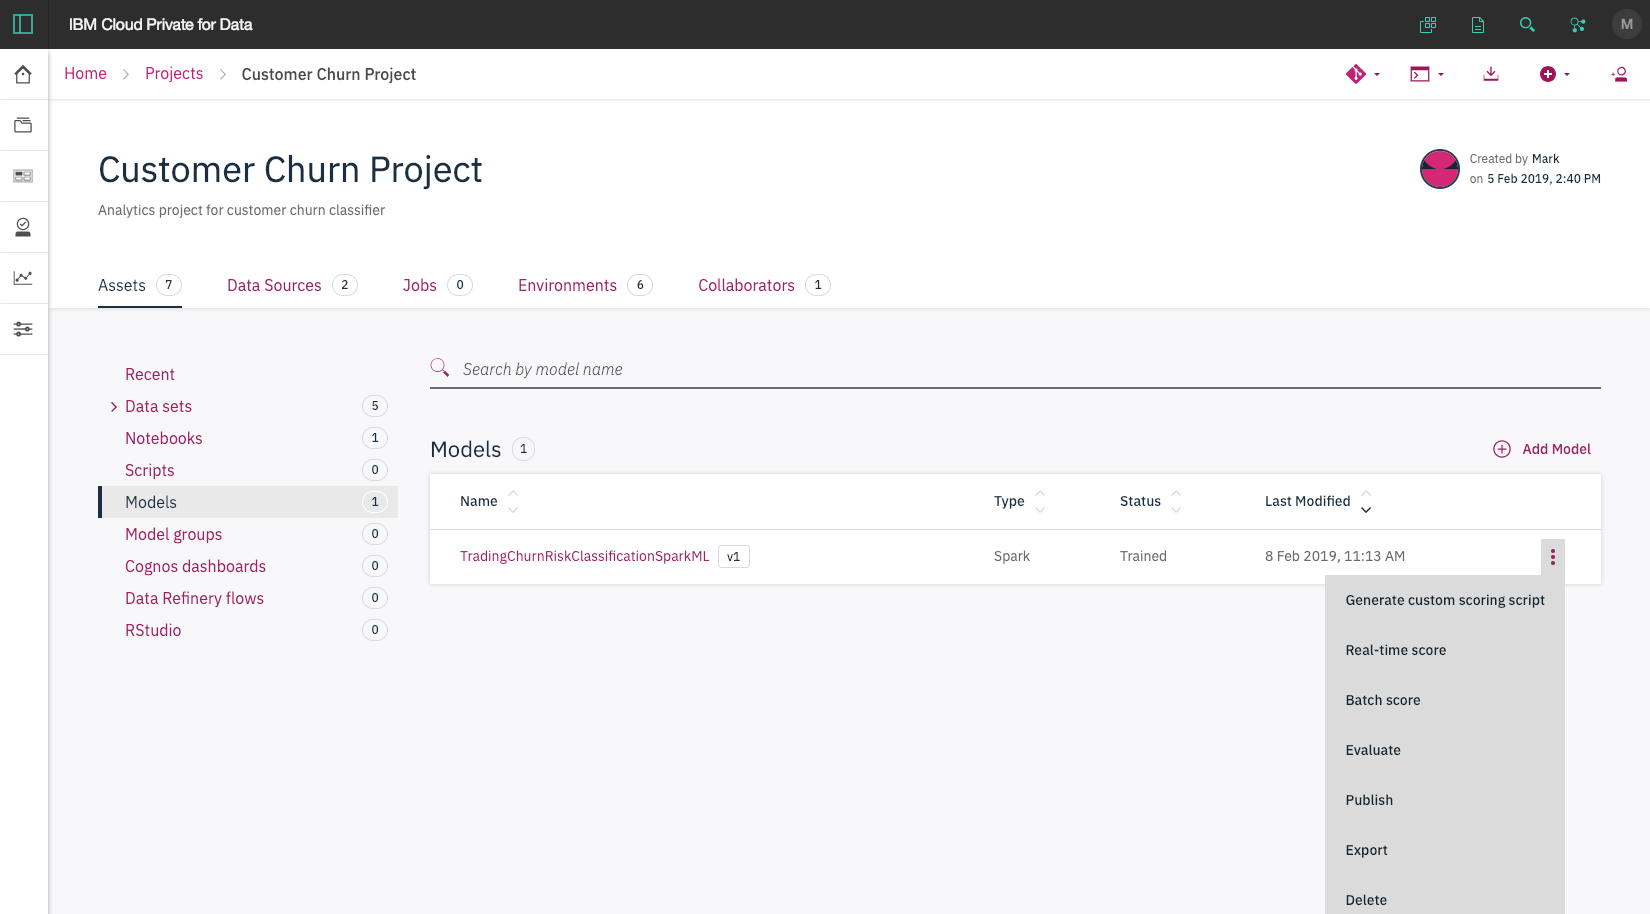
- Change some test values and click
Submit. Use the upper-right icons to select a pie chart or bar chart.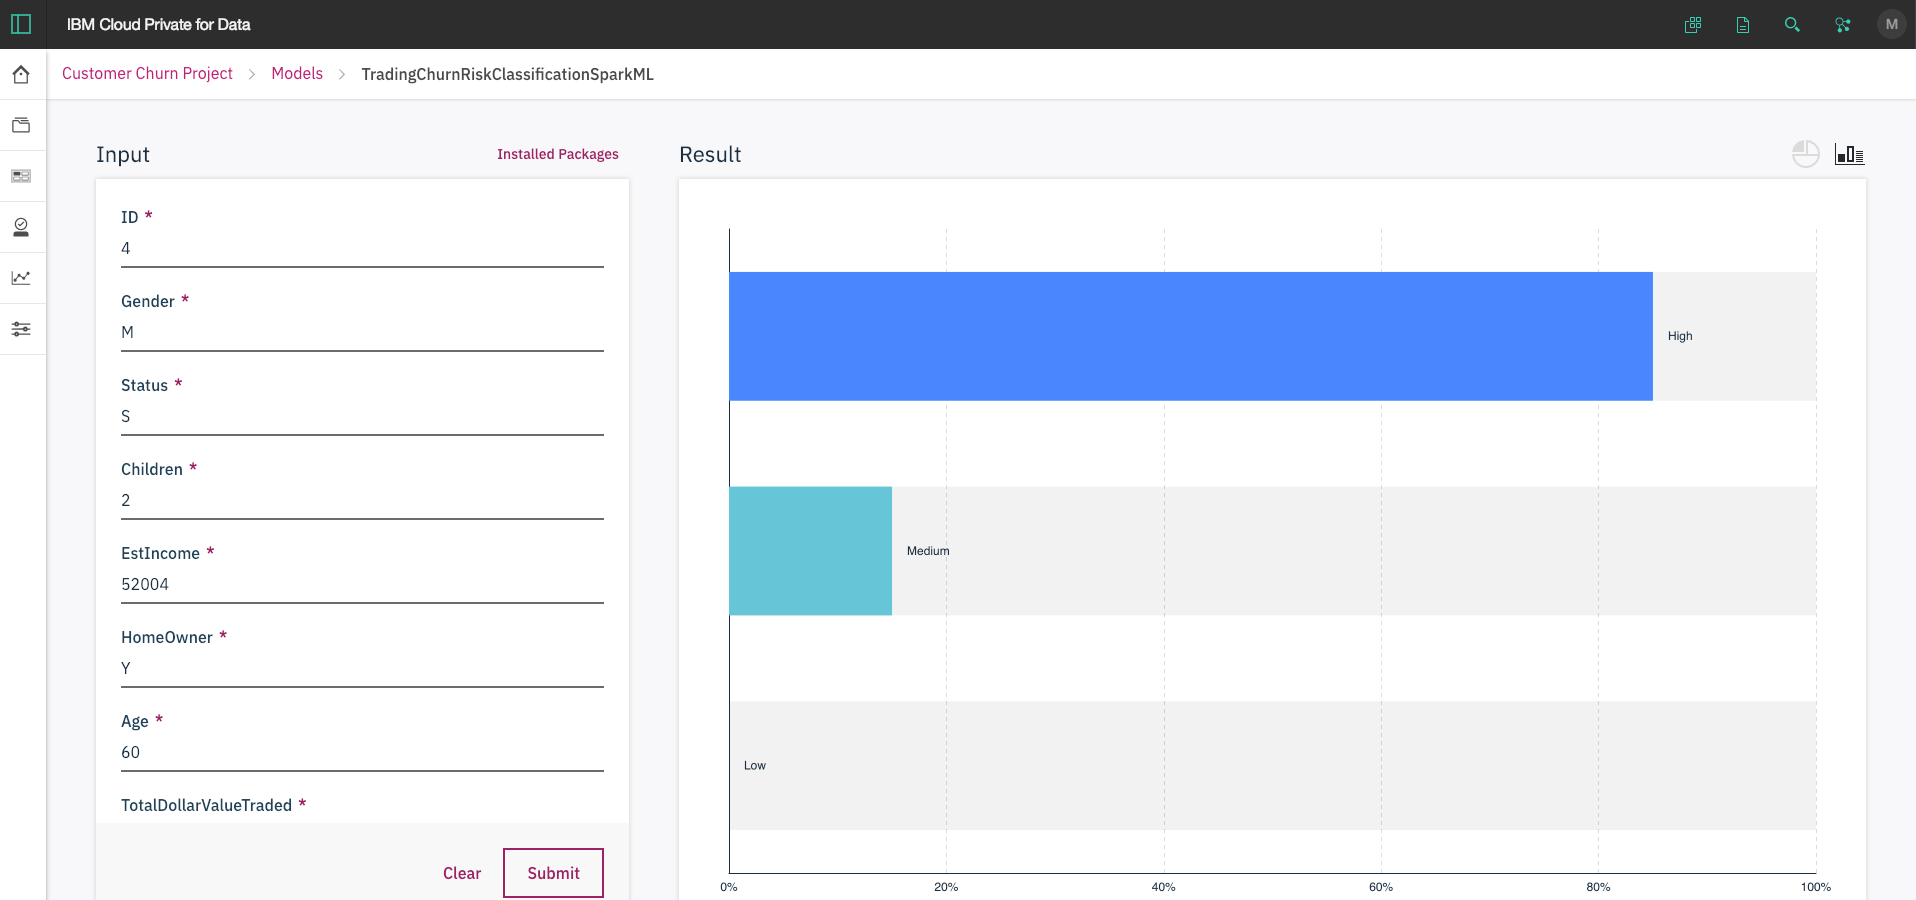


Next, we'll create a project release and tag the model under version control. We'll use model management and deployment to make the released model available as a web service (REST API).
-
Go back to the project homepage. You can see a "Changes made" message. Click on
commit and push.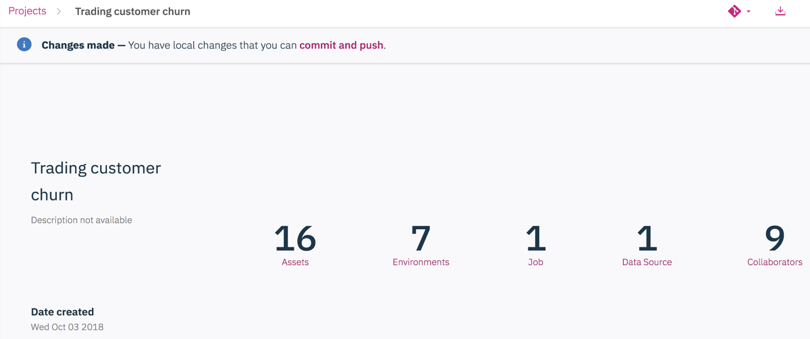
-
You will see there is a list of the assets that are created in this project. Provide a
Commit messageto identify and make note of changes being pushed. Provide a version tag underCreate version tag for release. Please note that the tag and commit message are both very important to identify and deploy the changes.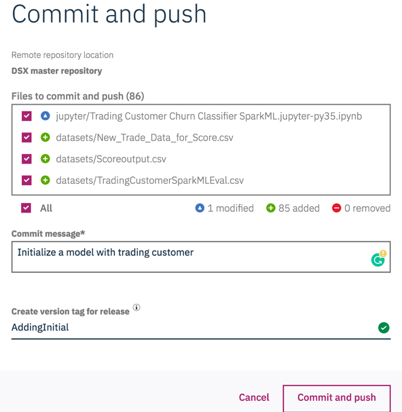
-
Click the
Commit and pushbutton.


Now that we have a committed and tagged version of the project, we can create a project release and deploy it as a web service.
-
Use the left menu's
Analyzedrop-down list and click onModel management & deployment.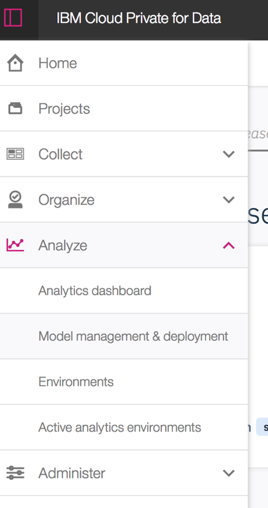
-
Click on
Project releaseto create the deployment. -
Give it a name that you can easily track.
Routewill be a part of the url. It should be lowercase. Choose the target source project and tag that you created above. Click theCreatebutton.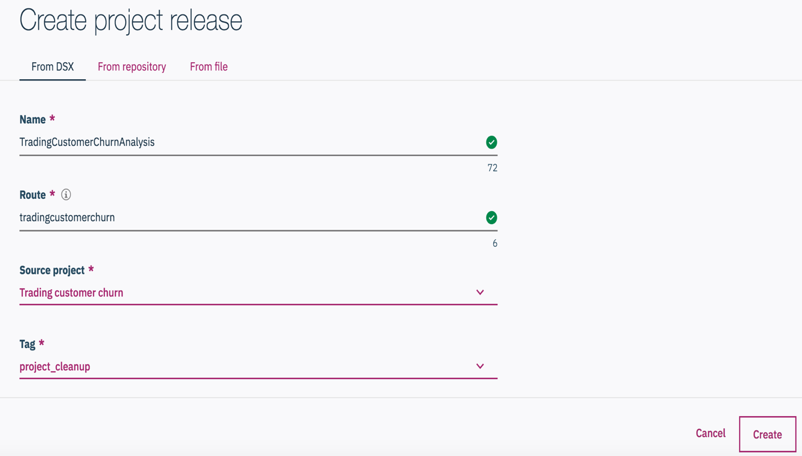


This project release is created.
-
Under the
Assetstab, select the model you just created and then click the upper-right+ web servicebutton. This will add an online deployment service for this model.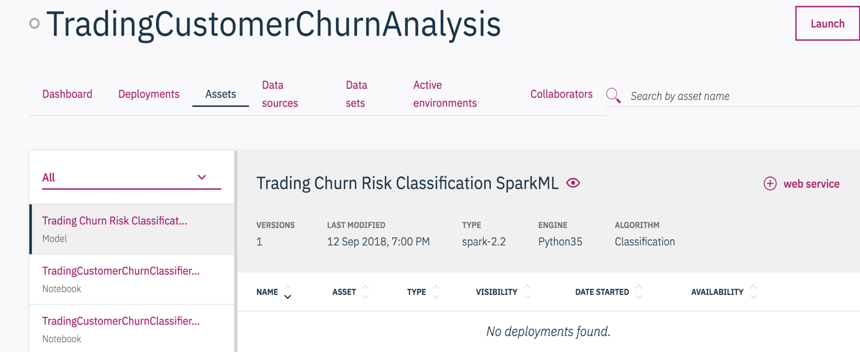
-
Choose whether you want to reserve resources and how many replicas you want for this job.
-
Click the
Createbutton.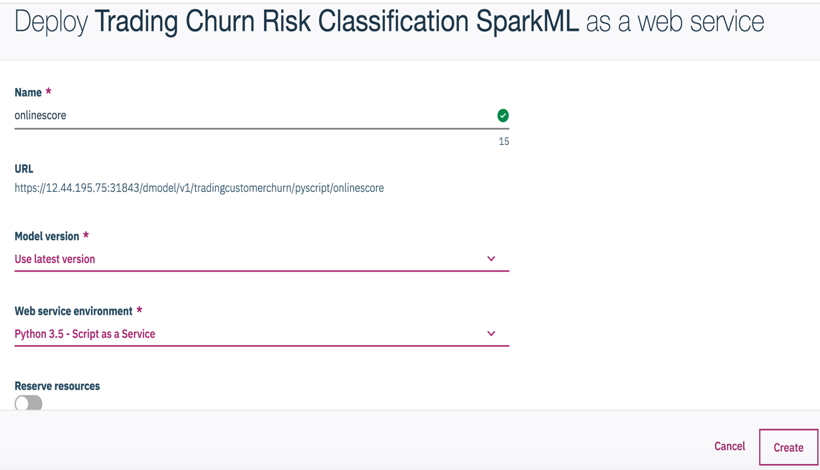
Note: At this time, the online deployment is created. You can also find the REST API URL and deployment token under the
Overviewtab.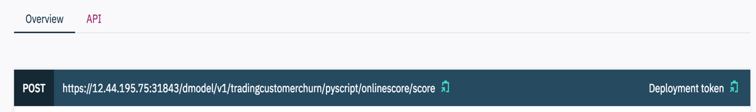


The deployment is still not active. We need to launch and enable it before it can be used.
-
Under the
Deploymentstab, there are jobs that we just created. You will find that they are currently disabled. -
Click
Launchon the top right to activate those deployments. This may take few seconds. -
The onlinescore job is still disabled because there are extra steps to enable it. Click on the action menu (vertical 3 dots) and select
Enable. This may take a little longer. Wait untilAVAILABILITYshowsEnabled.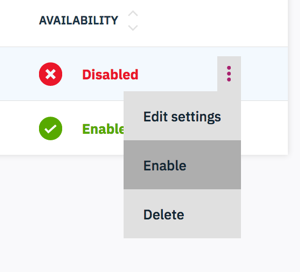
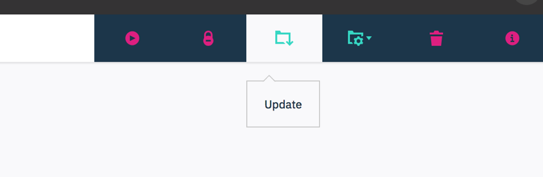
Note: For any additional changes made to the project, just update the MMD environment with the new tag, and the new version of assets are ready to be deployed.


Test the model in the API interface.
-
Click the enabled deployment. Under the
APItab, we can test the model. -
There may be some inputs with
INSERT_VALUE. Simply change them into values that makes sense.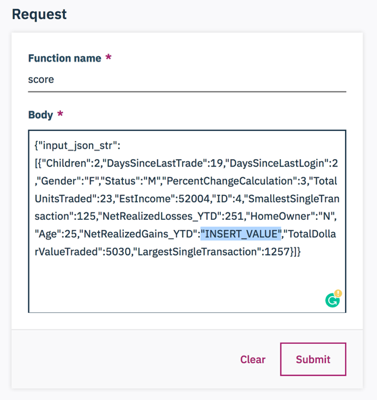
-
Click
Submit. The result is shown on right with inputs and prediction results. -
You can click the
Generate Codebutton to get the code for deployment testing using curl. -
Under
Overview, you can copy the POST API and deployment token. Save it for using the model in an app.

Using curl on the command line is a good way to test the REST APIs before integrating them with more complicated code. To access the model, use the generated code obtained during deployment testing in the UI.
For example, in a terminal run a curl command like the following:
curl -k -X POST \
  https://9.10.111.122:31843/dmodel/v1/churn1/pyscript/churn/score \
  -H 'Authorization: Bearer yeJhbGaaaiJSUzI1NiIsInR5cCI6IkpXVCJ9.eyAAA2VybmFtZSI6InN0dXJkZXZhbnQiLCJwYWNrYWdlTmFtZSI6InJlbGVhc2UxIIIicGFja2FnZVJvdXRlIjoiY2h1cm4xIiwiaWF0IjoxNTQ5Njg0NTg0fQ.BBBBXw48b0MN-TslNNN8e8ZASEW1xWPSen8-1o696i54U4v75wJjiQmGMs-xMe44444yq62qE8zNvXEsHM8TnnAEfaFPvokEgWtKpduWSQo1SAKch-bQhfhMJUK2wetYsUpOw5Gffuamd_jkqqQlqi4asbL_DSGBbHhNx-nnnnnsnMKm7giBa8IgtFrf6JITVIwS2xbob2t1xE_ztG0p43KK1UrddPBpztqifQybH_zbdEPOoF6Xf-ZRBcDkRMHbhC-FFF7saWLkX3AYmCboLzatB0_ufLOy2S2TosSie_UPKOS0aLcXjJDMbgsGqy9C_AsK5n28HysmH2NeXzEN9A' \
  -H 'Cache-Control: no-cache' \
  -H 'Content-Type: application/json' \
-d '{"args":{"input_json":[{"ID":4,"GENDER":"F","STATUS":"M","CHILDREN":2,"ESTINCOME":52004,"HOMEOWNER":"N","AGE":25,"TOTALDOLLARVALUETRADED":5030,"TOTALUNITSTRADED":23,"LARGESTSINGLETRANSACTION":1257,"SMALLESTSINGLETRANSACTION":125,"PERCENTCHANGECALCULATION":3,"DAYSSINCELASTLOGIN":2,"DAYSSINCELASTTRADE":19,"NETREALIZEDGAINS_YTD":0,"NETREALIZEDLOSSES_YTD":251}]}}'The Dashboard shows all of the deployment results. This includes the performance of each evaluation. The thresholds you defined for evaluation will indicate how the deployed model is performing in real-time. “Green” indicates good performance, “amber” indicates mediocre and “red” indicates a poorly performing model. For underperforming models, you can go back to the notebook, make changes until the model performs well, and then reploy the updated model. That’s how the dashboard helps with the machine learning model life cycle management.

You can also access the web service directly through the REST API. This allows you to use your model for inference in any of your apps.
The general recommendation for Python development is to use a virtual environment (venv). To install and initialize a virtual environment, use the venv module on Python 3 (you install the virtualenv library for Python 2.7):
-
In a terminal go to the cloned repo directory.
cd icp4d-customer-churn-classifier -
Initialize a virtual environment.
# Create the virtual environment using Python. Use one of the two commands depending on your Python version.
# Note, it may be named python3 on your system.

python -m venv venv       # Python 3.X
virtualenv venv           # Python 2.X

# Source the virtual environment. Use one of the two commands depending on your OS.

source venv/bin/activate  # Mac or Linux
./venv/Scripts/activate   # Windows PowerShell
TIP 💡 To terminate the virtual environment use the
deactivatecommand. -
Install the Python requirements.
cd stocktraderapp pip install -r requirements.txt -
Copy the env.sample to .env.
cp env.sample .env
-
Edit the .env file to provide the
URLandTOKEN.URLis your web service URL for scoring.TOKENis your deployment access token.
# Copy this file to .env.
# Edit the .env file with the required settings before starting the app.

# Required: Provide your web service URL for scoring.
# E.g., URL=https://9.10.222.3:31843/dmodel/v1/project/pyscript/tag/score

URL=

# Required: Provide your web service deployment access token.
#           This TOKEN should start with "Bearer ".
# E.g., TOKEN=Bearer abCdwFghIjKLMnO1PqRsTuV2wWX3YzaBCDE4.fgH1r2... (and so on, tokens are long).

TOKEN=

# Optional: You can override the server's host and port here.

HOST=0.0.0.0
PORT=5000
-
Start the flask server.
python StockTraderChurn.py
-
Use your browser to go to http://0.0.0.0:5000 and try it out.
-
Use
CTRL-Cto stop the flask server when you are done.
See the notebook with example output here.
This code pattern is licensed under the Apache License, Version 2. Separate third-party code objects invoked within this code pattern are licensed by their respective providers pursuant to their own separate licenses. Contributions are subject to the Developer Certificate of Origin, Version 1.1 and the Apache License, Version 2.