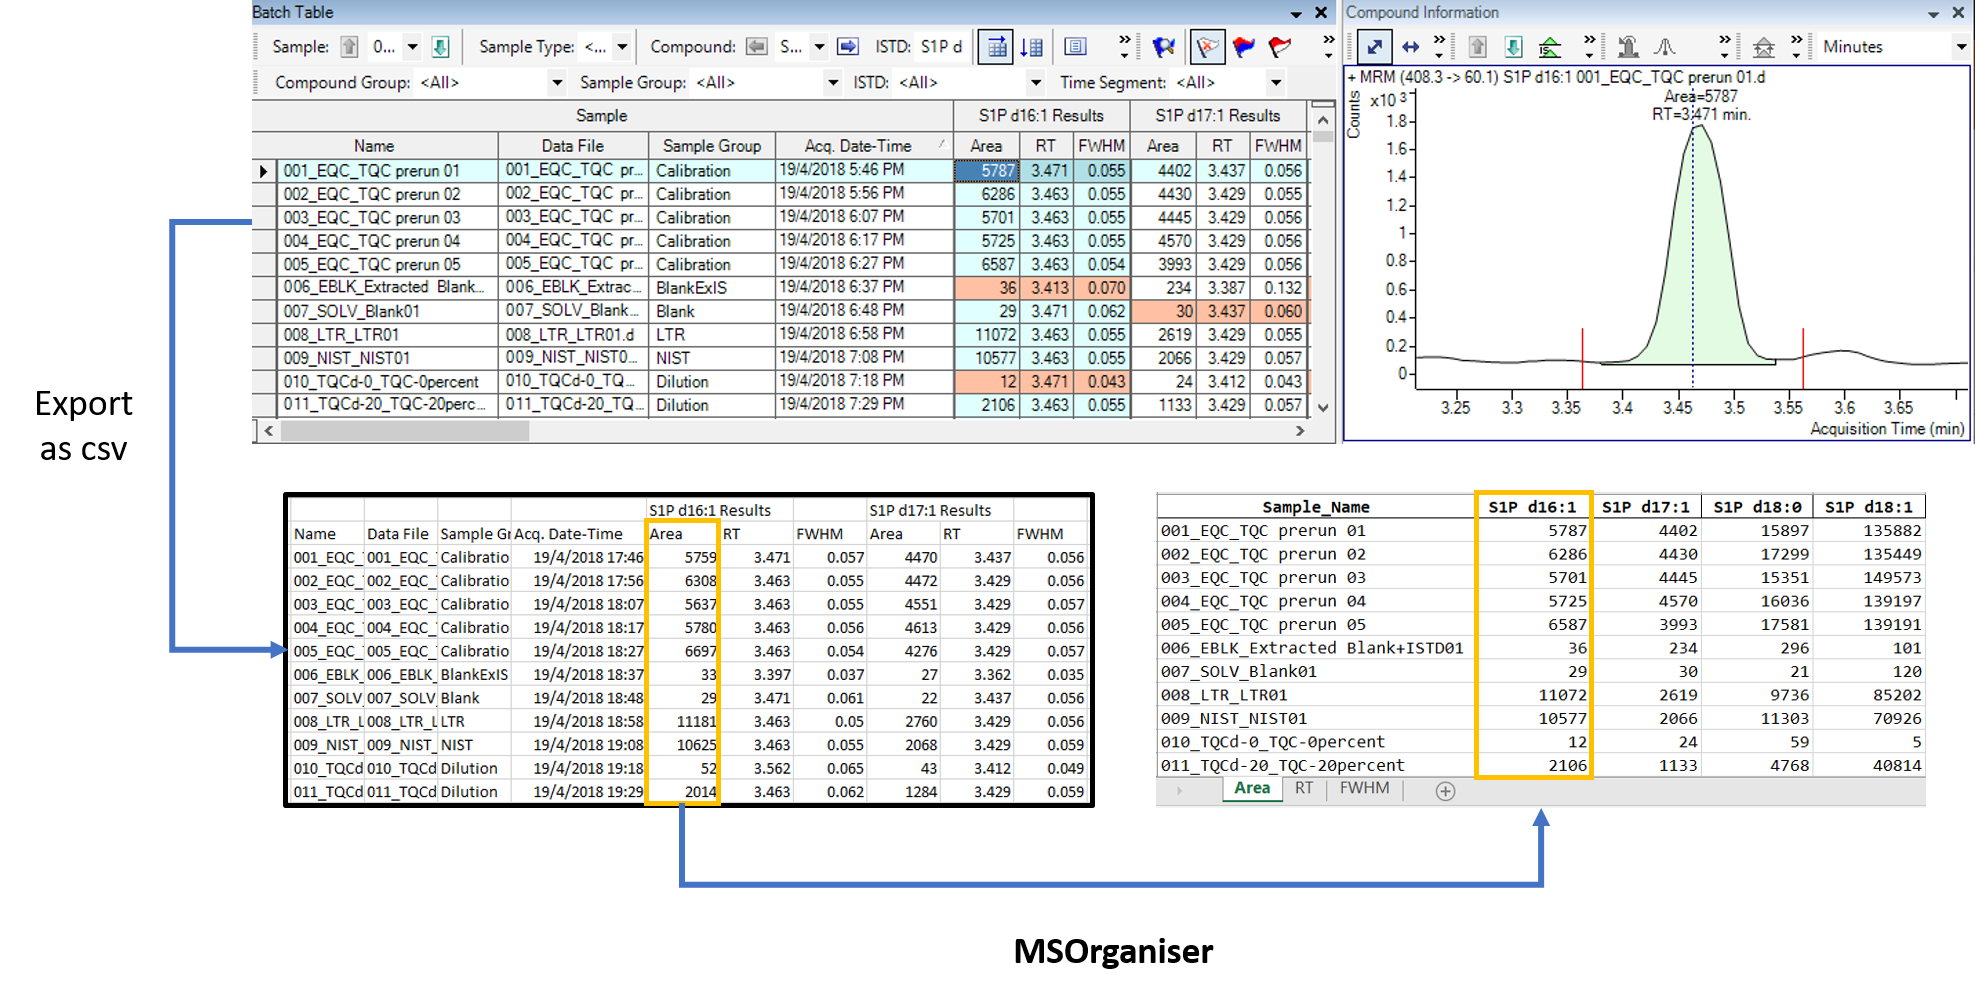
MSOrganiser is created to provide users a convenient way to extract
and organise MRM transition names data exported from mass spectrometry
software into an Excel or csv file in a few button clicks.
With the addition of the
MSTemplate_Creator,
the software is also able to normalize the peak area with respect to the
internal standard’s peak area and calculate the concentration of the
analytes.
- MSOrganiser
- Table of Content
- Meta
- Overview
- Starting Up
- Extracting Area And RT
- Calculating Normalised Area And Concentration
- Output Format
- Transpose Output
- Long Table Output
- Concatenation Option
- Allow Normalisation With Multiple ISTD
- Testing Mode
- We welcome contributions including bug reports. Please note that this project is released with a Contributor Code of Conduct. By participating in this project you agree to abide by its terms.
- License: MIT
- Think
MSOrganiseris useful? Let others discover it, by telling them in person, via Twitteror a blog post. Do use the
🙌 Show and tellunder the GitHub Discussions and give this repository a star as well.
- If you wish to acknowledge the use of this software in a journal paper, please include the version number. For reproducibility, it is advisable to use the software from the Releases section in GitHub rather than from the main branch.
- To date, the software is only able to take in the following files
exported from the following software.
- csv files from Agilent MassHunter Quantitative Analysis Software
- Refer to the NEWS.md file to see what is being worked on as well as update to changes between back to back versions.
For an overview on how the tool works, take a look at the Summary file in the documentation page. Below is a preview of the Summary file.
Go to the Releases section in GitHub.
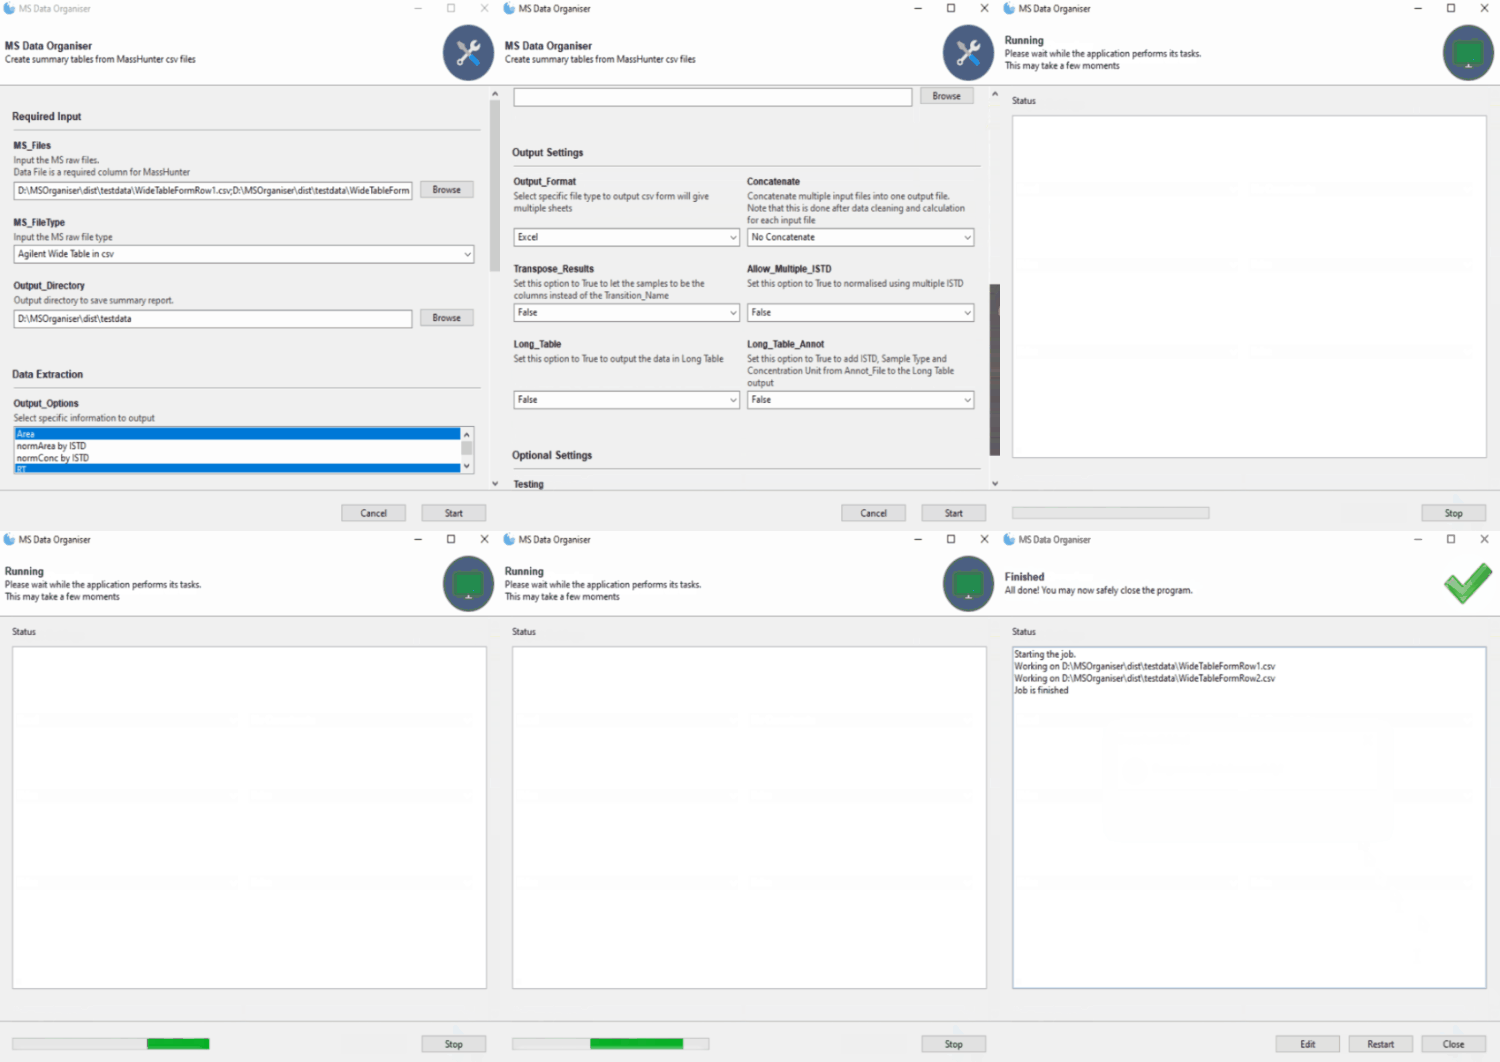
Download the zip folder. Unzip the folder, double click on the file
MSOrganiser.exe to start
The test csv data file is exported via Agilent MassHunter Quantitative Analysis in wide table form.
Fill in the Required Input section such as the MS_Files,
MS_FileType and Output_Directory.
Next, under the Output_Options click on Area and RT
Click on Start and let the program run
Results files are as follows
The normalised area is calculated as follows:
The concentration value is calculated as follows:
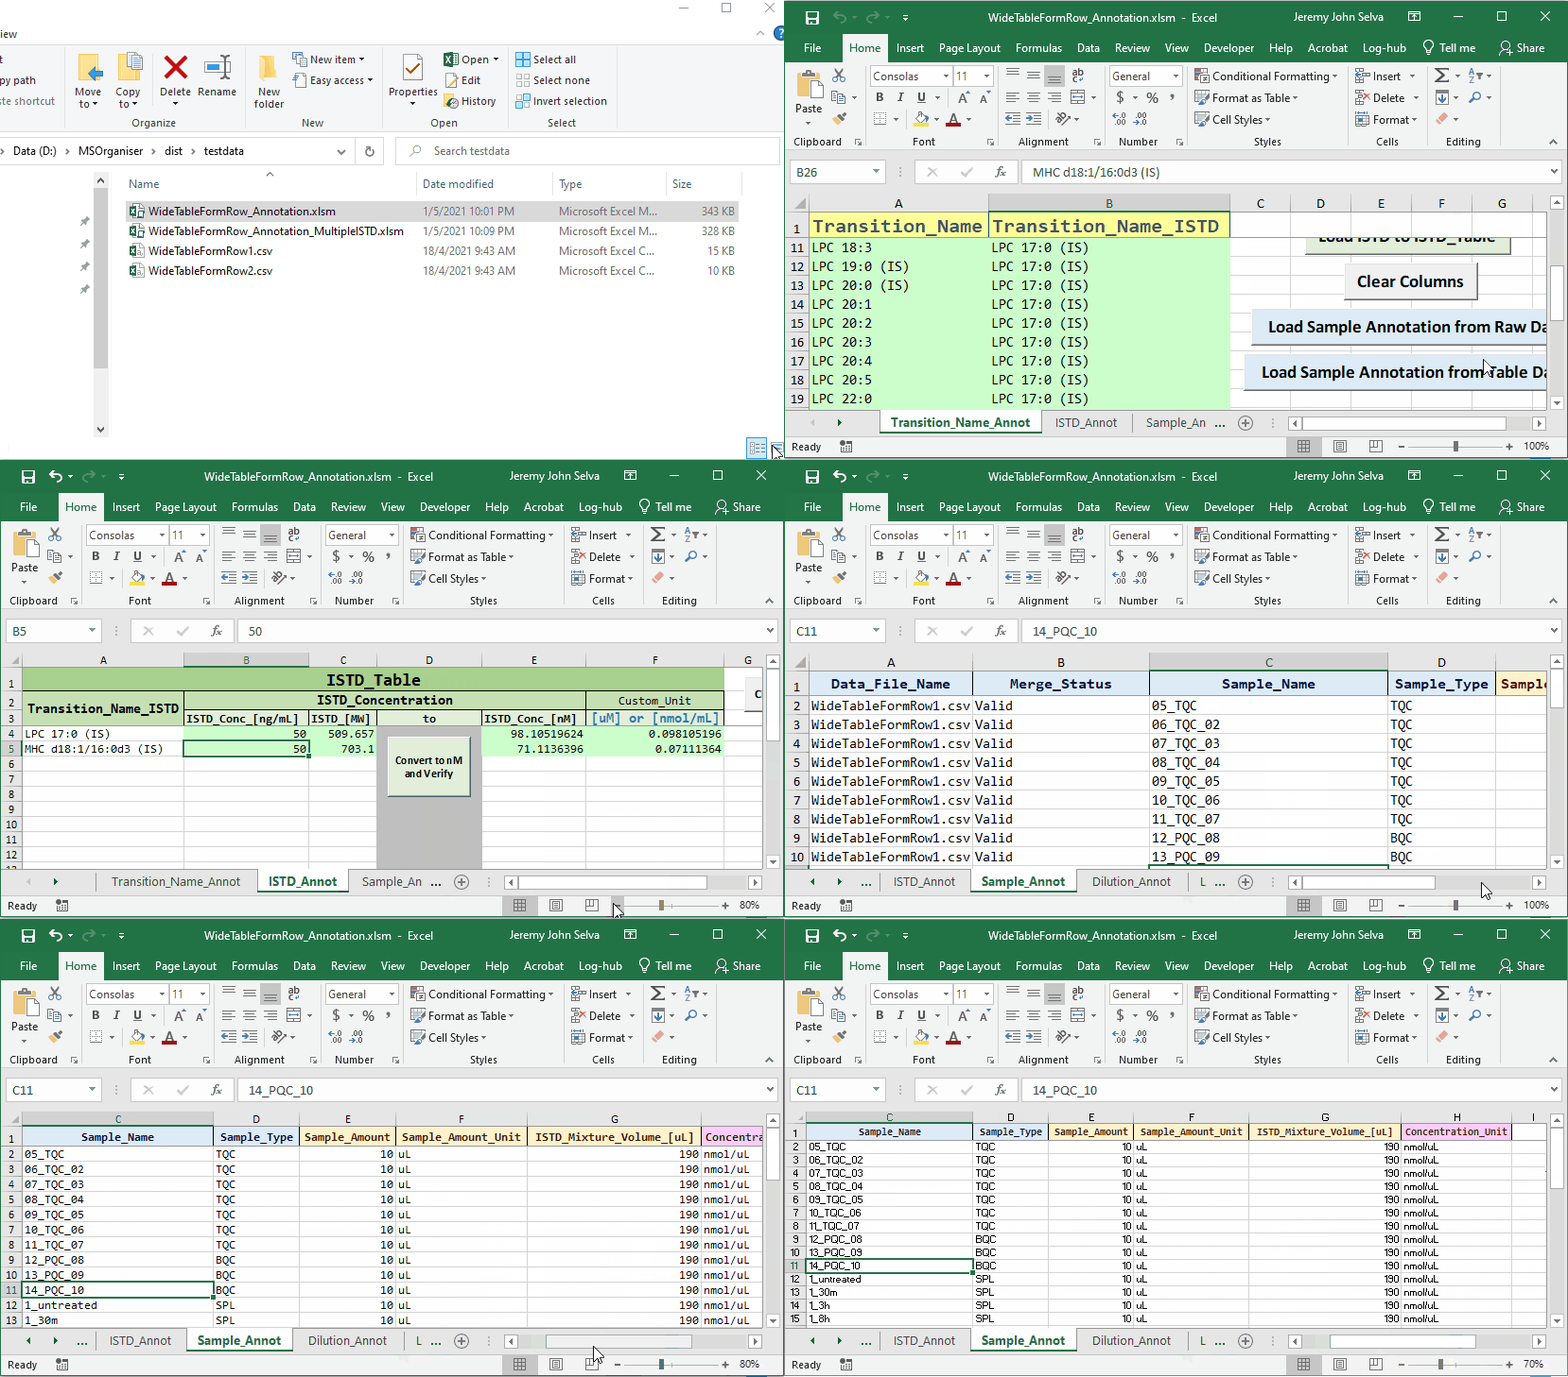
To do this, a corresponding annotation file is required.
The content in the annotation file are as follows:
In the Data_extraction section, click on normArea by ISTD and
normConc by ISTD. Load the annotation file onto Annot_File and press
Start to let the program run.
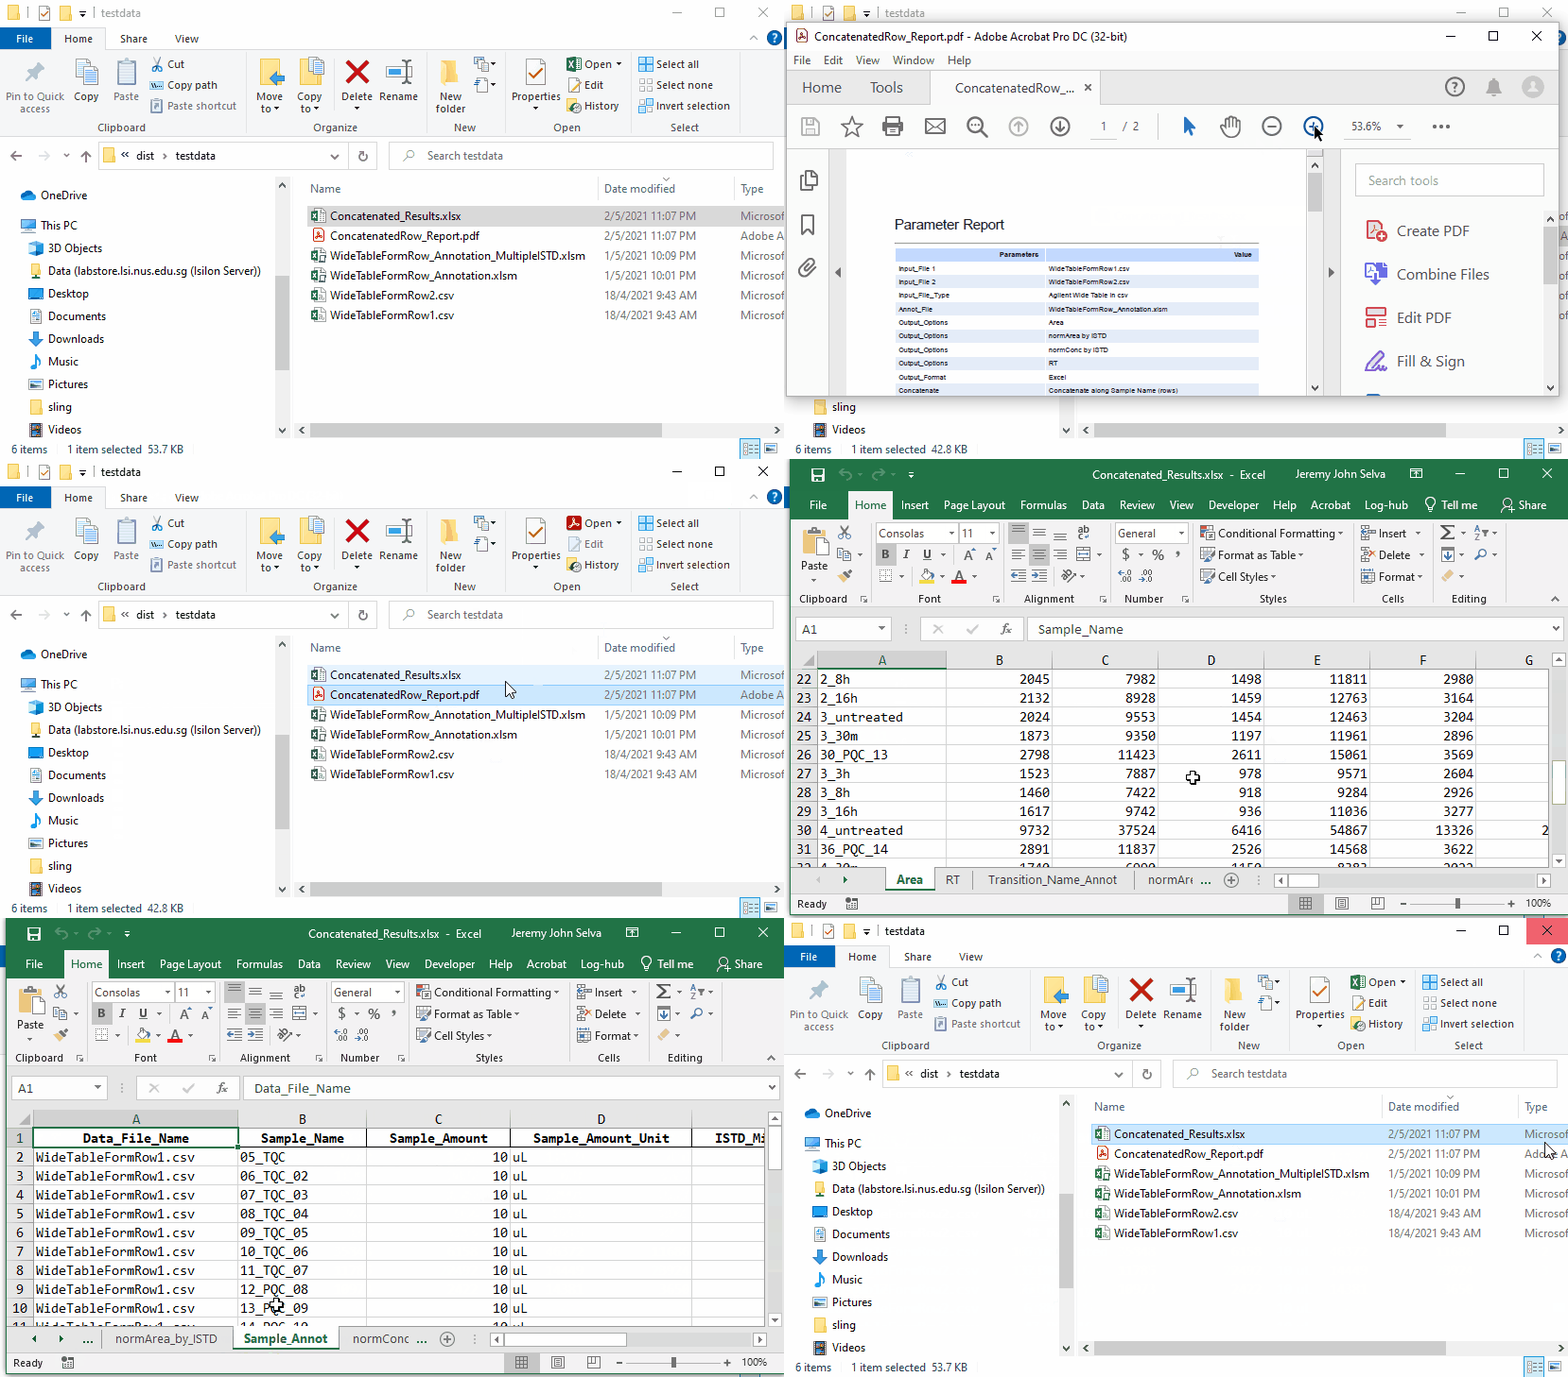
When the program has finished running, the results will contain the following sheets including the normalised area and concentration.
The results are output as an Excel file. User can change the output type to as follows
By default, the results are represented in a wide table form with Sample
Name as the first columns followed by the Transitions. To make the
Transition Name as the first column followed by the Sample Names, go to
the Output Settings section and change the Transpose_Results from
False to True and click Start
The results file will now look like this
There is also an option to output the results in the form of a long table.
When there are several input data file with the same transitions but
different sample names in each file, the results can be concatenated by
setting the Concatenate settings to
Concatenate along Sample Name (rows)
When there are several input data file with the same sample name but
different transitions in each file, the results can be concatenated by
setting the Concatenate settings to
Concatenate along Transition Name (columns)
Concatenated results are as follows
By default, the software will only allow one transition to be normalised
by one ISTD. However, during method development, there may be a need for
one transition to be normalised by multiple ISTD to see which one is the
best one to use. To relax this restriction, ensure that
Allow_Multiple_ISTD is set to True
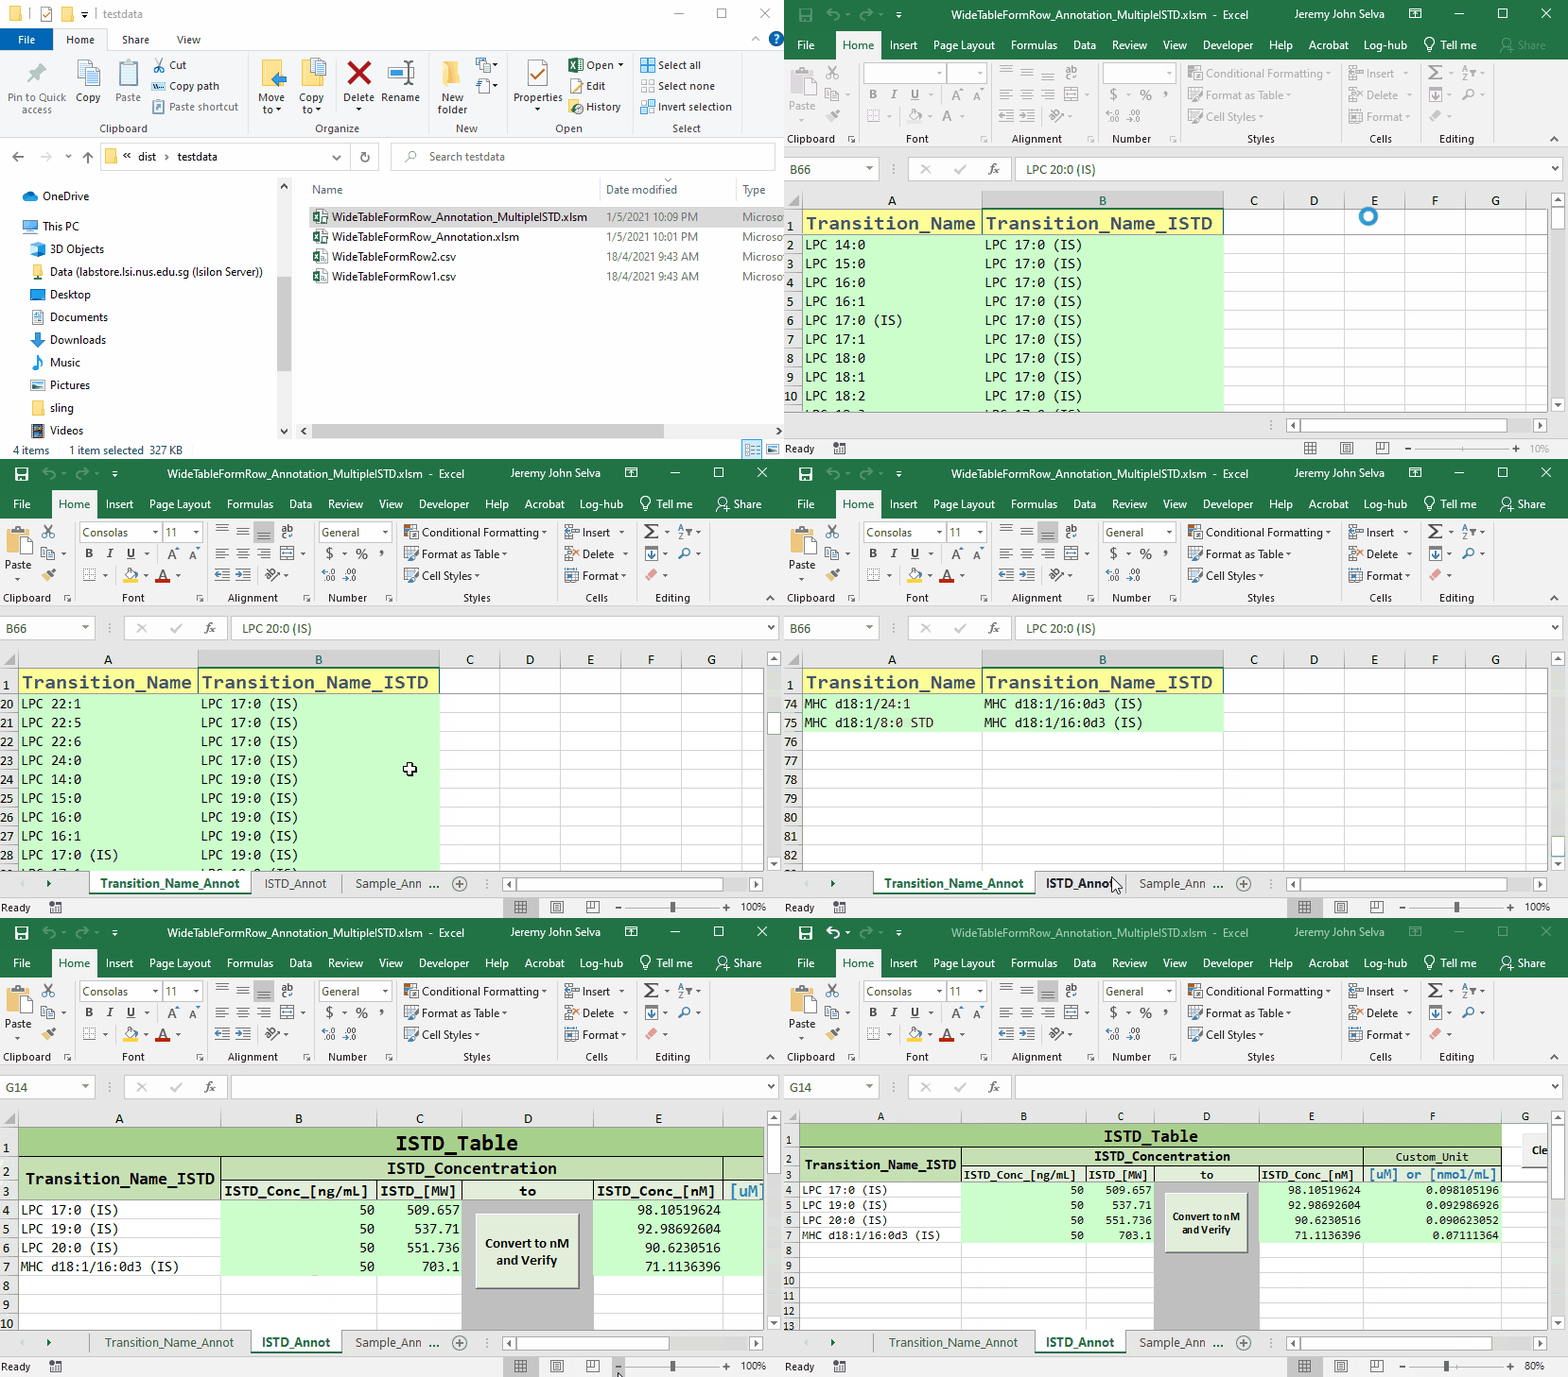
In this example, the following annotation file will be used
Load the annotation file onto Annot_File and press Start
The main changes in the results are as follows
The output can be transposed to make it suited to be read by a statistical software.
Here are the transposed output
MSOrganiser by default turns positive and negative infinity to missing
values. However, it is challenging to trace back the reason behind a
missing value in the concentration because of many possibilities.
Below are a list of possible reasons.
- The peak area of the transition is a missing value.
- The peak area of the internal standard is a missing value or zero.
- The sample amount of the sample is a missing value or zero.
- The volume of the internal standard mixture is a missing value.
- The concentration of the internal standard is a missing value.
It is harder when there is a need to explain how the concentration values are calculated to a collaborator who is unfamiliar with your work. More so when explaining the reason behind the missing values.
The testing mode when activated will provide additional sheets in Excel
or csv files such as ISTD_Area, ISTD_Conc and
ISTD_to_Samp_Amt_Ratio to assist in the explanation.
It is easier to explain how the values in ISTD_Area, ISTD_Conc and
ISTD_to_Samp_Amt_Ratio are created. With these additional info, we can
simply tell others that the concentration values is calculated as
follows:
-
normArea by ISTD= (Area/ISTD_Area) -
normConc by ISTD= (Area/ISTD_Area) *ISTD_to_Samp_Amt_Ratio*ISTD_Conc


