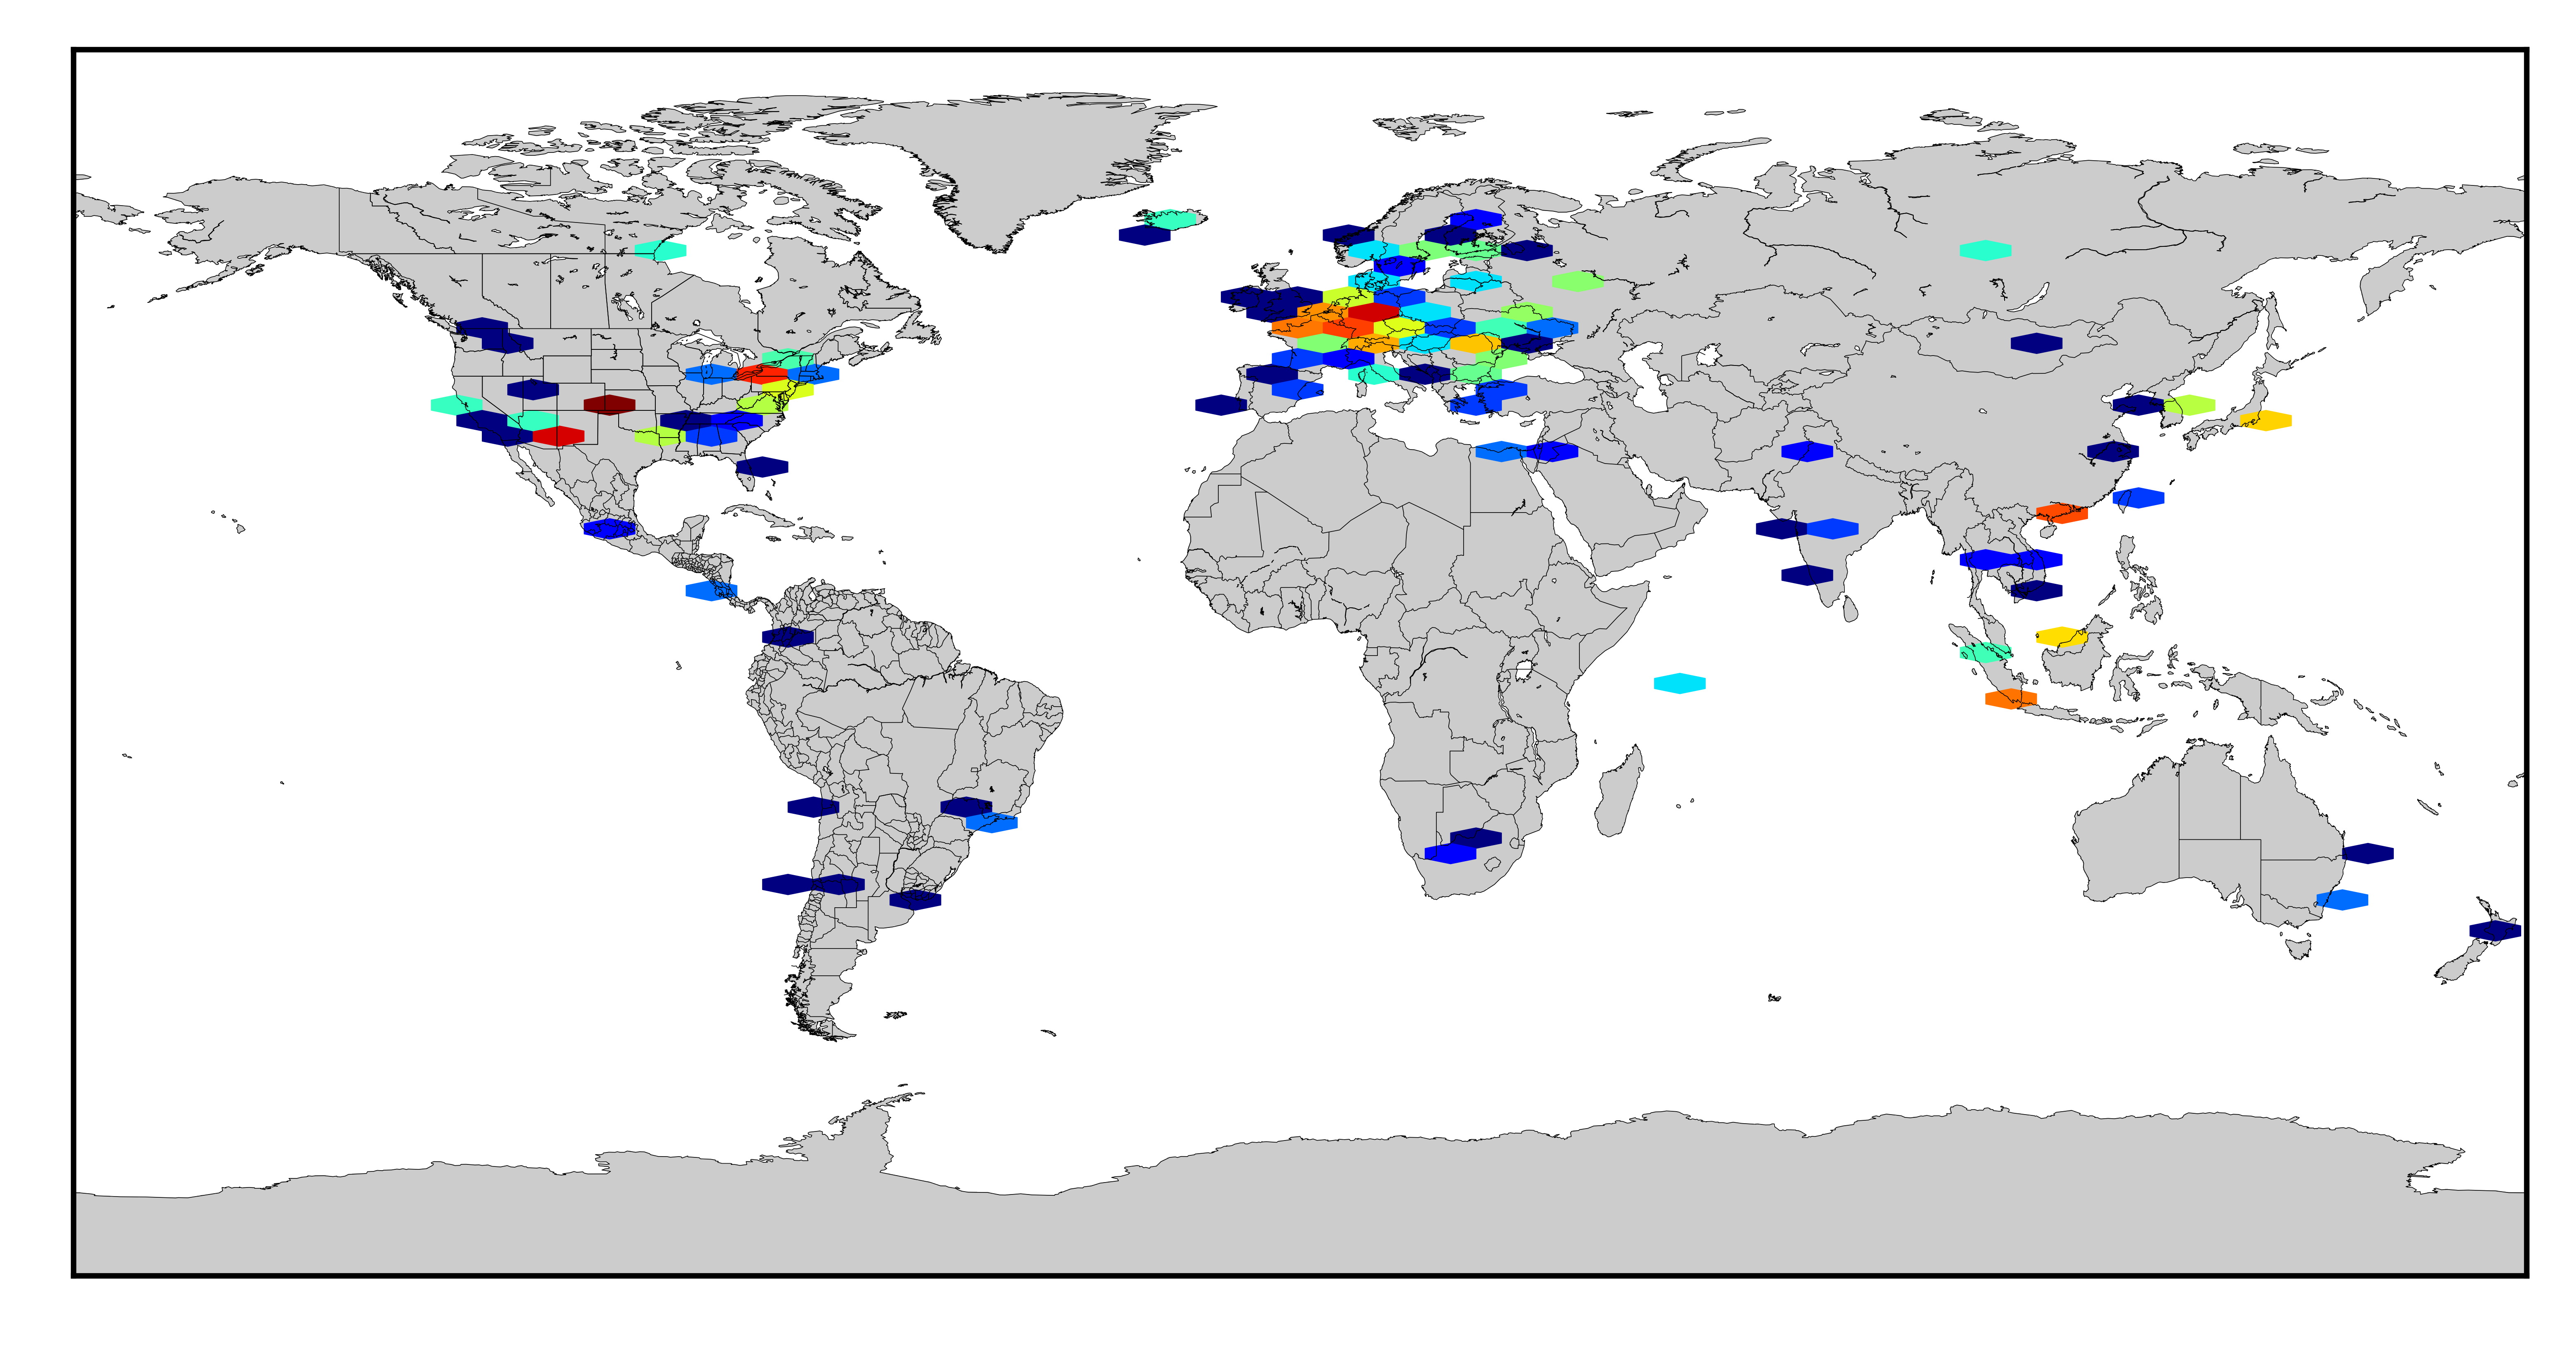
GeoIP plotting script written in Python to help security teams draw visualized reports from IP addresses. This script is based on already existing excellent PyGeoIPMap project with some additions towards extended plotting capabilities in offline mode using MaxMind GeoIP database.
This script currently supports the following plot types:
Install the following prerequsites:
- Python3
- numpy
- matplotlib
- Basemap
The following command line should take care of prerequisites on Debian/Ubuntu:
# primary method
apt-get install libgeos-dev python3-dev && pip3 install -r requirements.txt
# secondary method
apt-get install python3-numpy python3-matplotlib libgeos-dev python3-geoip2 python3-mpltoolkits.basemap python3 python3-dev
usage: geoipplotter.py [-h] [-i INPUT] [-o OUTPUT] [-db DB] [-e EXTENTS]
                       [-t TYPE] [-d DESTINATION]

Visualize IP addresses on the map

optional arguments:
  -h, --help            show this help message and exit
  -i INPUT, --input INPUT
                        Input file. One IP per line
  -o OUTPUT, --output OUTPUT
                        Path to save the file (e.g. /tmp/output.png)
  -db DB, --db DB       Full path to MaxMind GeoLite2-City.mmdb database file
                        (download from
                        https://dev.maxmind.com/geoip/geoip2/geolite2/)
  -e EXTENTS, --extents EXTENTS
                        Extents for the plot (west/east/south/north). Default
                        to globe.
  -t TYPE, --type TYPE  Plot type scatter, bubble, connectionmap, heatmap,hexbin
  -d DESTINATION, --destination DESTINATION
                        When connectionmap line plot is used, add latitude and
                        longitude as destination (i.e. -d 51.50/0.12)
To zoom towards specific continent use -e parameter with approximate location flags:
- Europe -
-12/45/30/65 - Middle East -
10/80/-10/60 - Africa + Middle East -
-20/90/-60/40 - Africa -
-20/55/-60/40 - South America -
-100/-30/-60/40 - North America -
-200/-40/1/90 - Americas (North + South) -
-200/-20/-60/90
If argument parsing throws an error around input, it might not like extra - use double quotes to pass appropriate parameter i.e. -e " -100/-30/-60/40"
To generate scatter plot:
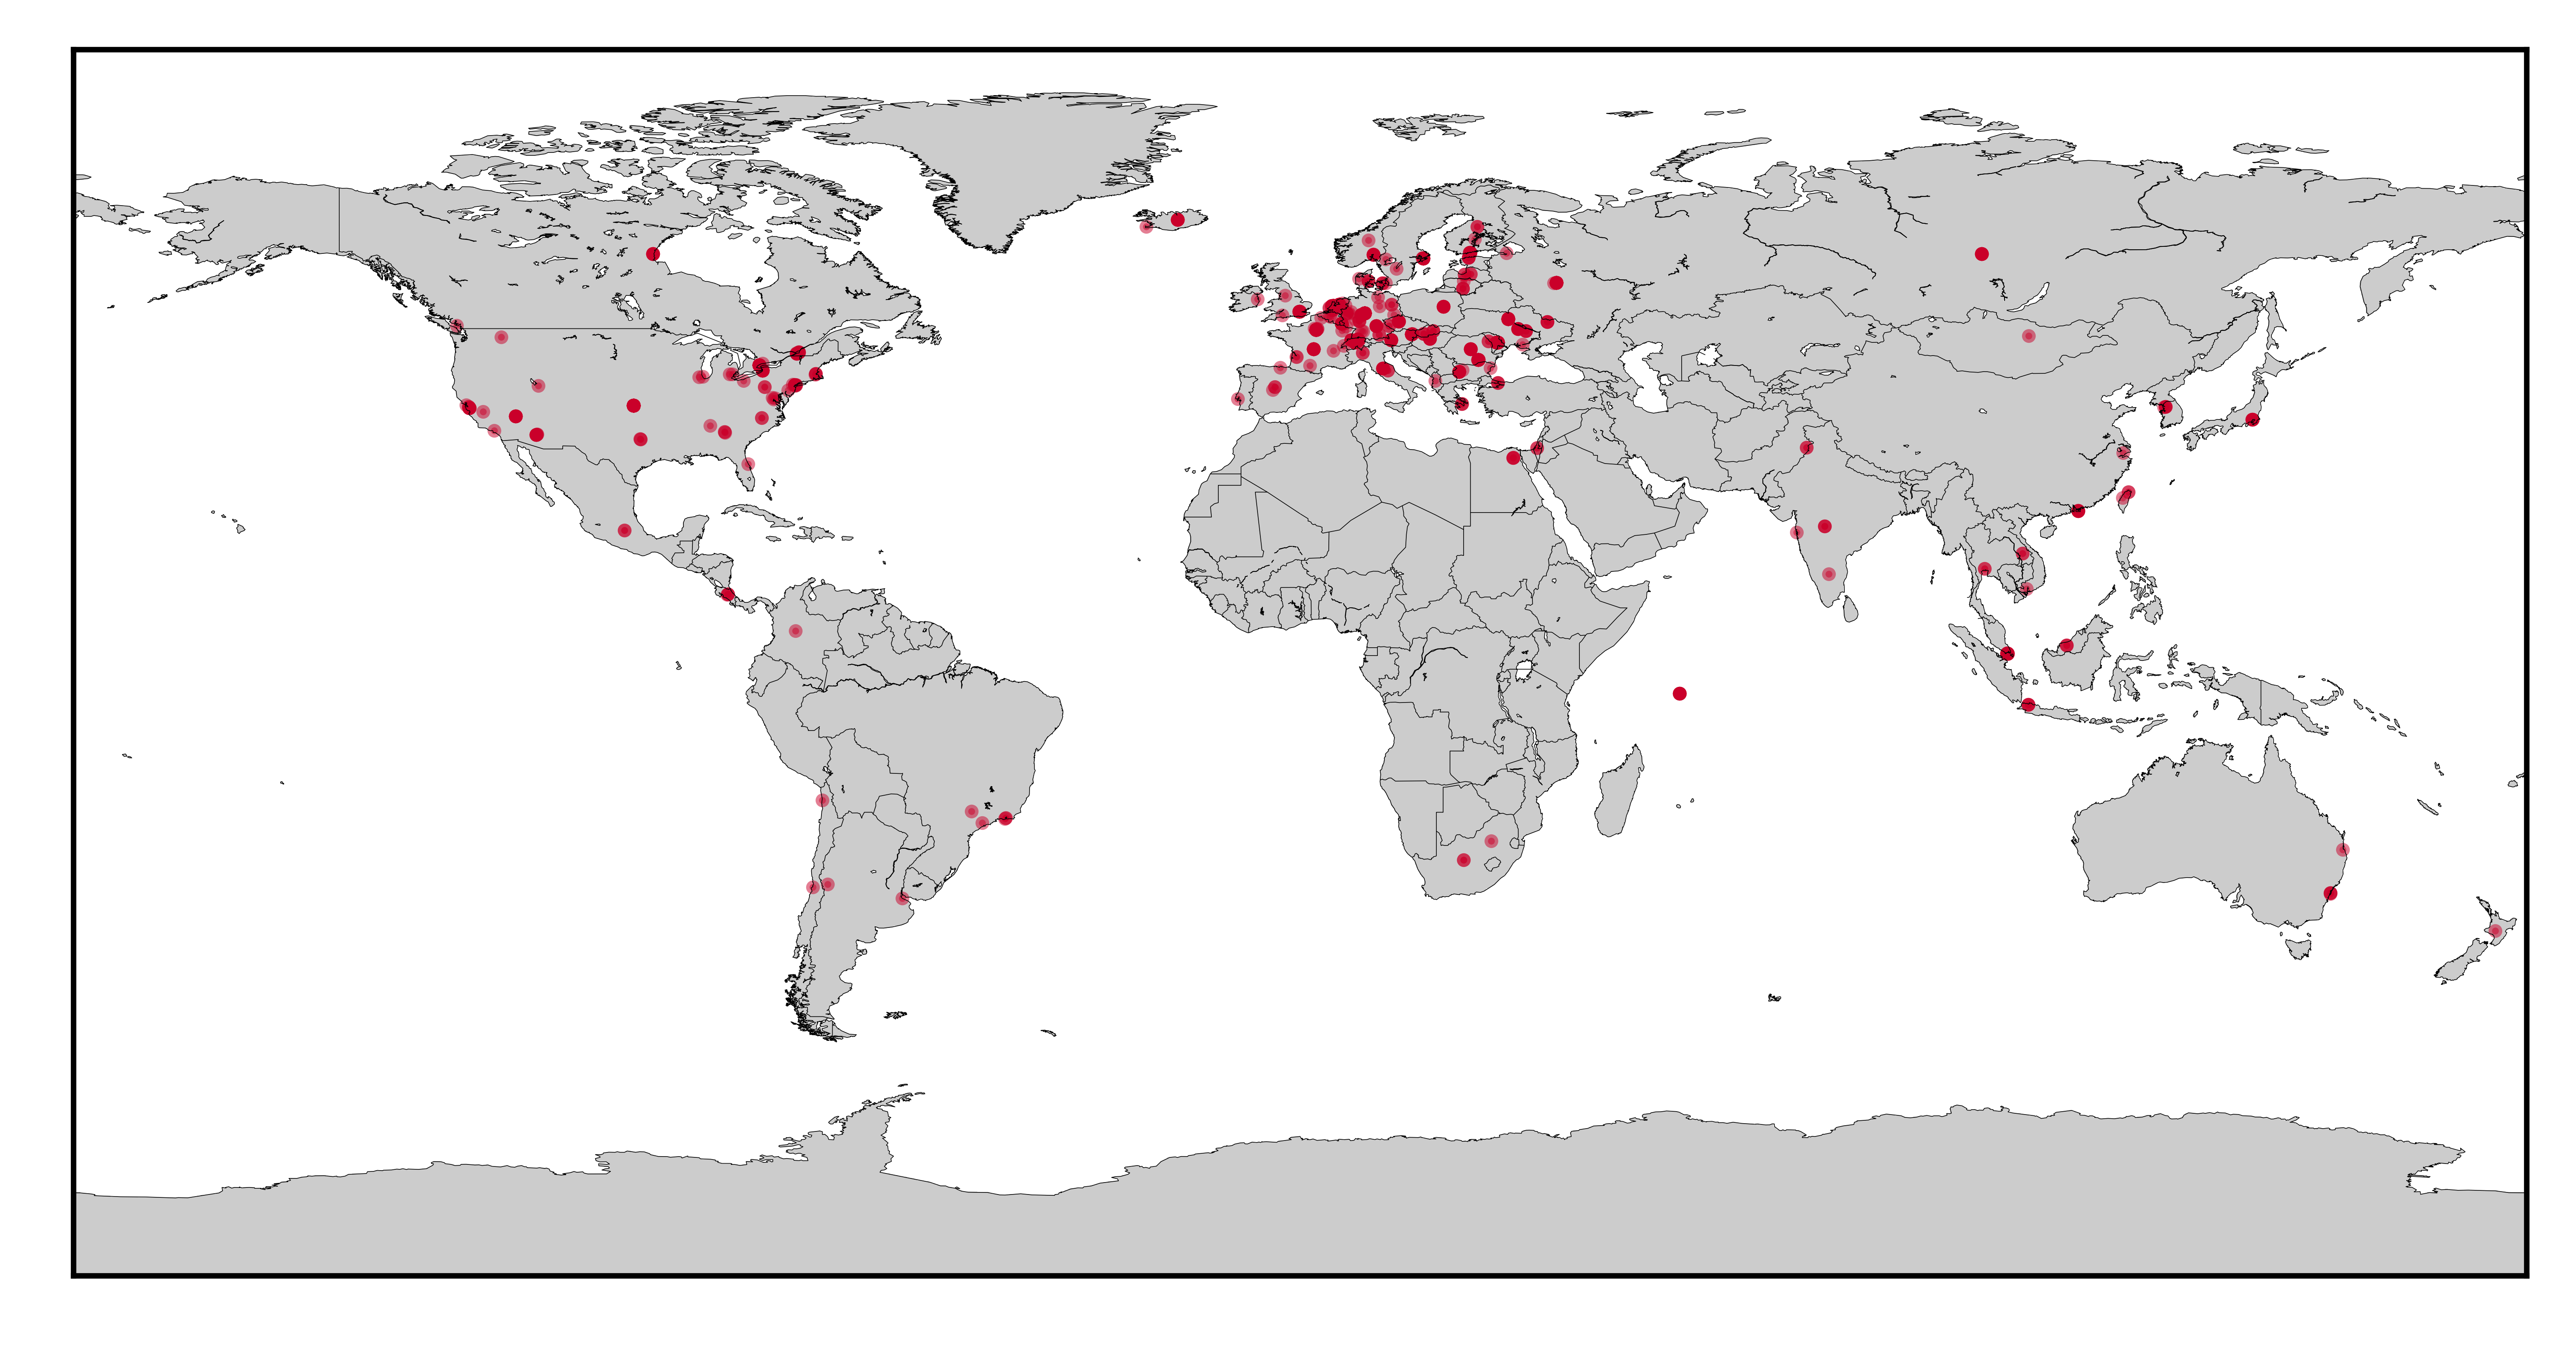
python3 geoipplotter.py -t scatter --db /tmp/GeoLite2-City.mmdb -i sourceip.txt -o scatter.pngTo generate bubble plot:
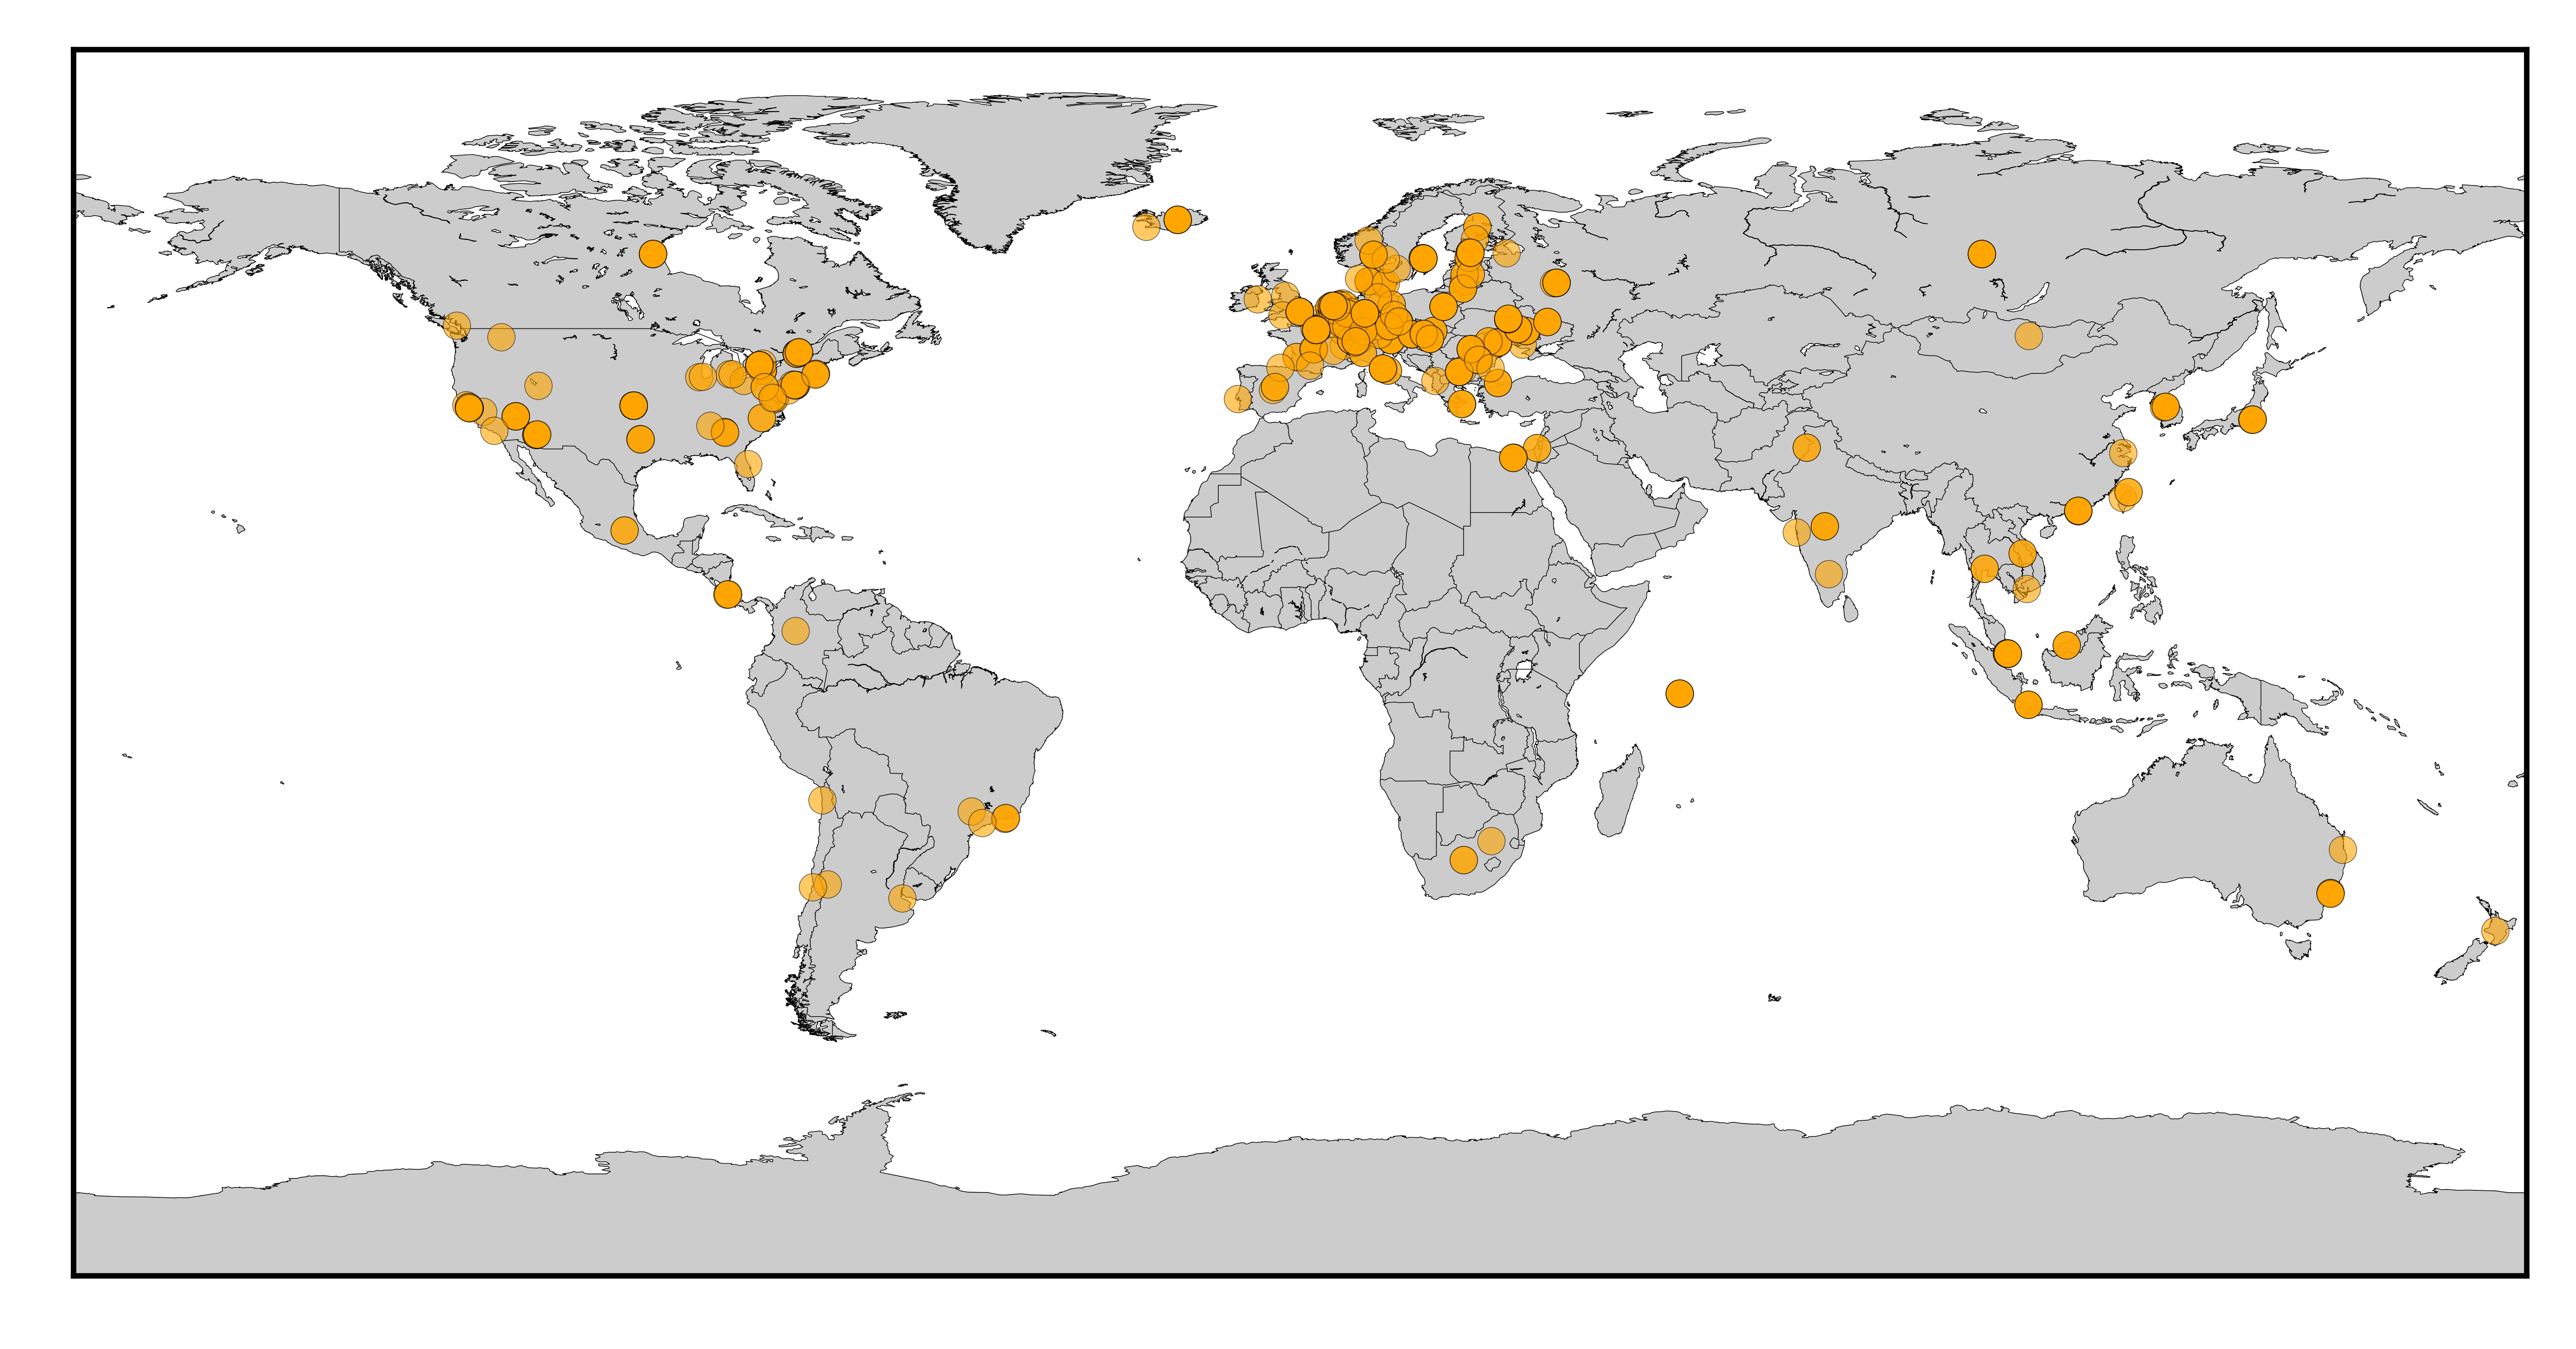
python3 geoipplotter.py -t bubble --db /tmp/GeoLite2-City.mmdb -i sourceip.txt -o bubble.pngTo generate connectionmap against specific LON/LAT (useful for showing that we are under attack):
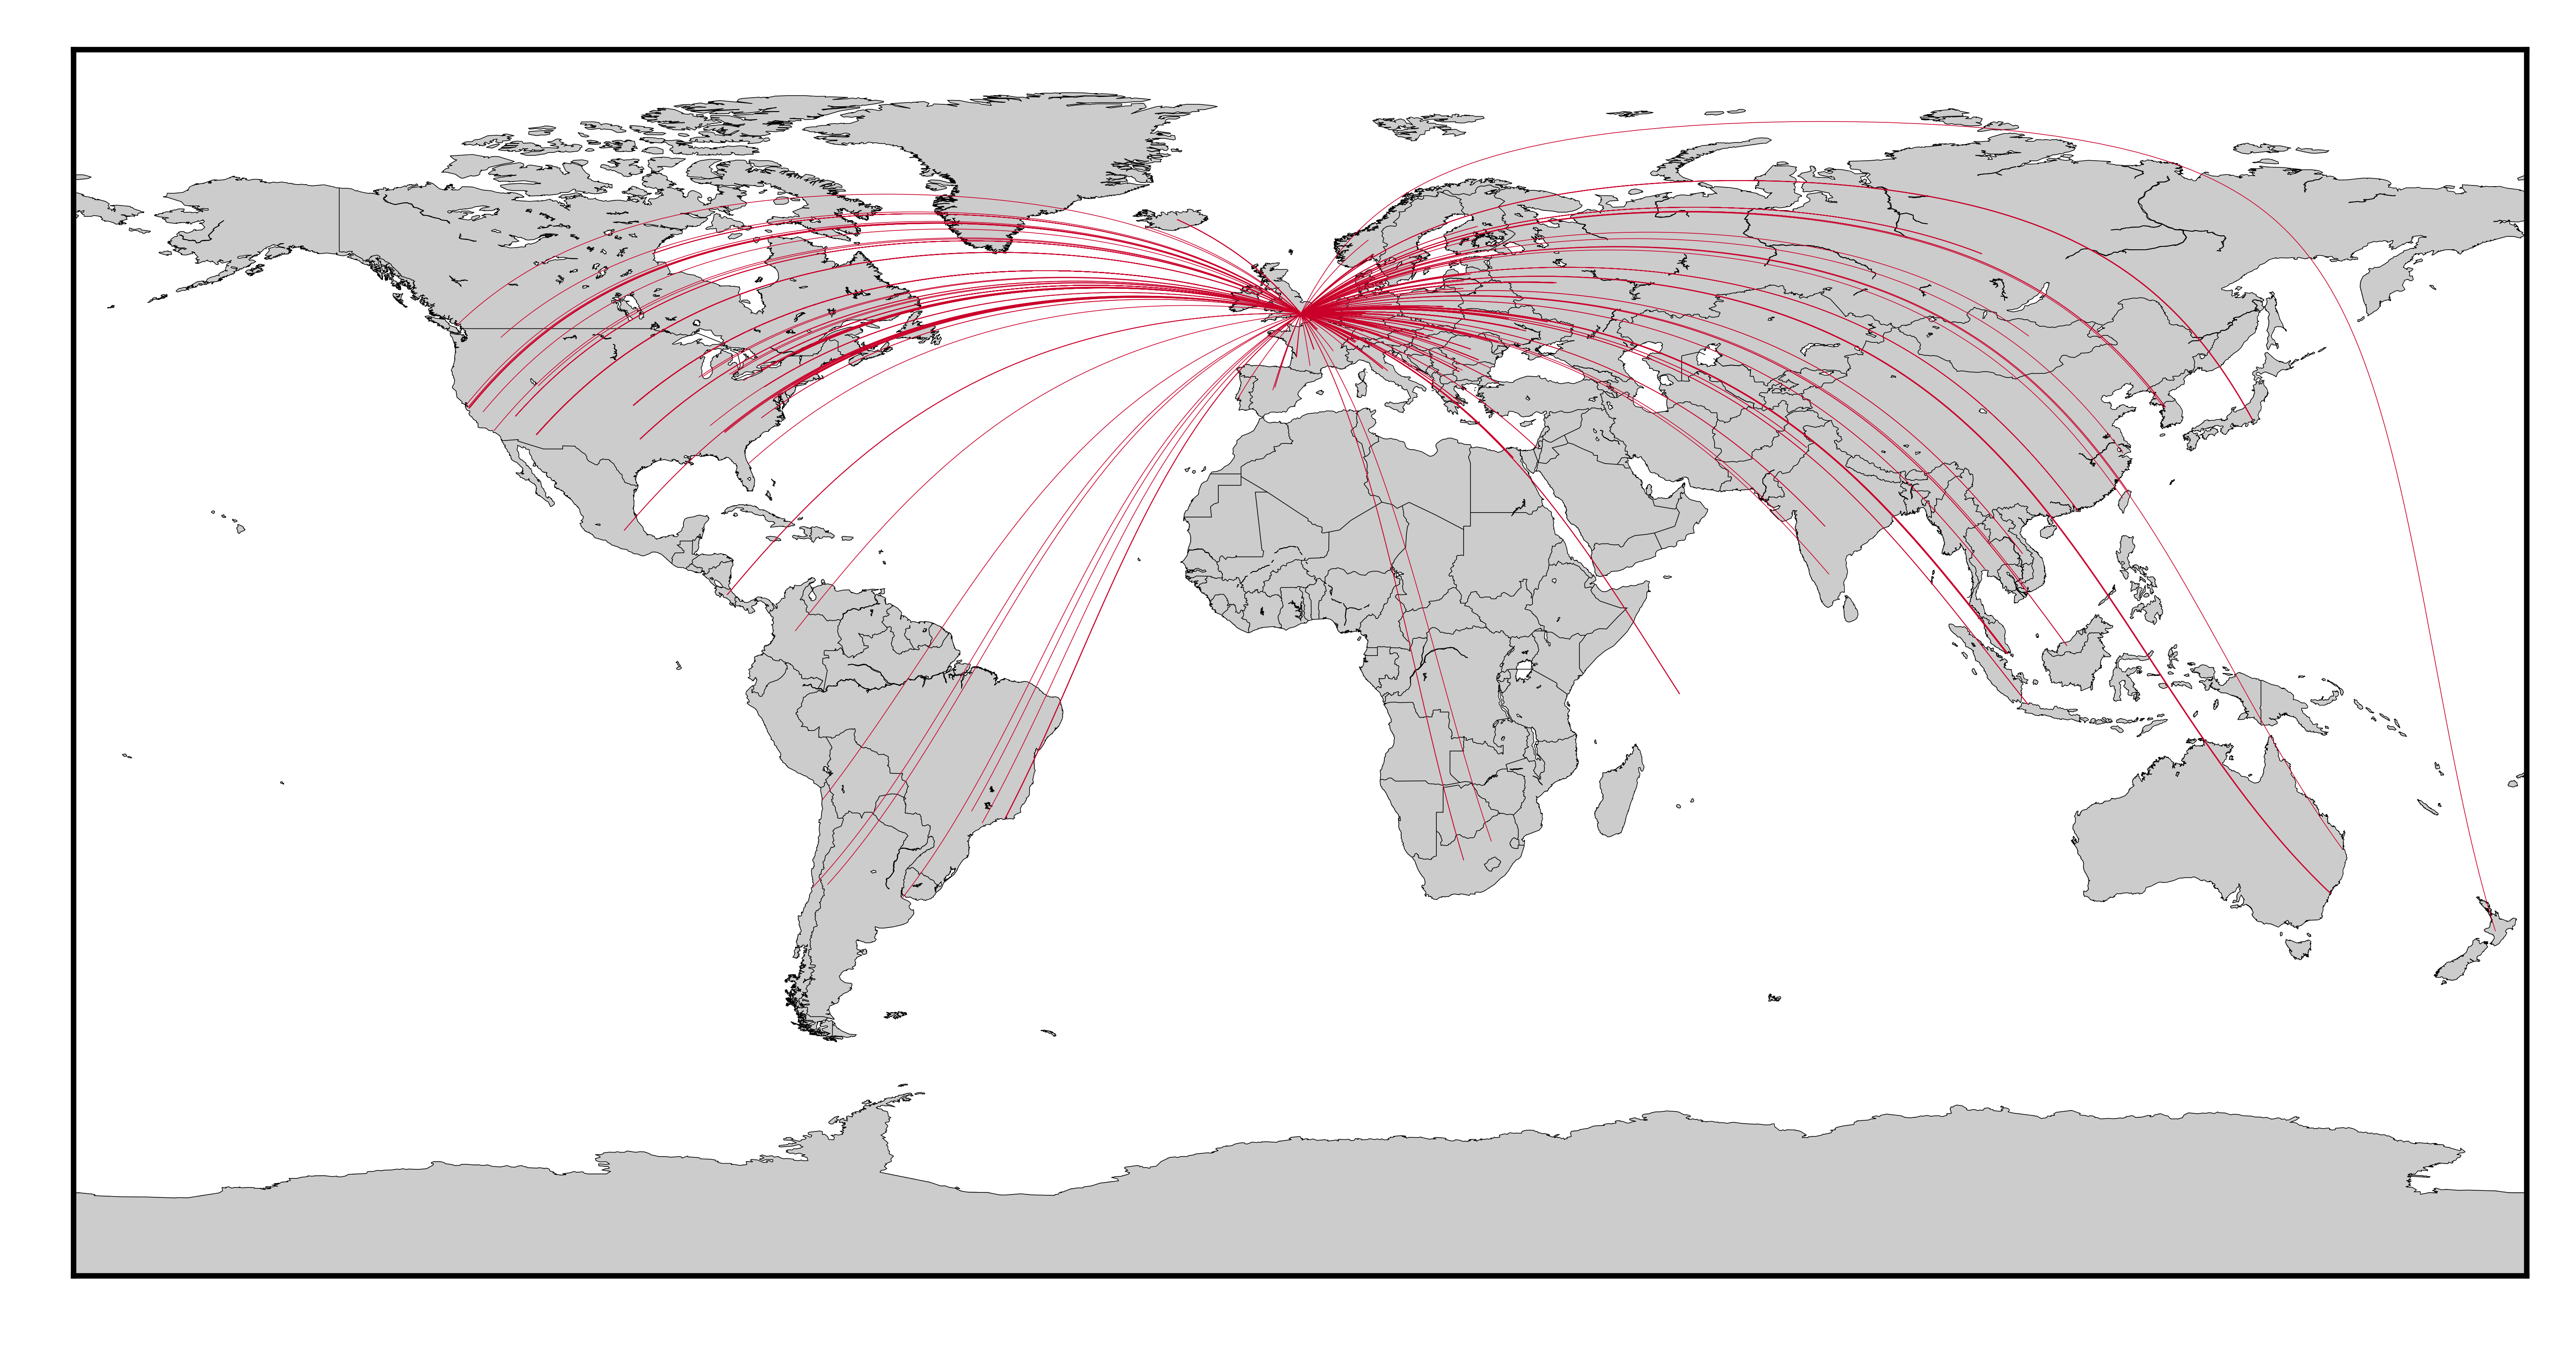
python3 geoipplotter.py -t connectionmap --db /tmp/GeoLite2-City.mmdb -i sourceip.txt -o connectionmap.png -d 51.50/0.12To generate heatmap plot:
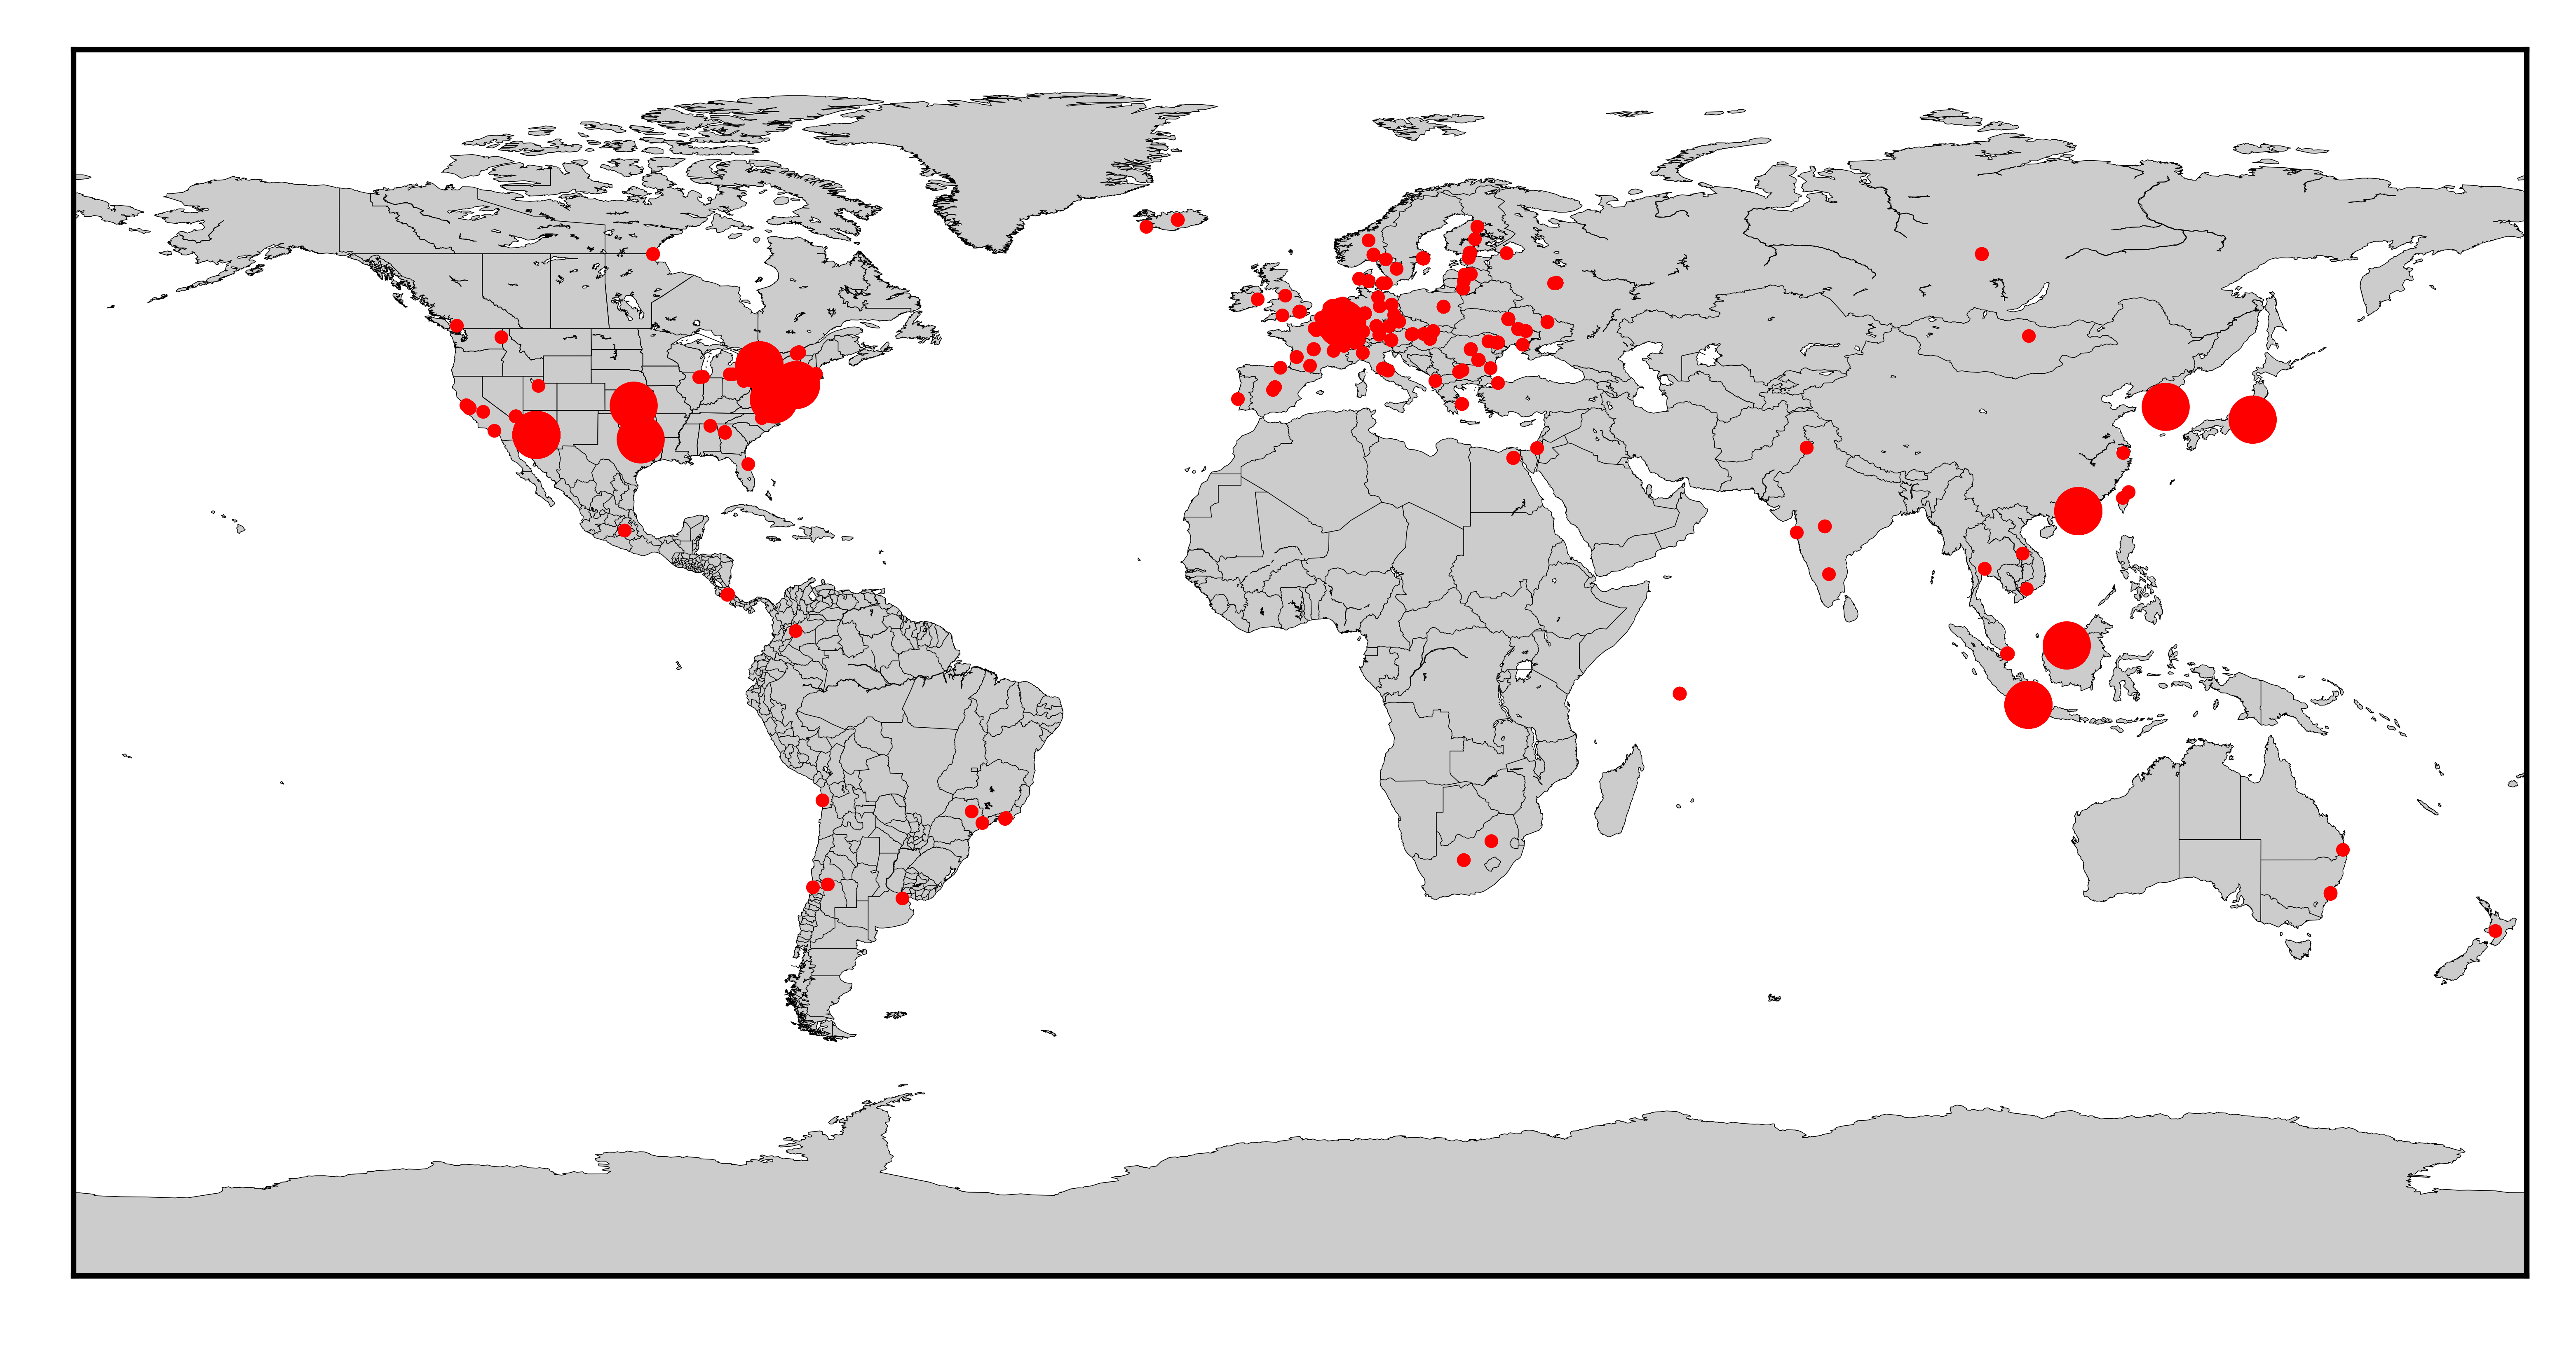
python3 geoipplotter.py -t heatmap --db /tmp/GeoLite2-City.mmdb -i sourceip.txt -o heatmap.pngTo generate hexbin plot:
python3 geoipplotter.py -t hexbin --db /tmp/GeoLite2-City.mmdb -i sourceip.txt -o hexbin.pngScatter plot of IPs
Bubble plot of IPs
Connection map plot of IPs
Heatmap plot of IPs
Hexbin plot of IPs
- Heatmap function need better coding
