There is a startup called Sparkify who wants to analyze the data that they have been collecting. So, the aim of the project is to perform ETL of the data(JSON to a Readshift Database) that Sparkify has collected for easy analysis.The dataset used here is an subset of Million songs Dataset.
Song Dataset consists of meta data of each song. File structure is as follows,
song_data/A/B/C/TRABCEI128F424C983.json
song_data/A/A/B/TRAABJL12903CDCF1A.json
Below is the structure of song file TRAABJL12903CDCF1A.json,
{"num_songs": 1, "artist_id": "ARJIE2Y1187B994AB7", "artist_latitude": null, "artist_longitude": null, "artist_location": "", "artist_name": "Line Renaud", "song_id": "SOUPIRU12A6D4FA1E1", "title": "Der Kleine Dompfaff", "duration": 152.92036, "year": 0}
Log Dataset simulate the activity of an music streaming app, generated from this event stimulator, and has the following structure.
log_data/2018/11/2018-11-12-events.json
log_data/2018/11/2018-11-13-events.json
And, a log file(2018-11-12-events.json) looks as follows,
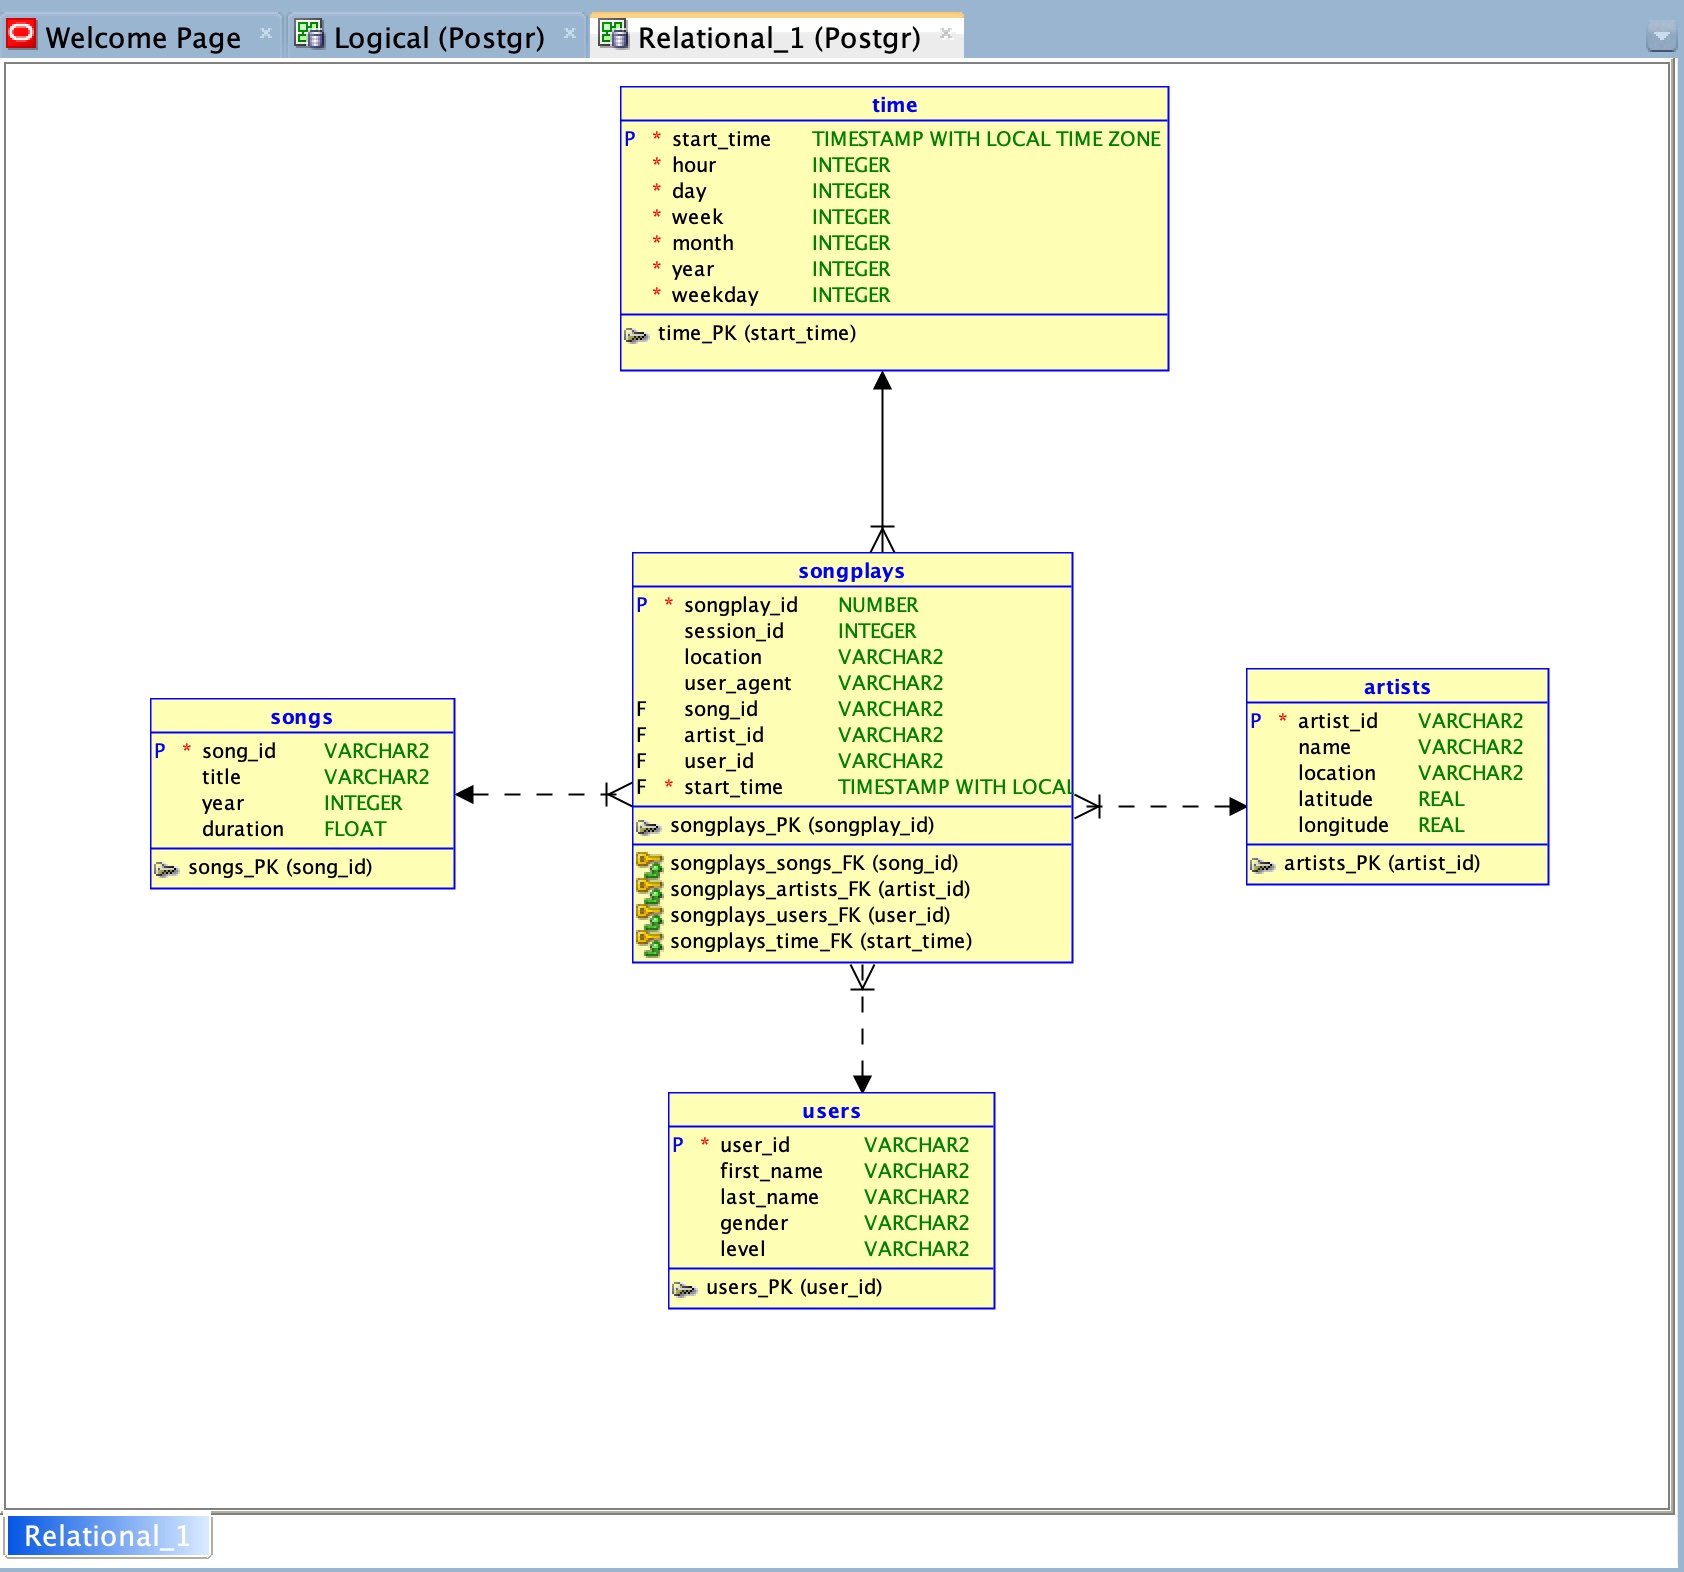
Fact Table - 'songplays' - records in log data associated with song plays.
Columns - songplay_id, start_time, user_id, level, song_id, artist_id, session_id, location, user_agent
Dimension Tables -
users - user_id, first_name, last_name, gender, level
songs - song_id, title, artist_id, year, duration
artists - artist_id, name, location, latitude, longitude
time- timestamps of records in songplays - start_time, hour, day, week, month, year, weekday
- Connect with Pyspark using the configuration in `dl.cfg`(IAM role with S3 Full Access and Redshift Full Access).
- Run the `etl.py` to read the json and, write it in parquet format.

