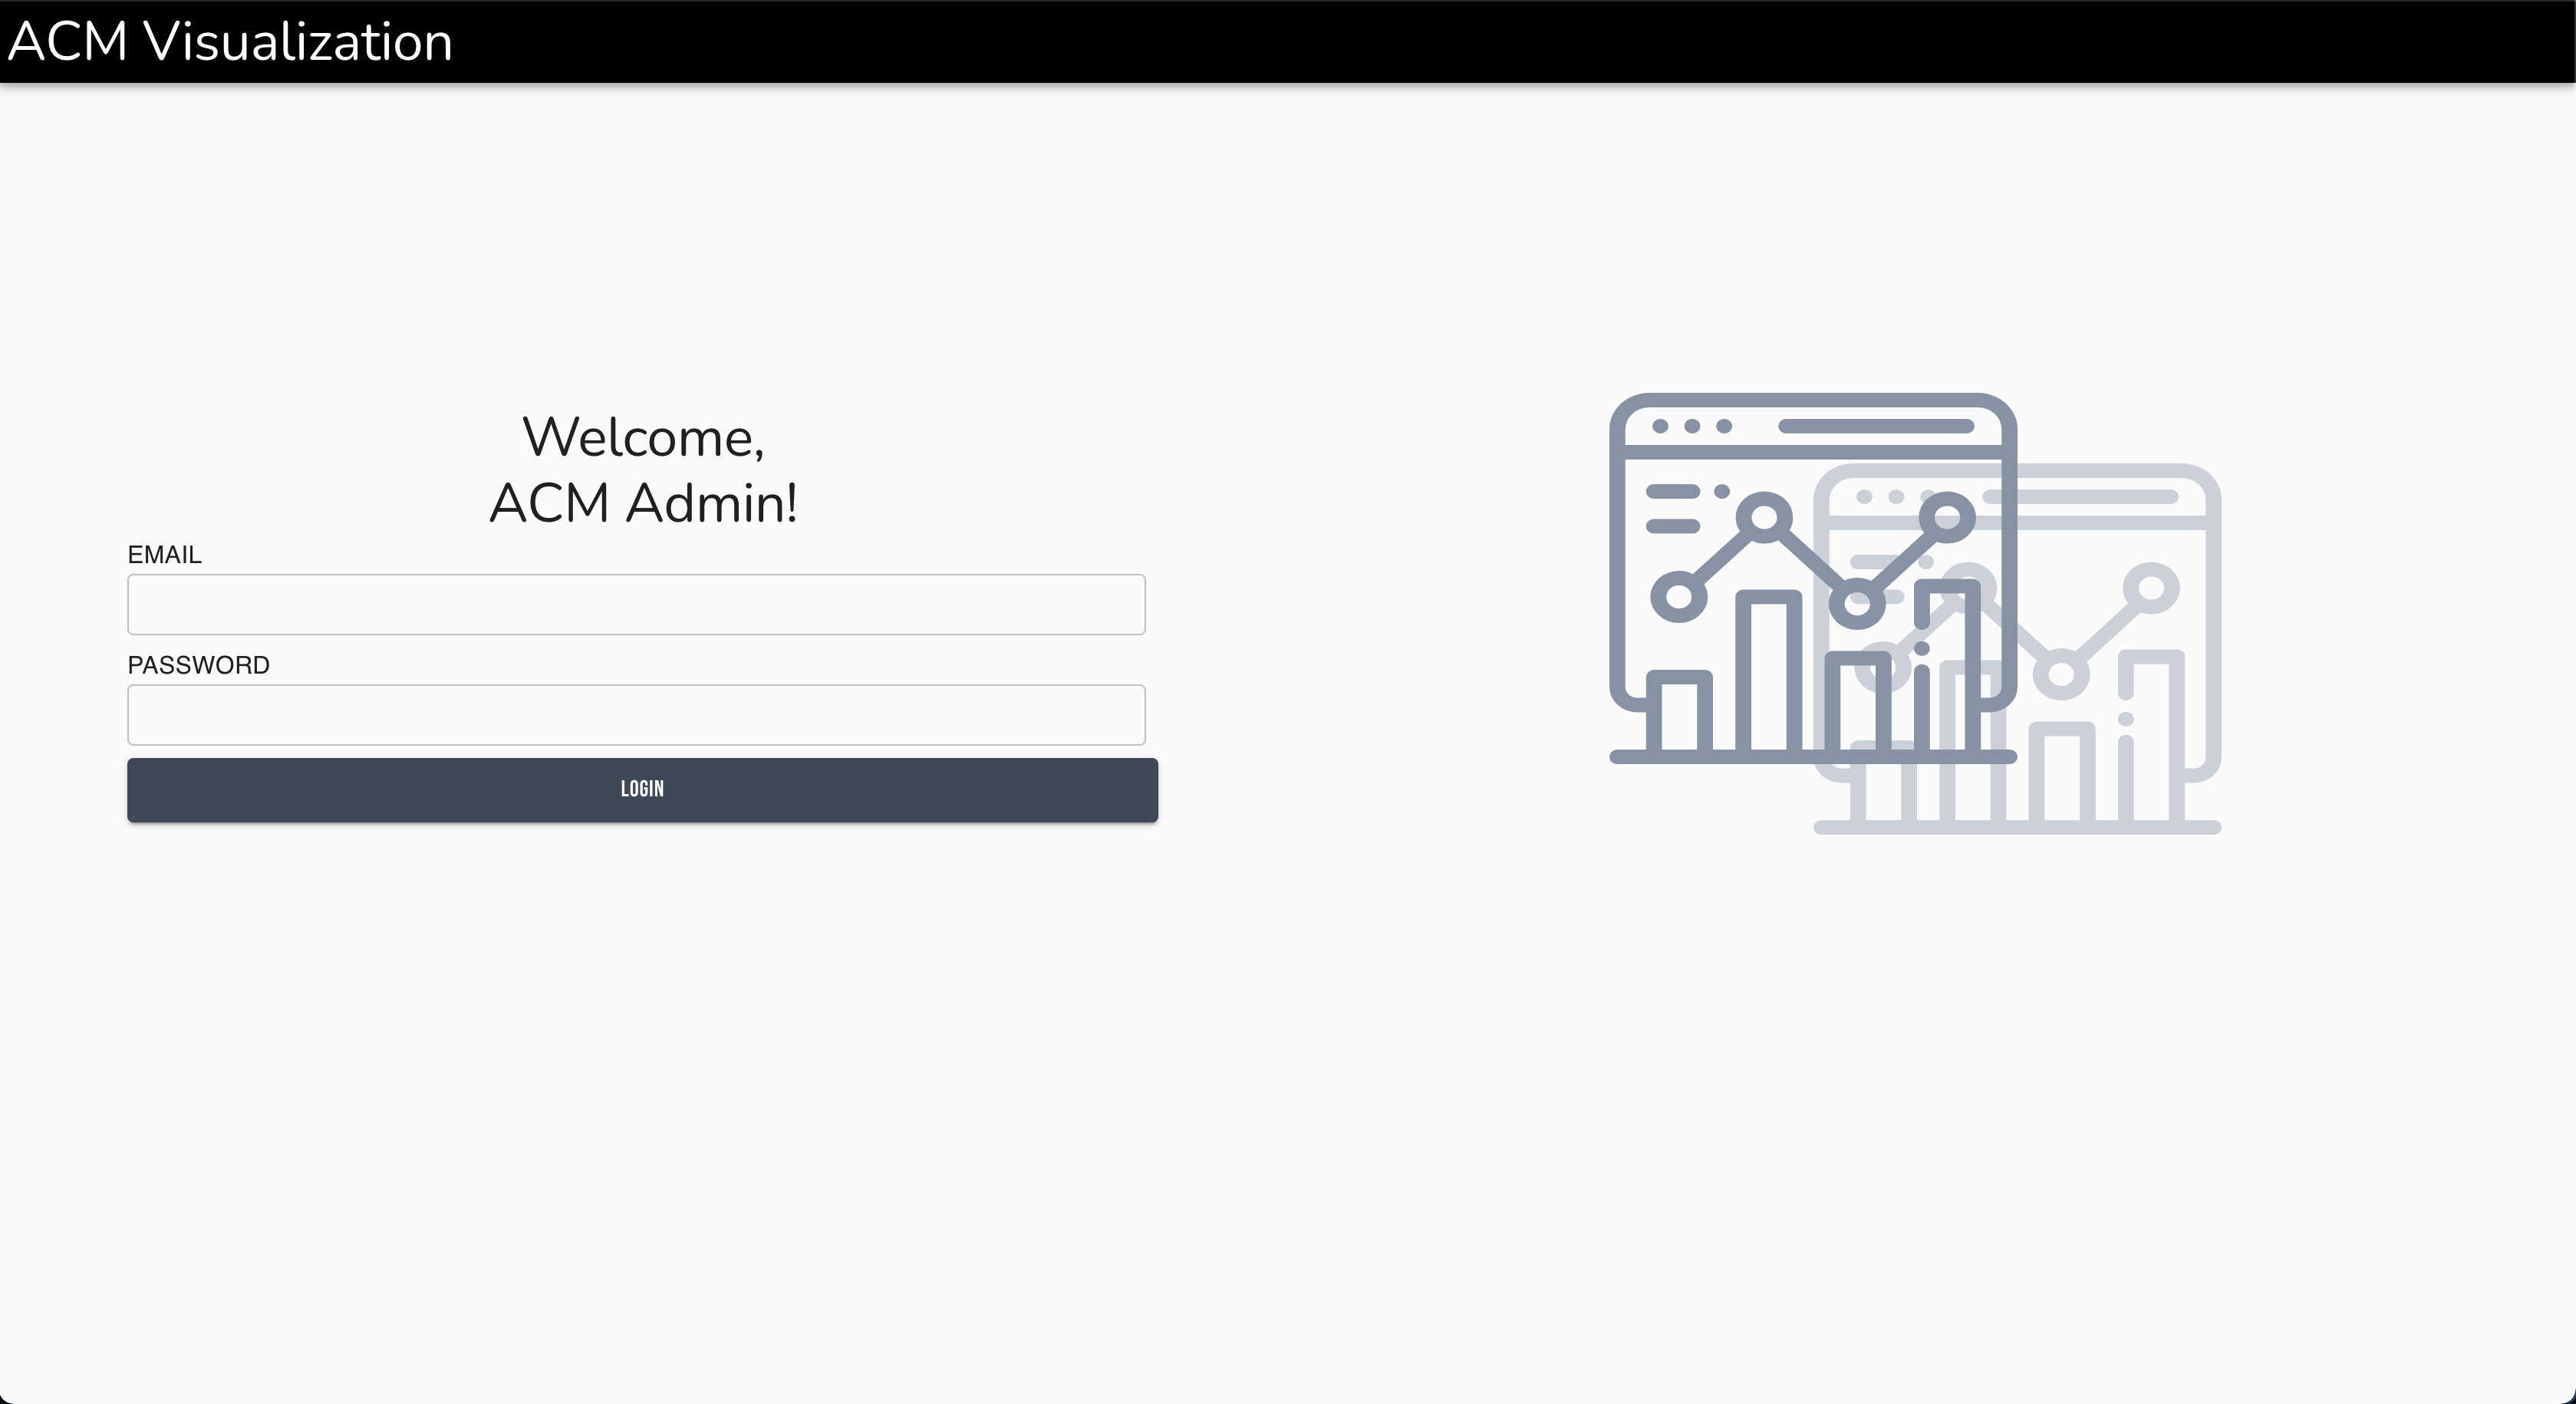
ACM Visualization is a web application that shows ACM event data in charts. This app has a heatmap for average attendance, a line chart for event attendance, a bar graph for mean and median points per event, and a pie chart for suborg events. It also has a login system to view the event data.
- React
- Express
- Node.js
- PostgreSQL
- Run
npm installin both/and/client - Create a
config.envfile with aDATABASE_URLenvironment variable
npm run server(runs backend only)npm run dev(runs both frontend and backend)


