Comparación de Métodos Estocásticos de estimación de IBNR Este repositorio contiene una librería que estima los IBNR por el método Chain-Ladder de manera determinística y cinco metodologías para hacerlo de manera estocástica:
Mack (1993) Bootstrap paramétrico normal
Boostrap paramétrico t
Boostrap no parmétrico
Boostrap no paramétrico suavizado
Además, en el presente MARKDOWN se implementa la librería para comparar los resultados arrojados por los cinco métodos previamente mencionados.
# Cargar librerías
import IBNR
import numpy as np
import pandas as pd
import scipy .stats as st
import matplotlib .pyplot as plt # Triángulo - Tabla 1: Mack (1993) https://citeseerx.ist.psu.edu/document?repid=rep1&type=pdf&doi=c449e39e64fd29b9aac7dd9266b841aa7ebc17ac
tab1 = [
[357848 , 1124788 , 1735330 , 2218270 , 2745596 , 3319994 , 3466336 , 3606286 , 3833515 , 3901463 ],
[352118 , 1236139 , 2170033 , 3353322 , 3799067 , 4120063 , 4647867 , 4914039 , 5339085 , 0 ],
[290507 , 1292306 , 2218525 , 3235179 , 3985995 , 4132918 , 4628910 , 4909315 , 0 , 0 ],
[310608 , 1418858 , 2195047 , 3757447 , 4029929 , 4381982 , 4588268 , 0 , 0 , 0 ],
[443160 , 1136350 , 2128333 , 2897821 , 3402672 , 3873311 , 0 , 0 , 0 , 0 ],
[396132 , 1333217 , 2180715 , 2985752 , 3691712 , 0 , 0 , 0 , 0 , 0 ],
[440832 , 1288463 , 2419861 , 3483130 , 0 , 0 , 0 , 0 , 0 , 0 ],
[359480 , 1421128 , 2864498 , 0 , 0 , 0 , 0 , 0 , 0 , 0 ],
[376686 , 1363294 , 0 , 0 , 0 , 0 , 0 , 0 , 0 , 0 ],
[344014 , 0 , 0 , 0 , 0 , 0 , 0 , 0 , 0 , 0 ]
]# Crear objeto
tr_acumulado = IBNR .Triangulo (triangulo = np .array (tab1 ),
años_desarrollo = range (1 ,11 ),
años_siniestro = range (1 ,11 ),tipo = 'Conteos' )
tr = tr_acumulado .desacumular () # Desacumular triángulo original
tr Año Desarrollo 1 2 3 4 5 6 7 \
Año Siniestro
1 357848 766940 610542 482940 527326 574398 146342
2 352118 884021 933894 1183289 445745 320996 527804
3 290507 1001799 926219 1016654 750816 146923 495992
4 310608 1108250 776189 1562400 272482 352053 206286
5 443160 693190 991983 769488 504851 470639 0
6 396132 937085 847498 805037 705960 0 0
7 440832 847631 1131398 1063269 0 0 0
8 359480 1061648 1443370 0 0 0 0
9 376686 986608 0 0 0 0 0
10 344014 0 0 0 0 0 0
Año Desarrollo 8 9 10
Año Siniestro
1 139950 227229 67948
2 266172 425046 0
3 280405 0 0
4 0 0 0
5 0 0 0
6 0 0 0
7 0 0 0
8 0 0 0
9 0 0 0
10 0 0 0
# Aplicar funciones a los valores del triángulo
tr .apply (np .log )C:\Users\SHSANCHE\OneDrive - Proteccion S.A\Procesos Actuaría\Practicante\2023-01\Proyecto IBNR\IBNR\s02_crear_triangulos.py:152: RuntimeWarning: divide by zero encountered in log
Año Desarrollo 1 2 3 4 5 \
Año Siniestro
1 12.787864 13.550164 13.322102 13.087648 13.175574
2 12.771722 13.692236 13.747118 13.983808 13.007502
3 12.579383 13.817308 13.738866 13.832027 13.528916
4 12.646287 13.918293 13.562151 14.261734 12.515328
5 13.001686 13.449059 13.807461 13.553481 13.132019
6 12.889503 13.750529 13.650044 13.598644 13.467314
7 12.996419 13.650201 13.938965 13.876859 0.000000
8 12.792414 13.875333 14.182491 0.000000 0.000000
9 12.839167 13.802028 0.000000 0.000000 0.000000
10 12.748438 0.000000 0.000000 0.000000 0.000000
Año Desarrollo 6 7 8 9 10
Año Siniestro
1 13.261078 11.893702 11.849040 12.333714 11.126498
2 12.679184 13.176480 12.491898 12.959953 0.000000
3 11.897664 13.114315 12.543990 0.000000 0.000000
4 12.771537 12.237019 0.000000 0.000000 0.000000
5 13.061847 0.000000 0.000000 0.000000 0.000000
6 0.000000 0.000000 0.000000 0.000000 0.000000
7 0.000000 0.000000 0.000000 0.000000 0.000000
8 0.000000 0.000000 0.000000 0.000000 0.000000
9 0.000000 0.000000 0.000000 0.000000 0.000000
10 0.000000 0.000000 0.000000 0.000000 0.000000
# Exportar a Excel
tr .to_excel ('triangulo_acumulado_mack_1993.xlsx' )# Exportar a LaTeX
print (tr .df .to_latex ())\begin{tabular}{lrrrrrrrrrr}
\toprule
Año Desarrollo & 1 & 2 & 3 & 4 & 5 & 6 & 7 & 8 & 9 & 10 \\
Año Siniestro & & & & & & & & & & \\
\midrule
1 & 357848 & 766940 & 610542 & 482940 & 527326 & 574398 & 146342 & 139950 & 227229 & 67948 \\
2 & 352118 & 884021 & 933894 & 1183289 & 445745 & 320996 & 527804 & 266172 & 425046 & 0 \\
3 & 290507 & 1001799 & 926219 & 1016654 & 750816 & 146923 & 495992 & 280405 & 0 & 0 \\
4 & 310608 & 1108250 & 776189 & 1562400 & 272482 & 352053 & 206286 & 0 & 0 & 0 \\
5 & 443160 & 693190 & 991983 & 769488 & 504851 & 470639 & 0 & 0 & 0 & 0 \\
6 & 396132 & 937085 & 847498 & 805037 & 705960 & 0 & 0 & 0 & 0 & 0 \\
7 & 440832 & 847631 & 1131398 & 1063269 & 0 & 0 & 0 & 0 & 0 & 0 \\
8 & 359480 & 1061648 & 1443370 & 0 & 0 & 0 & 0 & 0 & 0 & 0 \\
9 & 376686 & 986608 & 0 & 0 & 0 & 0 & 0 & 0 & 0 & 0 \\
10 & 344014 & 0 & 0 & 0 & 0 & 0 & 0 & 0 & 0 & 0 \\
\bottomrule
\end{tabular}
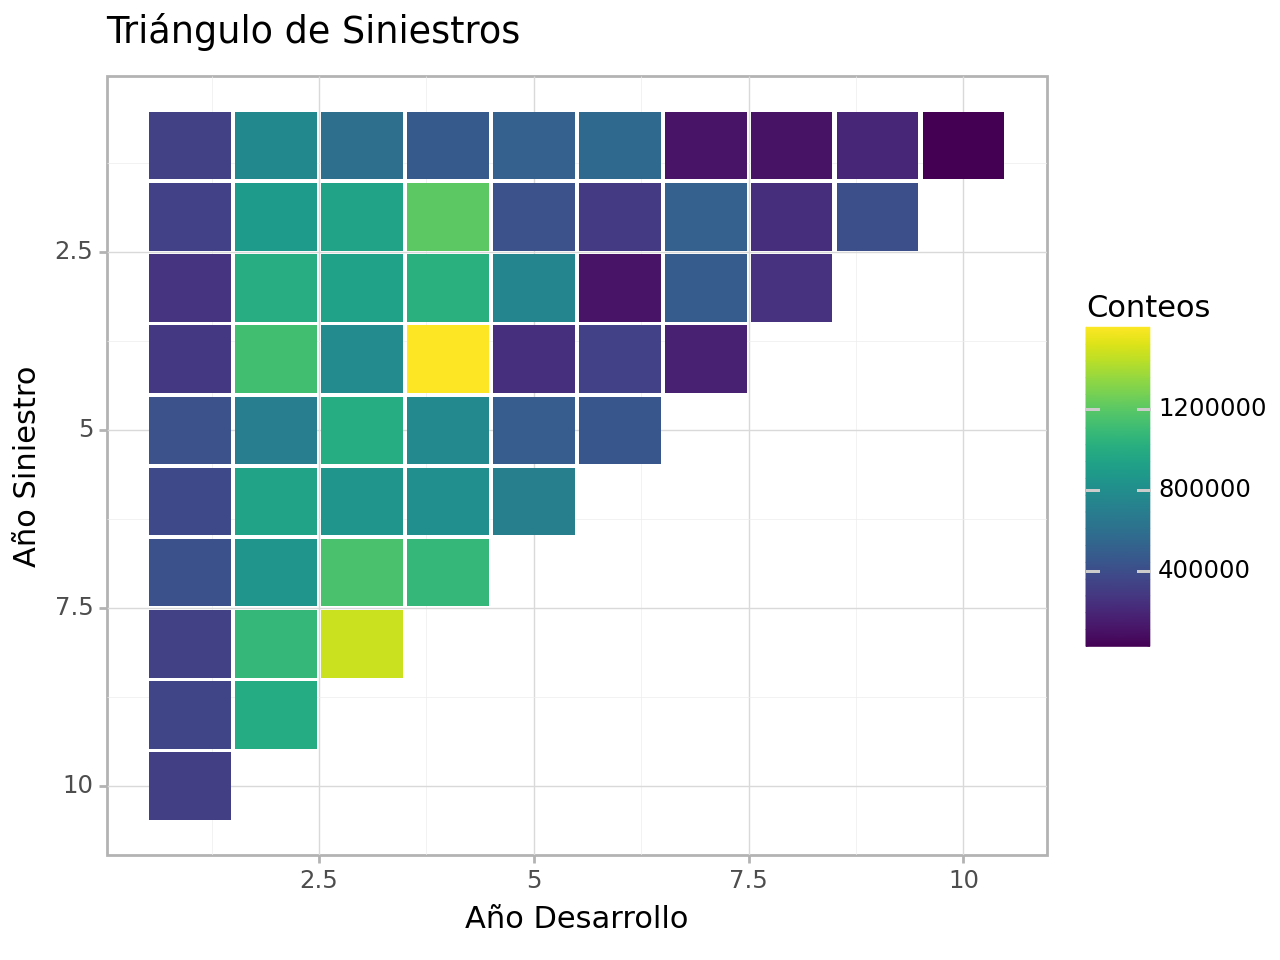
# Triángulo representado por medio de un mapa de calor
tr .heat_plot ()
<Figure Size: (640 x 480)>
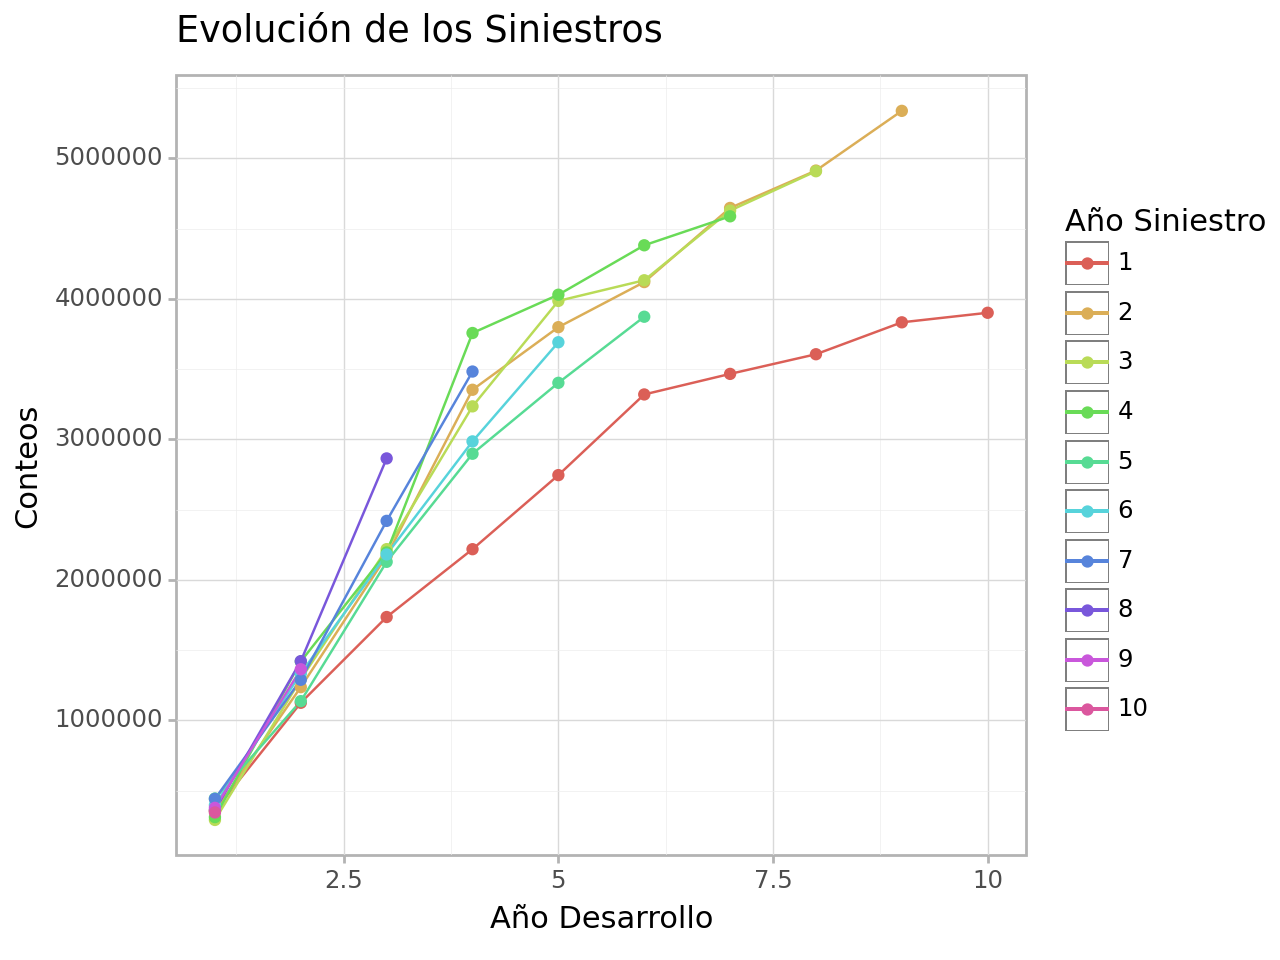
# Cantidad de siniestros reportados por año según el año de origen
tr .acumular ().line_plot ()
<Figure Size: (640 x 480)>
# Factores de desarrollo
tr .factores_desarrollo ()[3.4906065479322863,
1.7473326421004893,
1.4574128360182361,
1.1738517093997867,
1.103823532244344,
1.0862693644363943,
1.0538743555048127,
1.0765551783529383,
1.017724725219544]
# Varianzas
tr .varianzas ()[160280.32748048689,
37736.855047996374,
41965.21301742404,
15182.902680976436,
13731.323891978891,
8185.771620009633,
446.616550105352,
1147.3659684286617,
446.616550105352]
# Llenar triángulo con estimaciones
tr .fill ()Año Desarrollo 1 2 3 4 5 6 7 \
Año Siniestro
1 357848 766940 610542 482940 527326 574398 146342
2 352118 884021 933894 1183289 445745 320996 527804
3 290507 1001799 926219 1016654 750816 146923 495992
4 310608 1108250 776189 1562400 272482 352053 206286
5 443160 693190 991983 769488 504851 470639 334148
6 396132 937085 847498 805037 705960 383286 351547
7 440832 847631 1131398 1063269 605548 424500 389348
8 359480 1061648 1443370 1310258 725788 508791 466659
9 376686 986608 1018834 1089615 603568 423113 388076
10 344014 856803 897409 959755 531635 372686 341825
Año Desarrollo 8 9 10
Año Siniestro
1 139950 227229 67948
2 266172 425046 94633
3 280405 375833 93677
4 247189 370179 92268
5 226674 339455 84610
6 238477 357131 89016
7 264120 395533 98588
8 316565 474072 118164
9 263257 394240 98265
10 231882 347254 86554
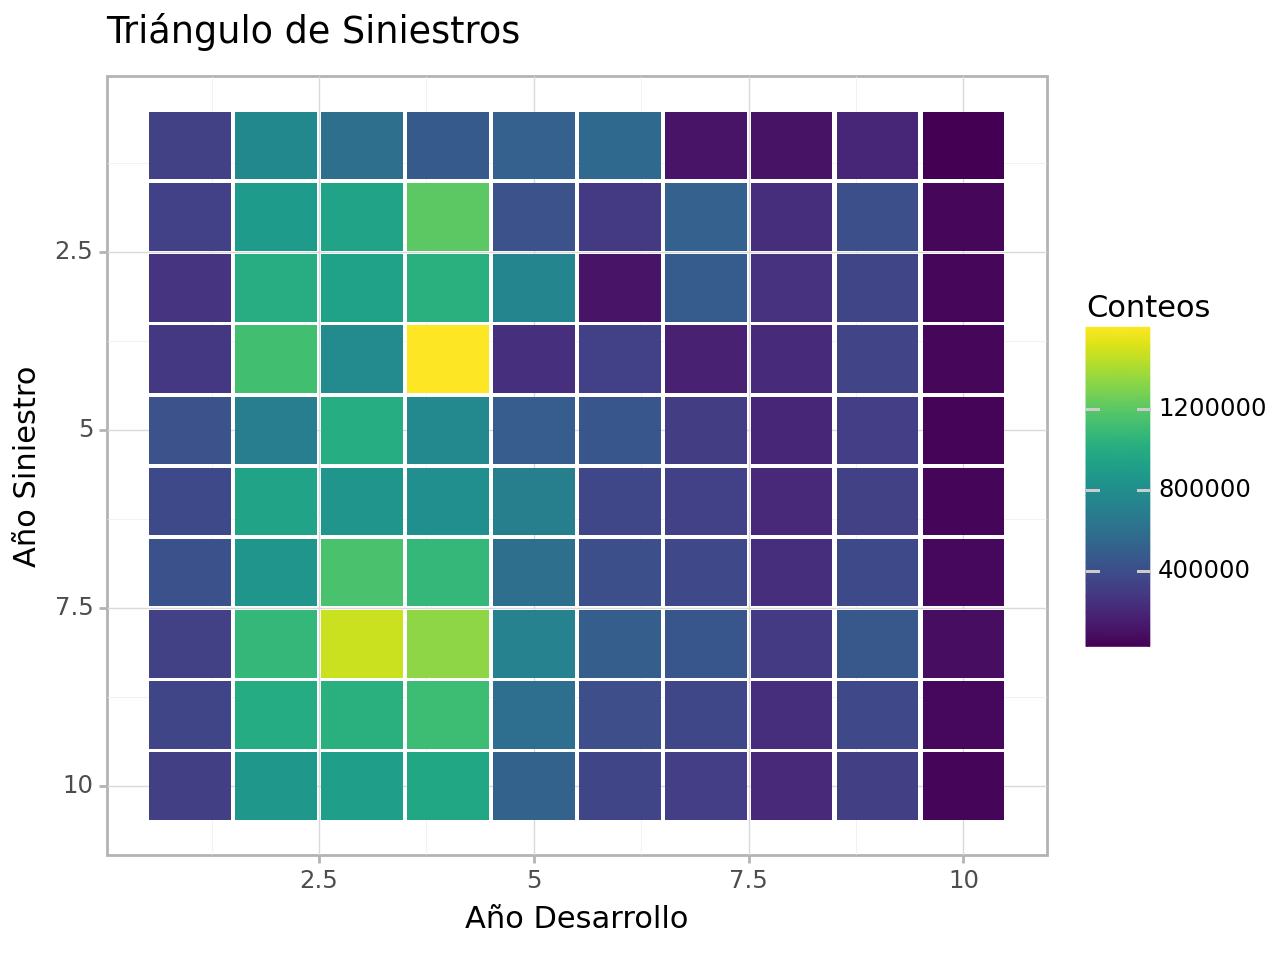
tr .fill ().heat_plot (solo_observado = False )
<Figure Size: (640 x 480)>
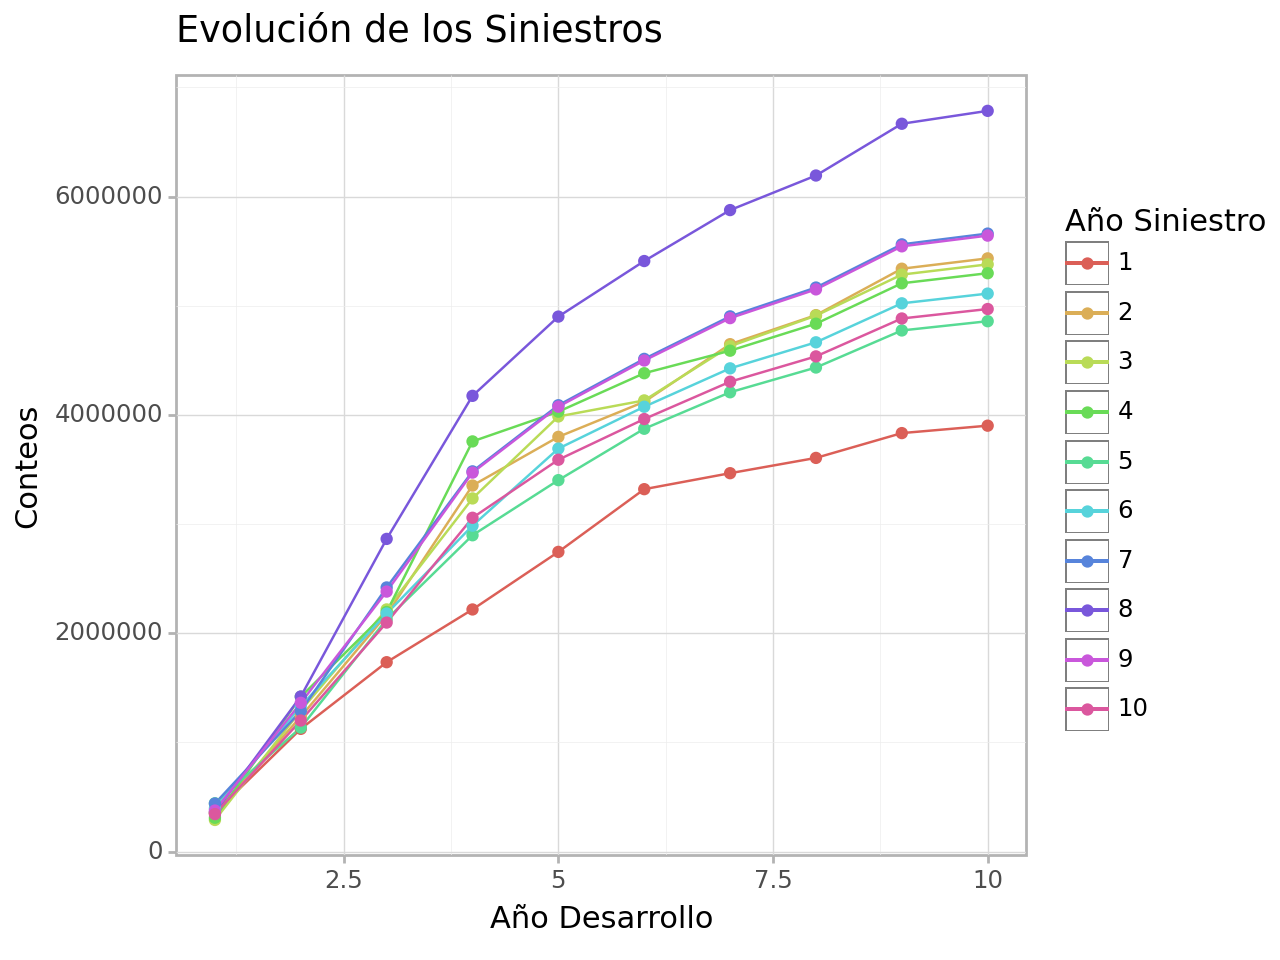
tr .fill ().acumular (limpiar_tri_inferior = False ).line_plot (solo_observado = False )
<Figure Size: (640 x 480)>
# Calcular estimación del total por año de desarrollo
tr .totales_año_siniestro ()Año Siniestro
1 3901463
2 5433718
3 5378825
4 5297904
5 4858198
6 5111169
7 5660767
8 6784795
9 5642262
10 4969817
Name: Conteos, dtype: int32
est_mack = tr .limite_superior_totales ()
est_mack
<style scoped>
.dataframe tbody tr th:only-of-type {
vertical-align: middle;
}
.dataframe tbody tr th {
    vertical-align: top;
}

.dataframe thead th {
    text-align: right;
}
</style>
Estimación Puntual
Error Estándar
Límite Superior
Año Siniestro
1
3901463
0
3.901463e+06
2
5433718
61420
5.534745e+06
3
5378825
108108
5.556647e+06
4
5297904
120710
5.496454e+06
5
4858198
252158
5.272961e+06
6
5111169
401095
5.770912e+06
7
5660767
546627
6.559888e+06
8
6784795
859056
8.197816e+06
9
5642262
958811
7.219366e+06
10
4969817
1352922
7.195176e+06
Total
53038918
2328132
5.686835e+07
# Residuales con distribución Normal
est_bt_par_norm = tr .bootstrap (parametrico = True ,distribucion_parametrica = 'Normal' )
est_bt_par_norm [==================================================] 5000/5000
<style scoped>
.dataframe tbody tr th:only-of-type {
vertical-align: middle;
}
.dataframe tbody tr th {
    vertical-align: top;
}

.dataframe thead th {
    text-align: right;
}
</style>
Estimación Puntual
Error Estándar
Límite Superior
Año Siniestro
1
3901463
1.184302e+06
7272655.20
2
5433718
1.194506e+06
7166172.85
3
5378825
1.057670e+06
6049189.10
4
5297904
1.095818e+06
6401729.95
5
4858198
1.327274e+06
8733218.40
6
5111169
1.230802e+06
7881980.60
7
5660767
1.234783e+06
8509389.20
8
6784795
1.053399e+06
6997681.90
9
5642262
9.765954e+05
7106063.70
10
4969817
4.144032e+05
5700470.50
Total
53038918
4.422593e+06
60836585.70
# Residuales con distribución t de Student
est_bt_par_t = tr .bootstrap (parametrico = True )
est_bt_par_t [==================================================] 5000/5000
<style scoped>
.dataframe tbody tr th:only-of-type {
vertical-align: middle;
}
.dataframe tbody tr th {
    vertical-align: top;
}

.dataframe thead th {
    text-align: right;
}
</style>
Estimación Puntual
Error Estándar
Límite Superior
Año Siniestro
1
3901463
1.225259e+06
7292054.55
2
5433718
1.195704e+06
7134433.85
3
5378825
1.080441e+06
6110840.05
4
5297904
1.134521e+06
6473687.75
5
4858198
1.349438e+06
8704490.00
6
5111169
1.248722e+06
7930195.05
7
5660767
1.306648e+06
8601035.45
8
6784795
1.075973e+06
7049736.35
9
5642262
1.014142e+06
7204075.65
10
4969817
4.213072e+05
5710403.80
Total
53038918
4.496274e+06
60942611.40
# Función de distribución empírica
est_bt_npar = tr .bootstrap (suavizado = False )
est_bt_npar [==================================================] 5000/5000
<style scoped>
.dataframe tbody tr th:only-of-type {
vertical-align: middle;
}
.dataframe tbody tr th {
    vertical-align: top;
}

.dataframe thead th {
    text-align: right;
}
</style>
Estimación Puntual
Error Estándar
Límite Superior
Año Siniestro
1
3901463
1.194784e+06
7337137.20
2
5433718
1.167222e+06
7094851.55
3
5378825
1.046163e+06
6040221.35
4
5297904
1.085885e+06
6404389.35
5
4858198
1.303841e+06
8718231.95
6
5111169
1.205641e+06
7877555.95
7
5660767
1.226971e+06
8498999.25
8
6784795
1.037986e+06
7044096.35
9
5642262
9.747336e+05
7177121.70
10
4969817
3.998770e+05
5682028.40
Total
53038918
4.267568e+06
60639768.25
# Función de distribución empírica suavizada
est_bt_npar_suav = tr .bootstrap ()
est_bt_npar_suav [==================================================] 5000/5000
<style scoped>
.dataframe tbody tr th:only-of-type {
vertical-align: middle;
}
.dataframe tbody tr th {
    vertical-align: top;
}

.dataframe thead th {
    text-align: right;
}
</style>
Estimación Puntual
Error Estándar
Límite Superior
Año Siniestro
1
3901463
1.369848e+06
7643879.20
2
5433718
1.317400e+06
7397655.10
3
5378825
1.208257e+06
6336944.45
4
5297904
1.237703e+06
6620871.75
5
4858198
1.491447e+06
9027322.25
6
5111169
1.357090e+06
8162928.95
7
5660767
1.414467e+06
8804822.10
8
6784795
1.185200e+06
7296835.30
9
5642262
1.128810e+06
7436971.40
10
4969817
4.651343e+05
5787567.65
Total
53038918
4.964007e+06
61766107.85
# Nombres abreviados de las metodologías
labs = ['Mack' ,'BT P N' , 'BT P T' ,'BT NP' ,'BT NP S' ]with pd .ExcelWriter ('resultado_comparación.xlsx' ) as writer :
est_mack .to_excel (writer ,sheet_name = labs [0 ])
est_bt_par_norm .to_excel (writer ,sheet_name = labs [1 ])
est_bt_par_t .to_excel (writer ,sheet_name = labs [2 ])
est_bt_npar .to_excel (writer ,sheet_name = labs [3 ])
est_bt_npar_suav .to_excel (writer ,sheet_name = labs [4 ])Comparación de resultados limites_superiores = {}
for lb in labs :
limites_superiores [lb ] = np .array (pd .read_excel ('resultado_comparación.xlsx' ,
sheet_name = lb )['Límite Superior' ])
indices = pd .read_excel ('resultado_comparación.xlsx' ,
sheet_name = 'Mack' ).set_index ('Año Siniestro' ).index
df_limites = pd .DataFrame (limites_superiores ,
index = indices ).drop ('Total' )
df_limites
<style scoped>
.dataframe tbody tr th:only-of-type {
vertical-align: middle;
}
.dataframe tbody tr th {
    vertical-align: top;
}

.dataframe thead th {
    text-align: right;
}
</style>
Mack
BT P N
BT P T
BT NP
BT NP S
Año Siniestro
1
3.901463e+06
7272655.20
7292054.55
7337137.20
7643879.20
2
5.534745e+06
7166172.85
7134433.85
7094851.55
7397655.10
3
5.556647e+06
6049189.10
6110840.05
6040221.35
6336944.45
4
5.496454e+06
6401729.95
6473687.75
6404389.35
6620871.75
5
5.272961e+06
8733218.40
8704490.00
8718231.95
9027322.25
6
5.770912e+06
7881980.60
7930195.05
7877555.95
8162928.95
7
6.559888e+06
8509389.20
8601035.45
8498999.25
8804822.10
8
8.197816e+06
6997681.90
7049736.35
7044096.35
7296835.30
9
7.219366e+06
7106063.70
7204075.65
7177121.70
7436971.40
10
7.195176e+06
5700470.50
5710403.80
5682028.40
5787567.65
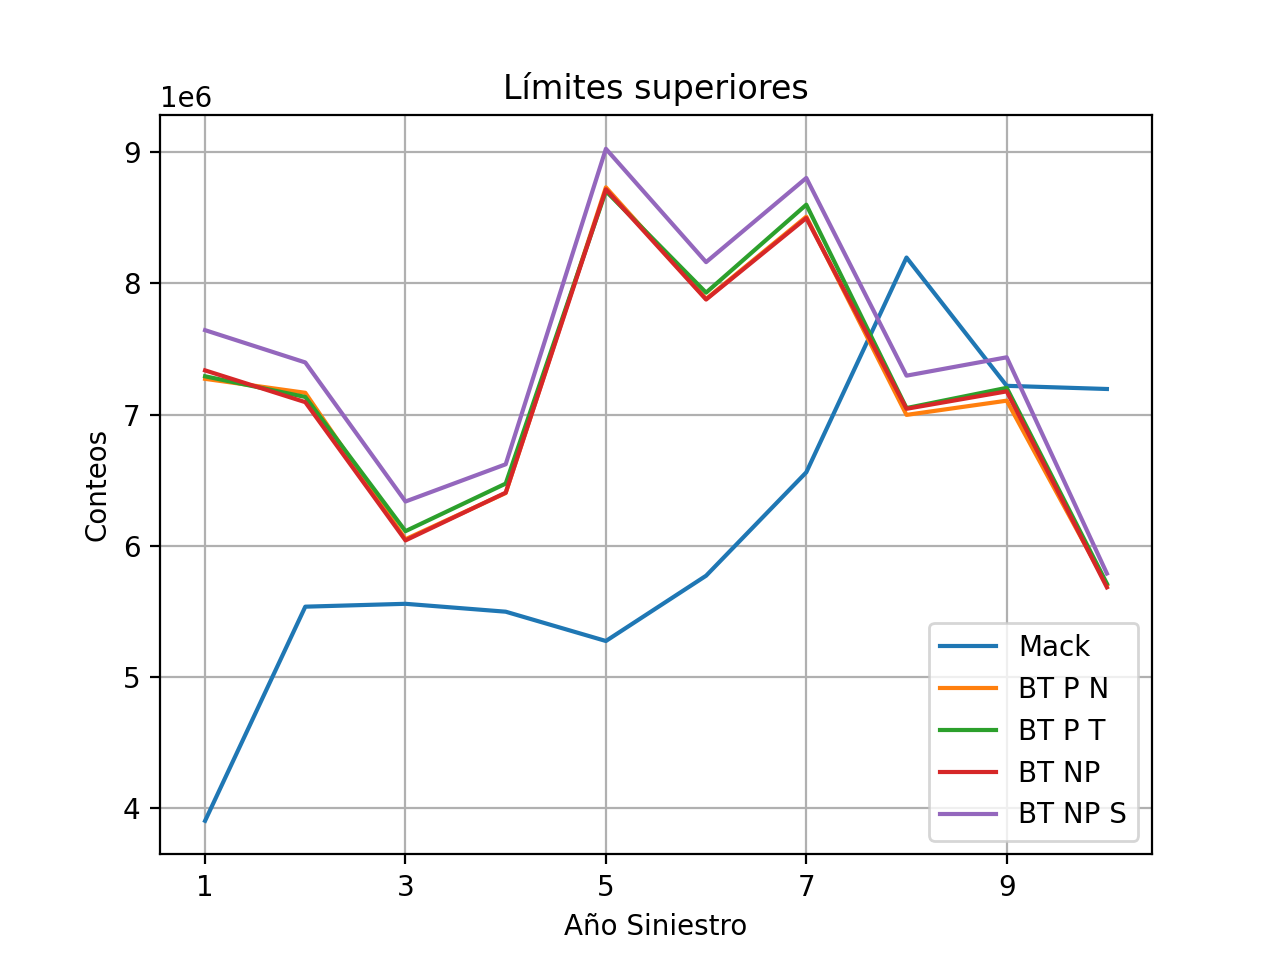
df_limites .plot (y = df_limites .columns ,kind = 'line' ,
title = 'Límites superiores' ,ylabel = tr .tipo )
plt .grid ()
plt .show ()
tr .reserva (metodo = 'Mack' )
<style scoped>
.dataframe tbody tr th:only-of-type {
vertical-align: middle;
}
.dataframe tbody tr th {
    vertical-align: top;
}

.dataframe thead th {
    text-align: right;
}
</style>
Estimación Puntual
Error Estándar
Límite Superior
Año Siniestro
1
0
0
0.000000e+00
2
94633
61420
1.956599e+05
3
469510
108108
6.473318e+05
4
709636
120710
9.081863e+05
5
984887
252158
1.399650e+06
6
1419457
401095
2.079200e+06
7
2177637
546627
3.076758e+06
8
3920297
859056
5.333318e+06
9
4278968
958811
5.856072e+06
10
4625803
1352922
6.851162e+06
Total
18680828
2328132
2.251026e+07
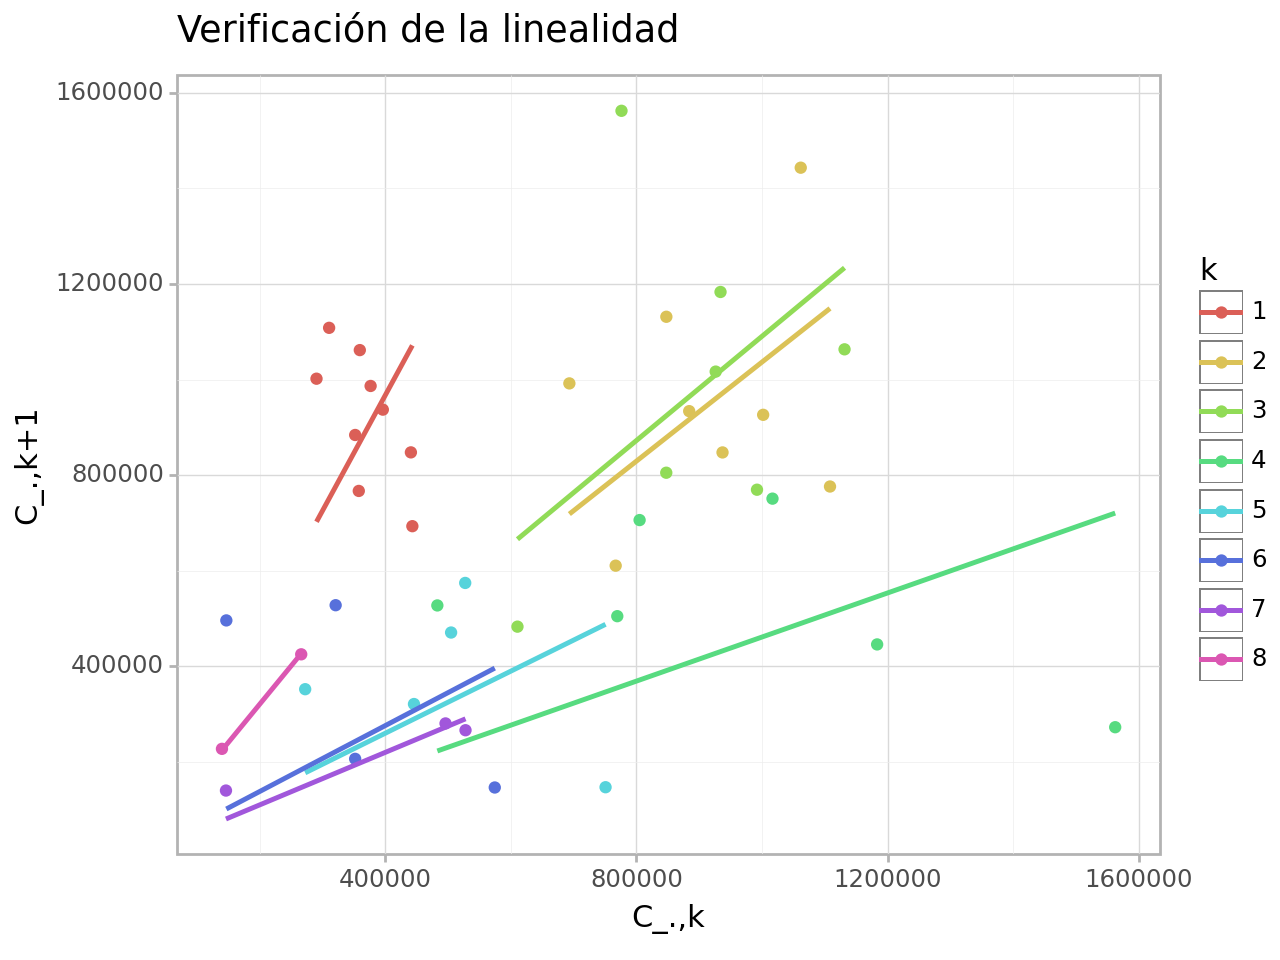
Revisión de residuales y supuestos
<Figure Size: (640 x 480)>
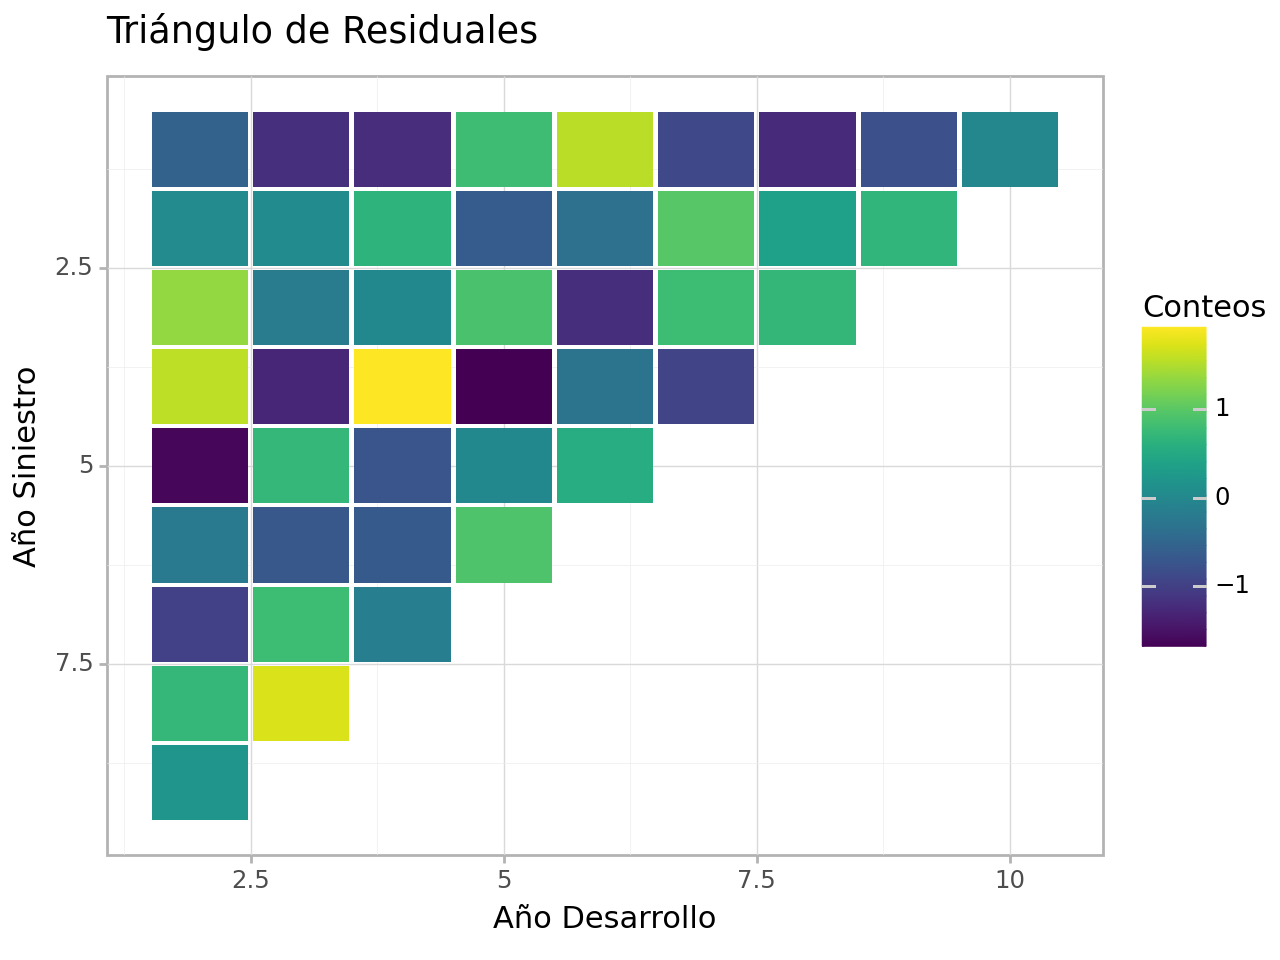
res_tr = tr .residuales (retornar_triangulo = True ) # Calcular triángulo de residuales
res_tr .heat_plot (titulo = 'Triángulo de Residuales' )
<Figure Size: (640 x 480)>
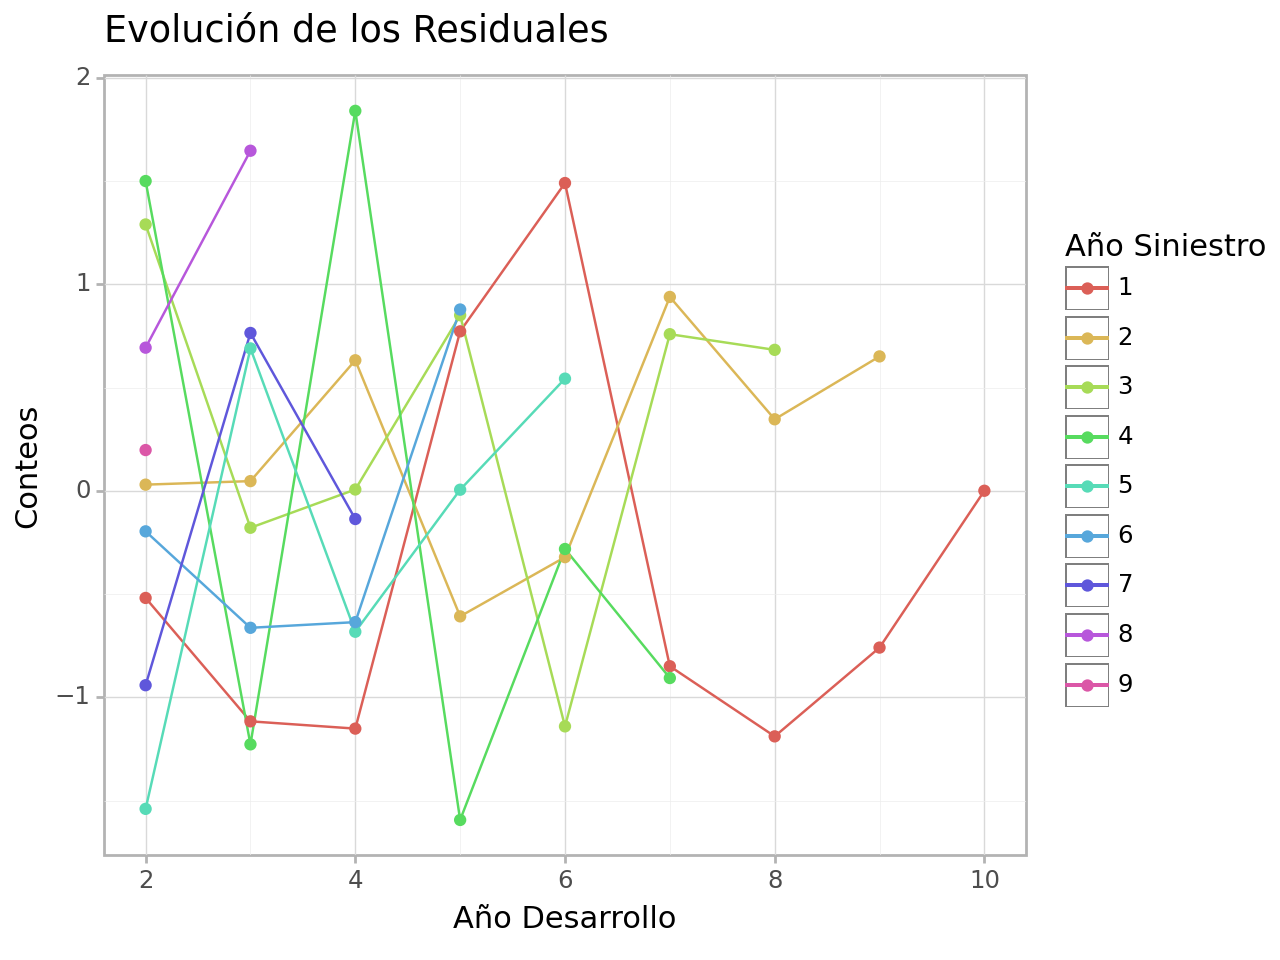
res_tr .line_plot (titulo = 'Evolución de los Residuales' )
<Figure Size: (640 x 480)>
res = tr .residuales () # Extraer vector de residuales
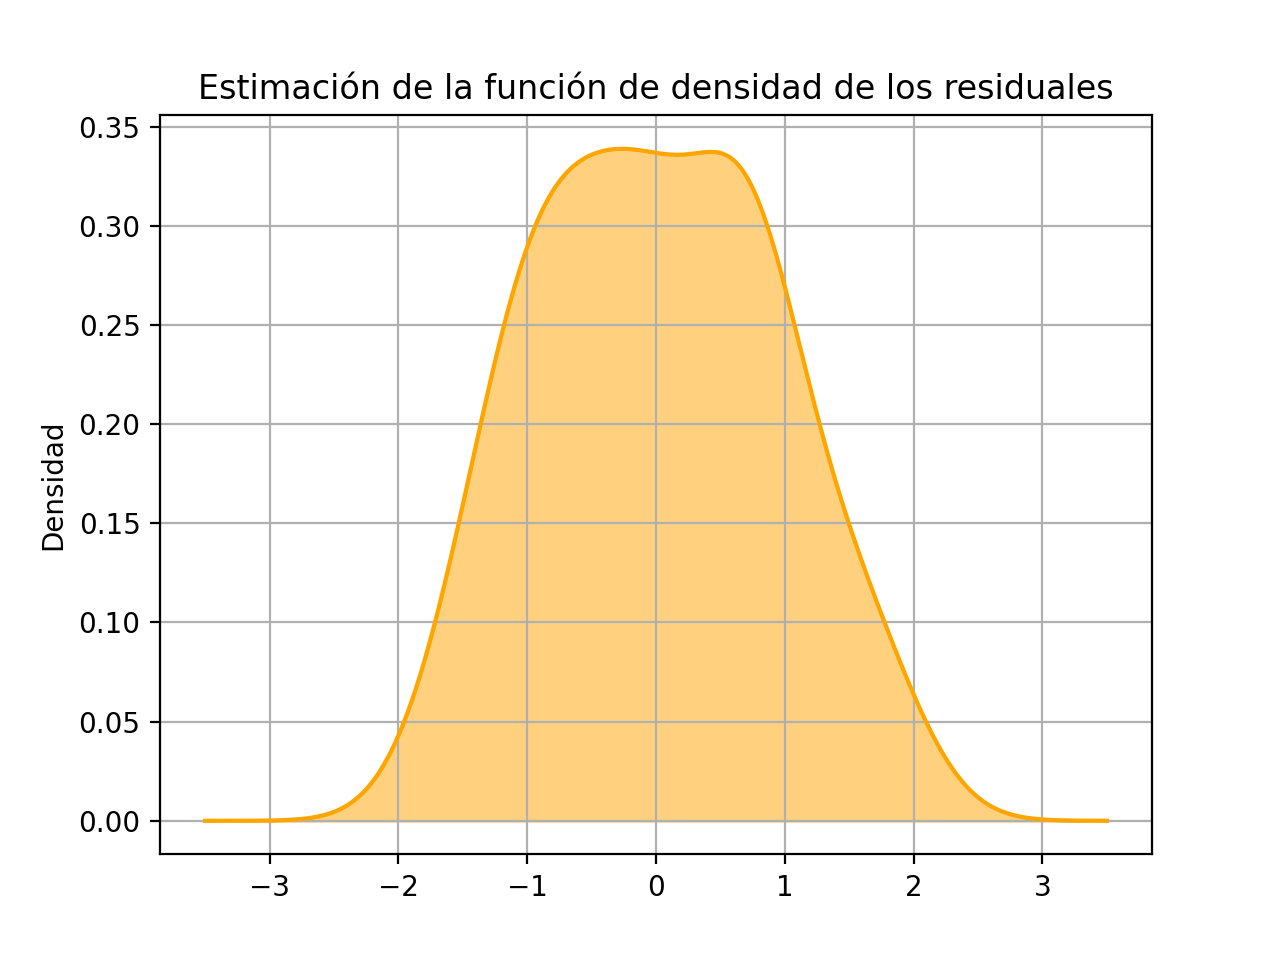
# Graficar función de densidad
x_grid = np .linspace (- 3.5 ,3.5 ,num = 500 )
kde = st .gaussian_kde (res )
y_vals = kde (x_grid )
plt .plot (x_grid ,y_vals ,color = 'orange' )
plt .fill_between (x_grid ,y_vals ,color = 'orange' ,alpha = 0.5 )
plt .title ('Estimación de la función de densidad de los residuales' )
plt .ylabel ('Densidad' )
plt .grid ()
plt .show ()
# Prueba de normalidad
st .kstest (res ,st .norm .cdf ).pvalue # Otra prueba de normalidad
st .shapiro (res ).pvalue # Prueba de distribución t
n_res = len (res )
n_par = 2 * (len (tr .años_desarrollo ) - 1 )
st .kstest (res ,lambda x : st .t .cdf (x ,df = n_res - n_par )).pvalue 