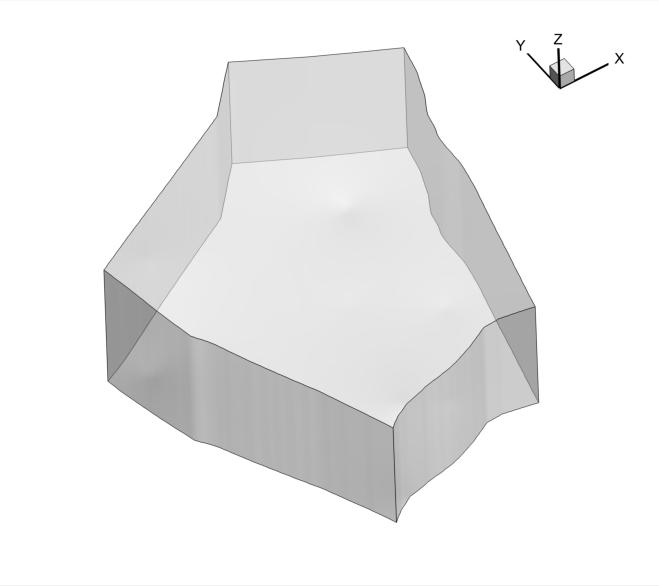
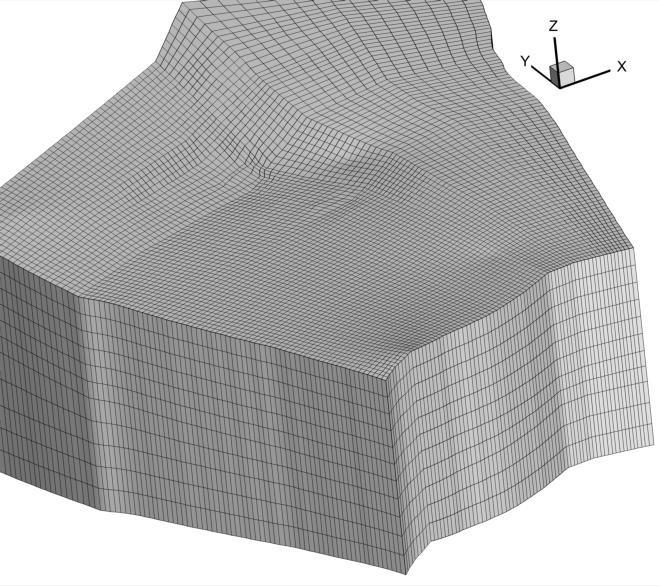
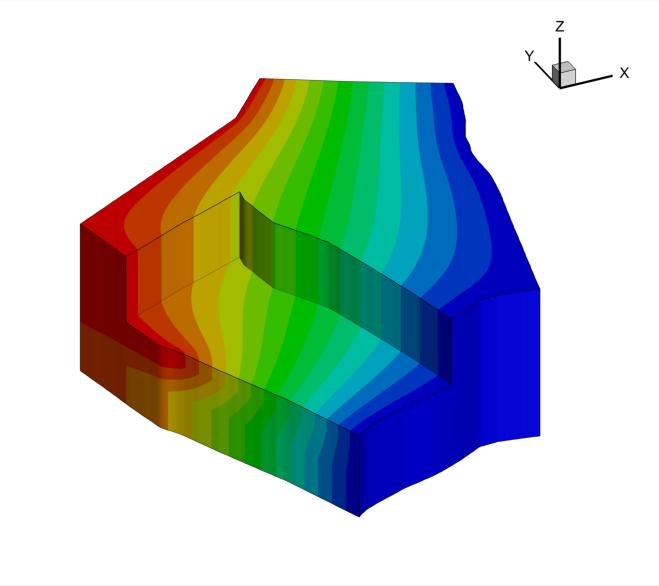
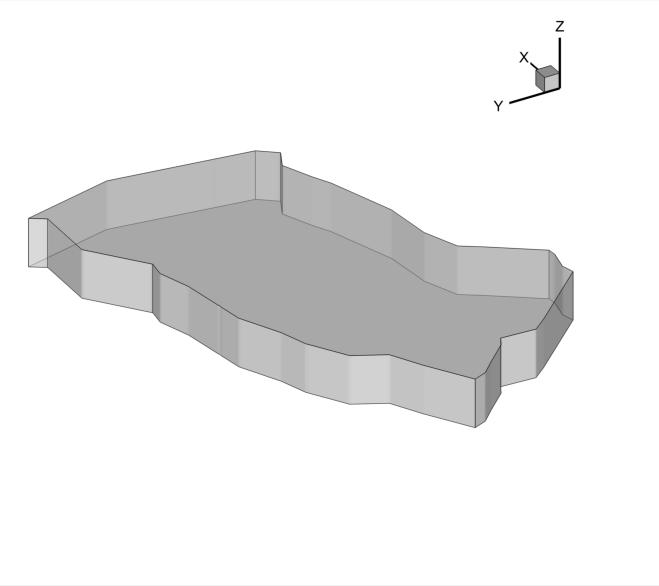
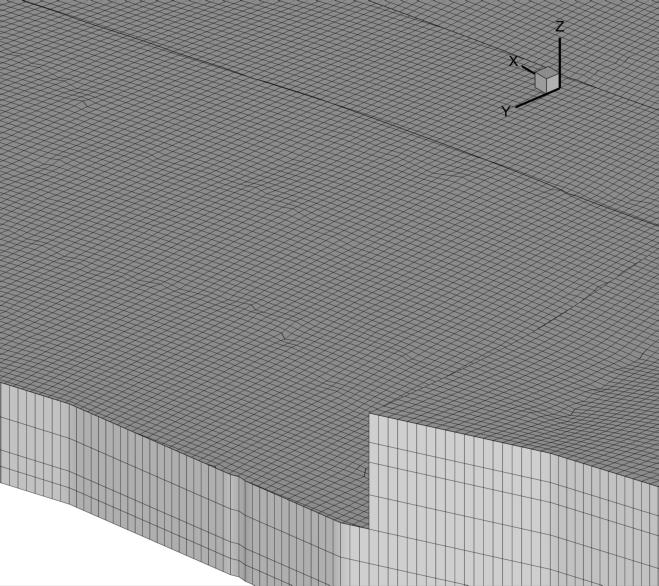
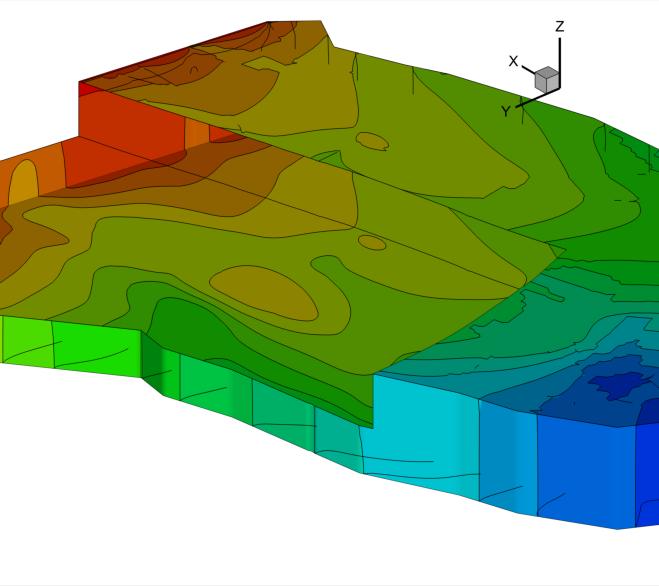
GridGen is a command-line elliptic grid generation program which is designed to quickly setup logically-rectangular (or IJK ordered) finite volume/element hexahedral meshes for three-dimensional stratigraphic models of porous media subsurface aquifers. It could also be used for interpolation of soil types from 2D cross-sections, or for geological surface reconstruction from 2D scatter datasets. It is compatible with GwMove hydrogeological modelling software and could be easily tweaked to adapt to input requirements by other community hydrogeological (or earth-sciences) computer modelling codes.
The gridding algorithm is based on numerical solution of an elliptic PDE namely the two-dimensional Laplace equation in the plane [1,2,3]. Next, to build the full 3D grid, the planar grid is extruded into intermediate slices separating hydrogeological units with different lithologies. Intermediate slices in each hydrogeological unit may be specified to get required accuracy along the vertical direction. The method is proven for its ability to generate very smooth and very high quality meshes for demanding finite volume and finite element solvers.
The power of GridGen lies in simplicity of usage and lightweight portable code which could be integrated right away into the core of legacy Fortran programs for automated boundary-fitted grid generation. However, it's not a universal automatic mesh generator since it is not possible to mesh general domains especially those with internal geometric constraints. Even with these limitations the program has proven suitable for many groundwater modelling projects and has been used extensively by the authors and their colleagues.
GridGen is an open source initiative copylefted under the terms of GPL3 license. It's brought to you to be useful by helping you not to reinvent the wheel. We'll be very pleased to use the following citation when reporting results with this program:
Sbai, M.A. (2016). GridGen v1.0. Zenodo. 10.5281/zenodo.60439
31/08/2016
Add soil types interpolation feature: Complex stratigraphic hydrogeological models could be constructued from prior information provided in a list of cross-sectional soil types profiles as sketched by a geologist. Interpolation into grid cells is performed with an algorithm based on the nearest neighbor (or natural) interpolation technique.
A brief showcase example corresponds to example 6 below.
More explanations on the algorithm, file formats, etc. may be consulted in the Wiki pages.
Enjoy !
The program has been tested on the following platforms:
- Microsoft Windows XP/7/10
- Ubuntu Linux
- Cygwin (Linux emulation layer for Windows platforms)
The following compilers are equally supported:
- Intel Visual Fortran 11.1 or above
- GNU Fortran 4.2 or above
However only the following Platform/compiler combination has been tested to date:
- Windows + Intel Visual Fortran
- Ubuntu Linux + GNU Fortran
- Cygwin + GNU Fortran
Follow the instructions below to compile GridGen in your platform.
You must have installed Microsoft Visual Studio 2005 or above with a compatible Intel Visual Fortran compiler. You must select the installation of the Visual Studio integration package during the last installation to build VS Fortran projects right away from the graphical user interface.
- Double click on the Visual Studio 2005 solution file 'GridGen.sln' to launch it in Visual Studio 2005. For later versions, accept the project upgrade process and save your newly converted solution.
- Select 'Release' as a solution configuration and 'Win32' as a solution platform from the two dropdown menus in the main toolbar.
- Fire 'F7' key or select 'Build > Build Solution' menu command, then wait for a few minutes until compilation of all the project files.
- The target executable is located in 'bin' subdirectory of the distribution root folder.
That's all!
Go to the root folder first, then copy & paste the following sequence of commands to your console window or a new shell file created by your own:
mkdir build
cd build
gfortran -c ../src/string.f90
gfortran -c ../src/globals.f90
gfortran -c ../src/bndFitted.f90
gfortran -C ../src/buildConnec.f90
gfortran -c ../src/command_line_syntax.f90
gfortran -c ../src/main.f90
gfortran -c ../src/interpsoils.f90
gfortran -c ../src/parse_command_line.f90
gfortran -c ../src/writeMesh.f90
gfortran -c ../src/writeTecplot.f90
gfortran -c ../src/xybord.f90
gfortran -c ../src/xyfixed.f90
gfortran -c ../src/xyfree.f90
gfortran -c ../src/zfixed.f90
gfortran -c ../src/zfree.f90
gfortran *.o -o gridgen
rm *.o *.mod
Finally, install the binary file into any folder in your system path (e.g. ~/bin):
mv gridgen ~/bin
We beleive the code, in its current version, is portable to other platform/compiler combinations since it's made from a few routines. If not this should be very easy to fix. Please report any problem to the [author](
)We offer binary releases for windows platforms (>7) and they may be found in the 'releases' page of this github repository.
Run GridGen by simply typing the following command:
.\gridgen -i example1
 Project = example1
                    Generation of the finite element grid ...
 Reading input file...
 Gridding in the XY plane
 Projection to Z-layers
 Writing native mesh file
 Writing mesh to Tecplot file ...
where example1 is the prefix of the project to be processed.
The program expects an input file with .grd extension (i.e. example1.grd). The file structure is quite simple as it is composed from the following sections:
- Three lines of user given comments
- Target dimensions of the grid
- List of bounding polygon points and their respective logical coordinates
- List of 3D mesh slices along with their positions
A fully detailed description of this file format will be add the wiki pages.
For each project the computer program creates 3 output ASCII files for the sake of portability and archival purposes. These are:
- A native
<project>.femfile which holds nodal coordinates and the element-nodes connectivity table as required by GwMove - A
<project>.pltfile which holds an image of the 3D mesh in Tecplot format - A
<project>.datfile which recalls the general characteristics of the generated structured finite element mesh
This is not the purpose of a command-line program like this. To visually examine the generated mesh which is indispensable in practice except for the simplest cases, you have two alternatives:
- Use Tecplot which is an outstanding commercial program for 3D visualization of results from Finite Element codes. If you got it installed in your PC just double click on the output Tecplot file to open it up. Read Tecplot manual to learn how to post-process your files.
- Use the Tecplot filter available in Paraview visualization software to load the generated Tecplot file. Since this software is Open-Source and readily available it is definitely the choice for people who don't own a Tecplot license.
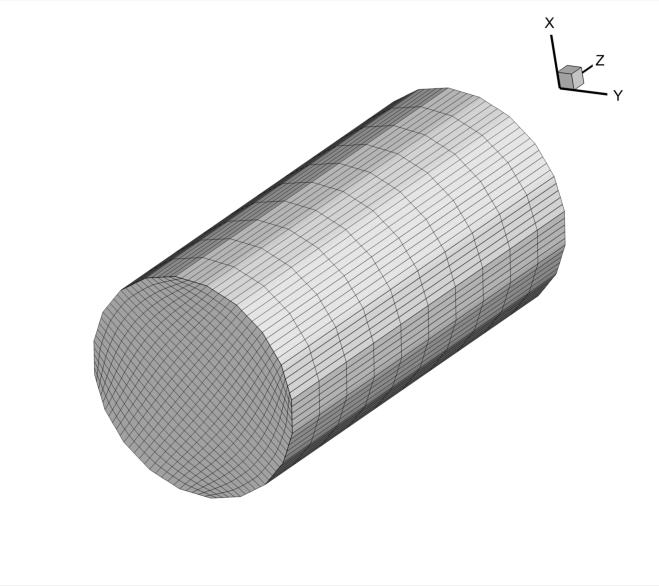
Here is an example of grid construction fitting the boundaries of a soil sample. First, we start by 2D gridding in the plane where 20 points of the circular circumference have been specified among which only four corner points have been explicitly fixed. Finally, the 2D mesh is simply projected in the vertical direction with equidistant spacing. Here it is:
This is not useful in common hydrogeological applications but it is valuable in other contexts such as for two-phase / multiphase flow simulations to replicate laboratory experiments with other dedicated engines. We'll post a computational example later on.
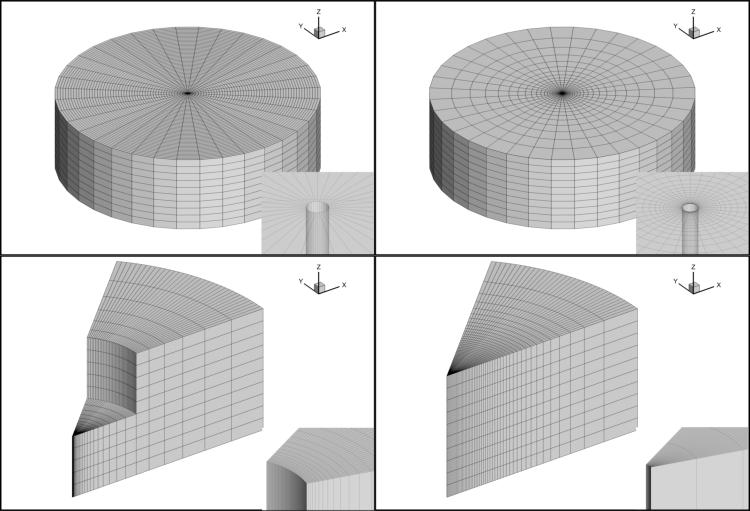
Another, commonly encountered situation in hydrogeology is related to well testing of hydrogeological characteristics of single and/or multiple aquifer systems. Analytical solutions for special cases are standard practice. To go even further by alleviating all the limitations of available analytical solutions a numerical groundwater flow model is more appropriate. In this context GridGen is also useful since it has the ability to generate high quality grids around the wellbore. The area between the internal well radius and a given far flow boundary at which the drawdown is negligible is gridded. The radial spacing could follow a linear, logarithmic or geometric distribution as shown in the following figure:
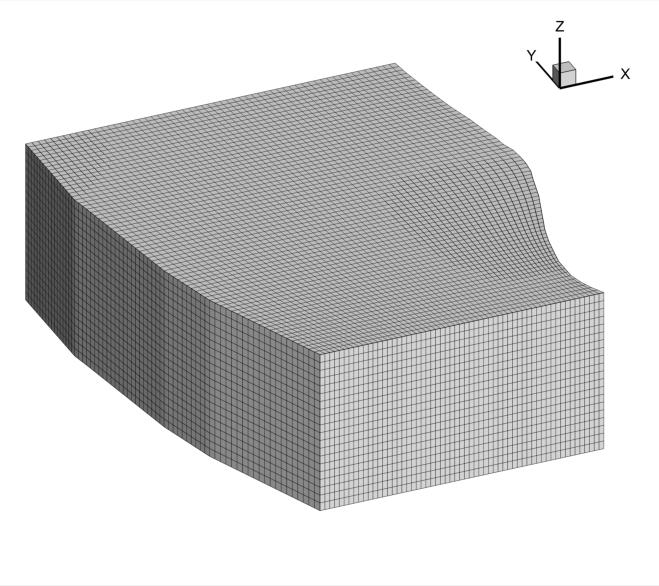
GwMove works hand-in-hand with GwMove since the latter accepts directly the native output grid format produced by GridGen. Here is an example where the initial mesh for a 3D groundwater flow model in a phreatic aquifer bounded by a plateau and a river is constructed by GridGen:
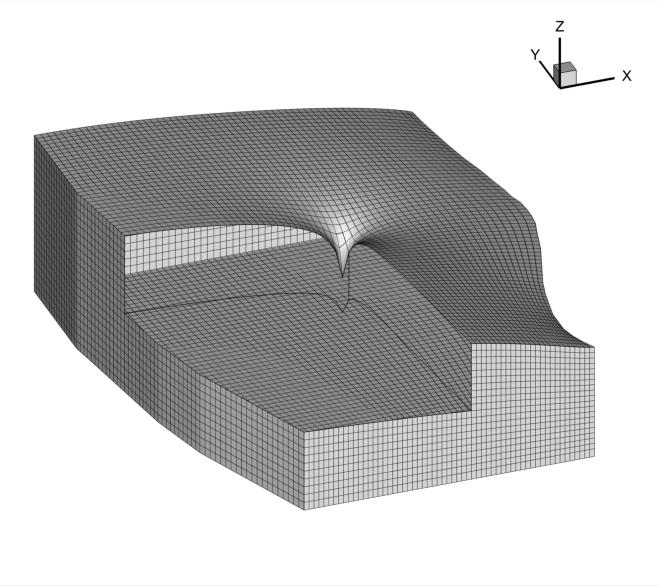
GwMove owing to its built-in layered adaptive mesh technique finishes computational work when the mesh upper slice converge to the expected water table position as shown below. Notice the mesh smoothness and the nice reproduction of the maximum drawdown around the pumping well even with an important vertical exaggeration and nearby coarse meshing.
This example demonstrates typical use of the program in the context of a realistic application designed to model flow and solute transport in a multilayer aquifer system. The upper unit belongs to an unconfined aquifer whose mean depth is 11.7m while the lower confined aquifer mean depth is 5.7m. The two aquifers are separated by an aquitard with uniform thickness of 4.5m. A landfill contaminant area (not shown here) is located at the upper slice. The ''snappy nodes' feature of the code was used to snap the closest nodes to this inner boundary and locate all nodes inside this polygon. The figure showing the aquifer geometry is just displayed below:
Here is a close-up view of the full 3D mesh which was designed for the groundwater simulation. It is composed from 73 nodes (or 72 cells), 89 nodes (or 88 cells) and 12 slices (11 layers) aligned along the X, Y and Z directions respectively. Thus, forming a mesh whose total number of nodes is 77964 and total number of hexahedral cells is 69696.
Here is an example of the steady-state groundwater flow simulation with GwMove software computed on the previously constructed grid. Details of the simulation will be documented in GwMove wiki pages.
This illustrates the setup of a 3D model of flow and transport from a radioactive waste disposal facility in a clayey layer whose geometry is given below:
The computational and accuracy requirements lead to the design of a very fine mesh with 232 X 125 X 9 = 261000 nodes and 229152 hexahedral cells in total. The mesh is so dense so that it is not possible to distinguish the mesh details when viewing the whole model. Thus, only an aquifer portion centred on the waste disposal facility is visualized in the following figure:
This is an example of the complex groundwater flow patterns at a selected time around the radioactive waste repository:
One challenging issue in groundwater modelling practice is representation of the inherently complex geological features at different scales in subsurface aquifers. The defacto standard in three-dimensional groundwater modelling practice is to setup layered models whose slices gently follow the aquifers/acquicludes interfaces. Obviously this is not possible in general, but it's possible to do it with GridGen since version 2.0.0.
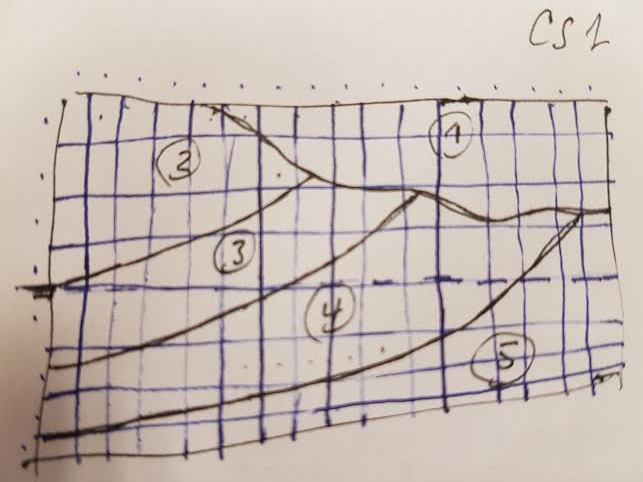
Let's consider the following geologist's sketch of a soil type cross-section orthogonal to Y-axis (the vertical Z scale is exaggerated):
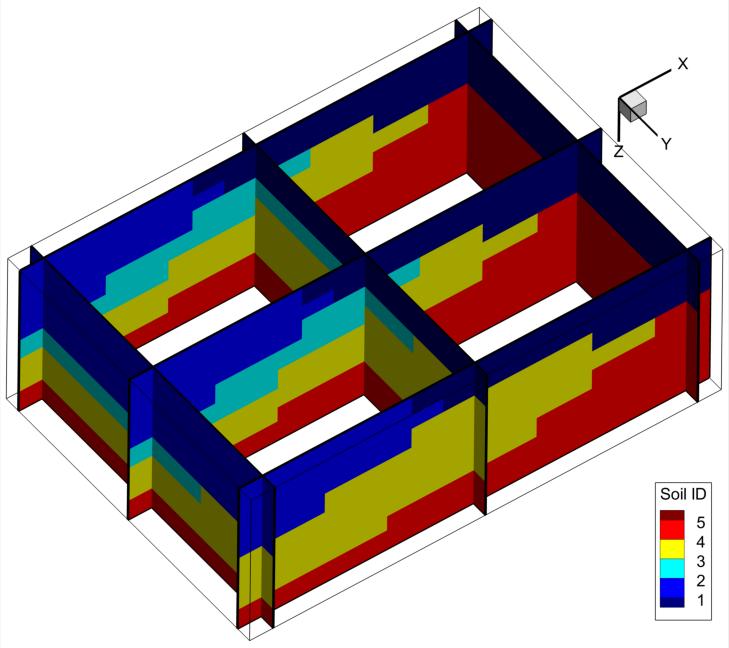
Additionally, let's assume that the third soil type (or horizon numbered by 3) does only exists in the back along the Y-axis but completely disappears when approaching the front along this axis direction. Soil type 3 is replaced by the underlaying material (soil type 4) in this way. We consider then two soil types cross-sections at positions Y = 100m and Y = 6900m (close to the back and front faces, respectively) and whose distances of influence are 5000m and 2000m, respectively. A cross-section distance of influence is a parameter which selects the spatial neighborhood zone around each plane for preferential interpolation. All cells lying within this zone will have the soil type of the nearest point among all neighbor cross-section profiles.
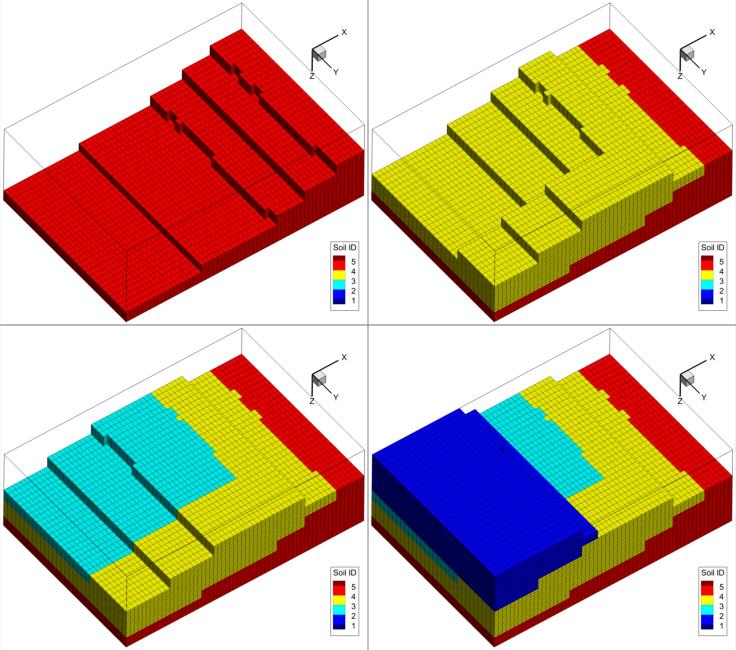
Here we show a fancy plot of the 3D interpolated soil types on a 60 x 30 x 30 regular grid size discretizing an area of 10Km by 7Km of areal extent and with 150m depth. Notice, that the assumption of regularity is only applicable to this demonstration example. GridGen is indeed able to do the same job on logically rectangular grids which are curvilinear. From the last plot we notice the reproduction of the initially entered two Y-orhogonal cross-sections and another two midway cross-sections showing how soil types interpolation is performing, namely how layer number 3 (with cyan color) is disappearing.
The next figure shows the three-dimensional saptial distributions of the soil types from bottom to top. It is clear that our final model exactly fits our initial conceptual model sketched by hand.
This is just an example, in practice soil type profiles could be imported from a diversity of sources such as geomodelling software, geophysical characterization, local information from boreholes, etc.
These are the features to be integrated into the next releases. These are already operational, it will take just the time to clean-up the code, make some nice examples and yeah!
- Build grid slices from two-dimensional scatter points by surface spline interpolation.
- Three-dimensional interpolation of scalar fields from 3D scatter data in space.
- Transfer (i.e. projection) of scalar fields between meshes of the same domain.
- Interpolation of scalar and vector fields in three-dimensional space by the natural neighbor interpolation method.
- Extraction of local subdomain meshes from a regional mesh of an aquifer system.
- Control of coordinate line spacing by functions embedded in the partial differential operators of the generating system and by subsequent stretching transformation.
- Snappy nodes feature.
- Grid output in formats compatible with other community groundwater modelling codes (i.e. USGS's SUTRA, ...).
- Disappearing layers feature ('Couches biseautées' in French).
- Mesh cases feature.
- Output to native VTK mesh format.
- Python wrapper around the program's subroutines.
The initial F77 program (Geo_Grid) was developed by Prof. Abdelkader Larabi (now @ Ecole Mohammedia d'Ingénieurs, University M. V, Rabat, Morocco) during his Ph.D. Thesis between 1990 and 1994 at the laboratory of Hydrology, Free University, Brussels. It was improved by Dr. M. Adil Sbaï (now @ French Geological Survey) during his Ph.D. thesis days between 1995 and 1999 in the same department. Since then the program was continuously improved and extensively used in many groundwater modelling projects.
[1] Thompson, J.E., Thames, F.C., Mastin, C.W. (1974). "Automatic Numerical Generation of Body-fitted Curvilinear Coordinate System for Field containing any Number of Arbitrary Two-Dimensional Bodies". J. Comput. Phys., 15(3):299–319. doi:10.1016/0021-9991(74)90114-4.
[2] Thompson, Joe E., Warsi, Z. U. A. and Mastin, C. W. (1982). "Boundary-Fitted Coordinate Systems for Numerical Solution of Partial Differential Equations -- A Review", J. Comput. Phys., 47(1):1-108. doi:10.1016/0021-9991(82)90066-3.
[3] Thompson, Joe E., Z.U.A. Warsi, Z. U. A. and Mastin, C. W. (1997). Numerical Grid Generation: Foundations and Applications, Elsevier Science Publishing Co., Inc.
