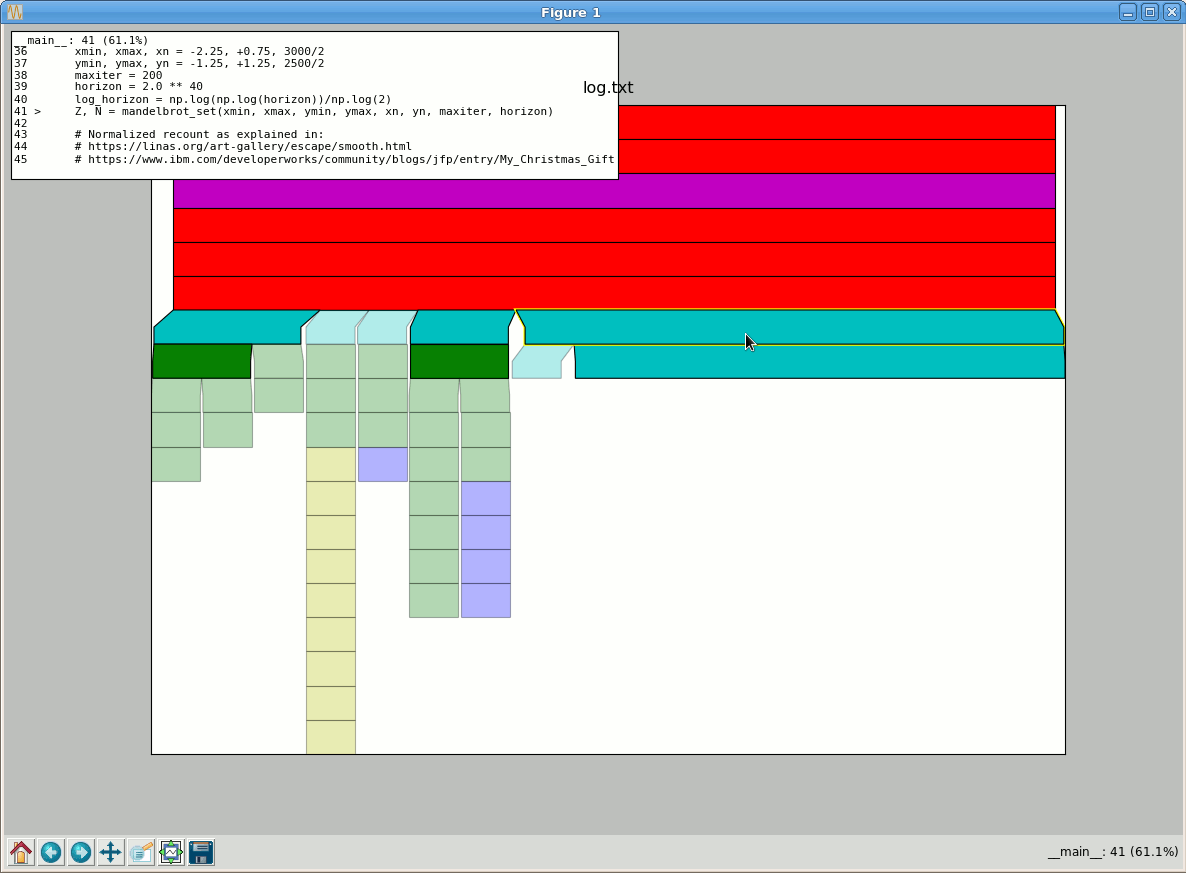
Kapture is a simple implementation of a time-sampling profiler, written in pure Python. It includes a graphical representation of the results (based upon matplotlib) to easily investigate bottlenecks and hot-spots.
Kapture currently needs to run inside the installation of Python you wish to profile. It is written in pure python and depends only on the standard library (mostly pdb). The visualisation component of kapture depends on matplotlib and numpy.
Kapture can be installed from the source directory with:
pip install .

OR

python setup.py install
Once installed, kapture's usage is:
python -m kapture [-l LOG] (-c command | -m module-name | script) [args]
For example, the profile of matplotlib's mandelbrot example:
$ python -m kapture ~/Downloads/mandelbrot.py
Pausing for user process to start...
Sample #1
Sample #2
Sample #3
Sample #4
Sample #5
Sample #6
Sample #7
Sample #8
Sample #9
Sample #10
Sample #11
Sample #12
Sample #13
Sample #14
Sample #15
Sample #16
Sample #17
Sample #18
Killing
Traceback (most recent call last):
  File "kapture/__main__.py", line 55, in <module>
      main(sys.argv[1:])
  File "kapture/__main__.py", line 32, in main
      process.kill()
  File "/opt/scitools/environments/default/2018_05_22-1/lib/python2.7/subprocess.py", line 1572, in kill
      self.send_signal(signal.SIGKILL)
  File "/opt/scitools/environments/default/2018_05_22-1/lib/python2.7/subprocess.py", line 1562, in send_signal
      os.kill(self.pid, sig)
OSError: [Errno 3] No such process
Whilst this is somewhat messy standard out, the result is a log.txt
(see example log) documenting the sampled profile.
We can take a look at this with:
$ python -m kapture.blockview -l log.txt
Unlike tools like pyflame, we visualise the blocks descending from the top. Therefore the very top box is the invocation, and the lowest blocks are the deepest calls in the stack. Clicking on the individual boxes gives us some context of the call stack, and a helpful preview of the code that ran.
Kapture was written at the Met Office in order to profile a complex python codebase. It was originally written in 2012 before a number of other tools were available. These other tools fill a similar space, and may also be worth considering when profiling your python codes:
Kapture is available under a BSD 3-clause license.
