This is an example of how to configure and deploy the InfluxDB v2.0 connector for Apache Flink in a real-world scenario on Kubernetes. It is an end-to-end test which leverages both the InfluxDB v2.0 source and sink connectors.

Look at…
-
PlaneJob.javato learn how to use the Source and Sink connectors with the DataStream and Table/SQL APIs -
telegraf.confto find out how to configure Telegraf to write to the Flink InfluxDB source -
the Kubernetes service
- 3+ CPU cores
- 8GB RAM
- Recent Linux OS, setup was tested on Ubuntu 20.04
- Install the required tools
-
Create k3d cluster
k3d cluster create flink kubectl config use-context k3d-flink kubectl cluster-info -
Deploy InfluxDB with Helm
helm repo add influxdata https://helm.influxdata.com/ helm upgrade --install --set adminUser.password=adminadmin influxdb influxdata/influxdb2 -
Deploy Flink
kubectl apply -f- <<'EOF'
---
apiVersion: v1
kind: ServiceAccount
metadata:
  name: admin-user

---
apiVersion: rbac.authorization.k8s.io/v1
kind: ClusterRoleBinding
metadata:
  name: admin-user
roleRef:
  apiGroup: rbac.authorization.k8s.io
  kind: ClusterRole
  name: cluster-admin
subjects:
- kind: ServiceAccount
  name: admin-user
  namespace: default

---
apiVersion: v1
kind: Pod
metadata:
  name: flink-cluster-manager
spec:
  serviceAccountName: admin-user
  containers:
    - name: flink
      image: flink:1.12.1-scala_2.12-java8
      args: ["bin/kubernetes-session.sh", "-Dkubernetes.cluster-id=osdp", "-Dexecution.attached=true", "-Dresourcemanager.taskmanager-timeout=3600000", "-Dtaskmanager.memory.process.size=1024MB", "-Djobmanager.memory.process.size=1024MB", "-Dkubernetes.jobmanager.service-account=admin-user", "-Dkubernetes.rest-service.exposed.type=ClusterIP"]
Troubleshooting:
- Run
kubectl get pod. Verify there is a runningflink-cluster-managerandosdp-SOMETHING-SOMETHINGpod. - If there is no
osdp-SOMETHING-SOMETHINGpod, look at theflink-cluster-managerlogs:kubectl logs pod/flink-cluster-manager
- Run
-
Build Flink App
docker-compose build flinkapp docker-compose run --rm flinkapp bash gradle shadowJar -
Copy Flink App JAR and submit it to the Flink cluster
kubectl cp build/libs/flink-influxdb-app-0.1-SNAPSHOT-all.jar flink-cluster-manager:/opt/flink/job.jar
kubectl exec -it flink-cluster-manager -- bash
./bin/flink run --jobmanager osdp-rest:8081 ./job.jar
Troubleshooting:
- When running
./bin/flink run, the command should print "Successfully submitted job ID" - Flink should spawn a new pod (
kubectl get pod) with the nameosdp-taskmanager-1-1. Verify the pod is running. If it isn't, this may be because of resource constraints (such as not having enough CPU resources). You can verify withkubectl describe pod osdp-taskmanager-1-1.
- When running
-
Create a Kubernetes Service to allow Telegraf to discover the Flink InfluxDB source:
kubectl apply -f- <<'EOF'
---
 apiVersion: v1
 kind: Service
 metadata:
   name: influxdb-source
 spec:
   selector:
     app: osdp
     component: taskmanager
   ports:
   - port: 8000
EOF
This will create a service with a ClusterIP which binds to all Task Manager pods on port 8000. You can then use the source simply by pointing your client at
http://influxdb-source:8000as seen intelegraf.conf. -
Deploy Telegraf
docker build -t telegraf:flink telegraf
docker save telegraf:flink > telegraf.tar
k3d image import -c flink telegraf.tar
kubectl apply -f- <<'EOF'
apiVersion: apps/v1
kind: Deployment
metadata:
  name: telegraf
spec:
  selector:
    matchLabels:
      app: telegraf
  replicas: 1
  template:
    metadata:
      labels:
        app: telegraf
    spec:
      containers:
      - name: telegraf
        image: telegraf:flink
EOF
Troubleshooting:
-
Have a look at the Telegraf logs. Find the name of the active Telegraf pod and views its logs:
# kubectl get pods | grep telegraf
telegraf-6b6b7696bb-4h7fj   1/1     Running   0          19m

# kubectl logs telegraf-6b6b7696bb-4h7fj
2021-03-16T14:03:10Z I! Starting Telegraf 1.17.3
-
-
Access the InfluxDB Web Interface
Run
kubectl port-forward service/influxdb-influxdb2 8082:80to forward the InfluxDB web interface server to your local machine on port 8082.Open http://localhost:8082, username is
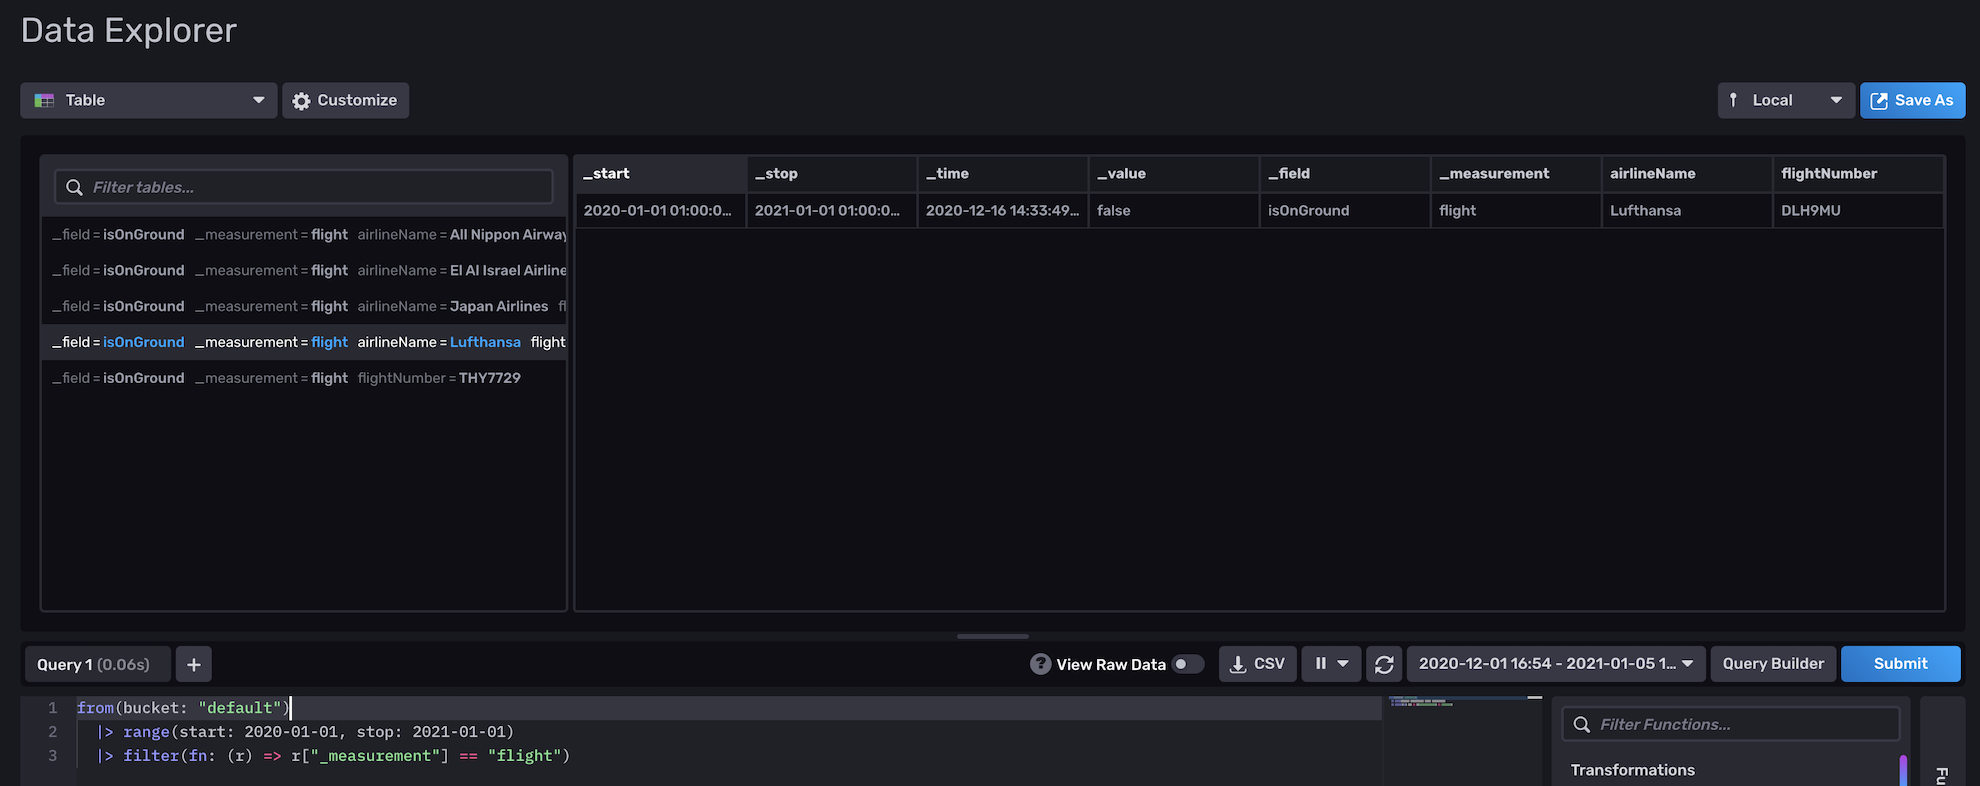
admin, and password isadminadmin.Log in and go to Explore. Click on Script Editor to open the Flux editor. Select Table as the visualization.
Run this query:
from(bucket: "default")
  |> range(start: 2020-01-01, stop: 2021-01-01)
  |> filter(fn: (r) => r["_measurement"] == "flight)
You should see some results as shown below:
-
Next Steps

- Access Flink Web Interface
kubectl port-forward svc/osdp-rest 8081:8081- Open http://localhost:8081
- For teardown and cleanup just run
k3d cluster delete flink.